Climate change and Australia s plantations. REGIONAL REPORT 6: Victoria and southern New South Wales Eucalypt plantations
|
|
|
- Alison Miles
- 5 years ago
- Views:
Transcription
1 Climate change and Australia s plantations REGIONAL REPORT 6: Victoria and southern New South Wales Eucalypt plantations
2 Introduction Plantations have been managed for wood production in Australia for over 1 years, and silvicultural practices for establishment and growth are welldeveloped, particularly for the more established parts of the industry such as the softwood sector (Snowdon and James 27). Australia s climate is becoming more variable, and this represents a potential opportunity or threat to the viability of Australia s plantations, and may mean changes in management or location of plantations may be required to capitalise on opportunities and reduce threats. The bulk of Australia s eucalypt plantations are located in cool temperate south western and south eastern Australia (Figure 1). This report summarises the possible consequences of more variable climate for eucalypt plantations in eastern and central Victoria and southern NSW eucalypt plantations by 23, in terms of stand productivity and wood properties, the likelihood of stand failure due to drought and implications of this for final stems per hectare, risks from fire and risks and impacts of pests. The report also presents possible adaptation strategies to reduce negative impacts of climate change on plantation productivity. This work was done as part of a FWPA-funded project, and more details can be found in the project final report, Adaptation strategies to manage risk in Australia s temperate plantations. Figure 1 Current distribution of eucalypt plantations in Australia (National Forest Inventory 212), and the focal region for this report (blue box).
 Increase in high FDDI days 65-7 7-75 75-8 8-85 85-9 9-95 95-1 - 5 6-1 11-15 16-2 21-25 26-3 Key Points Climate The")


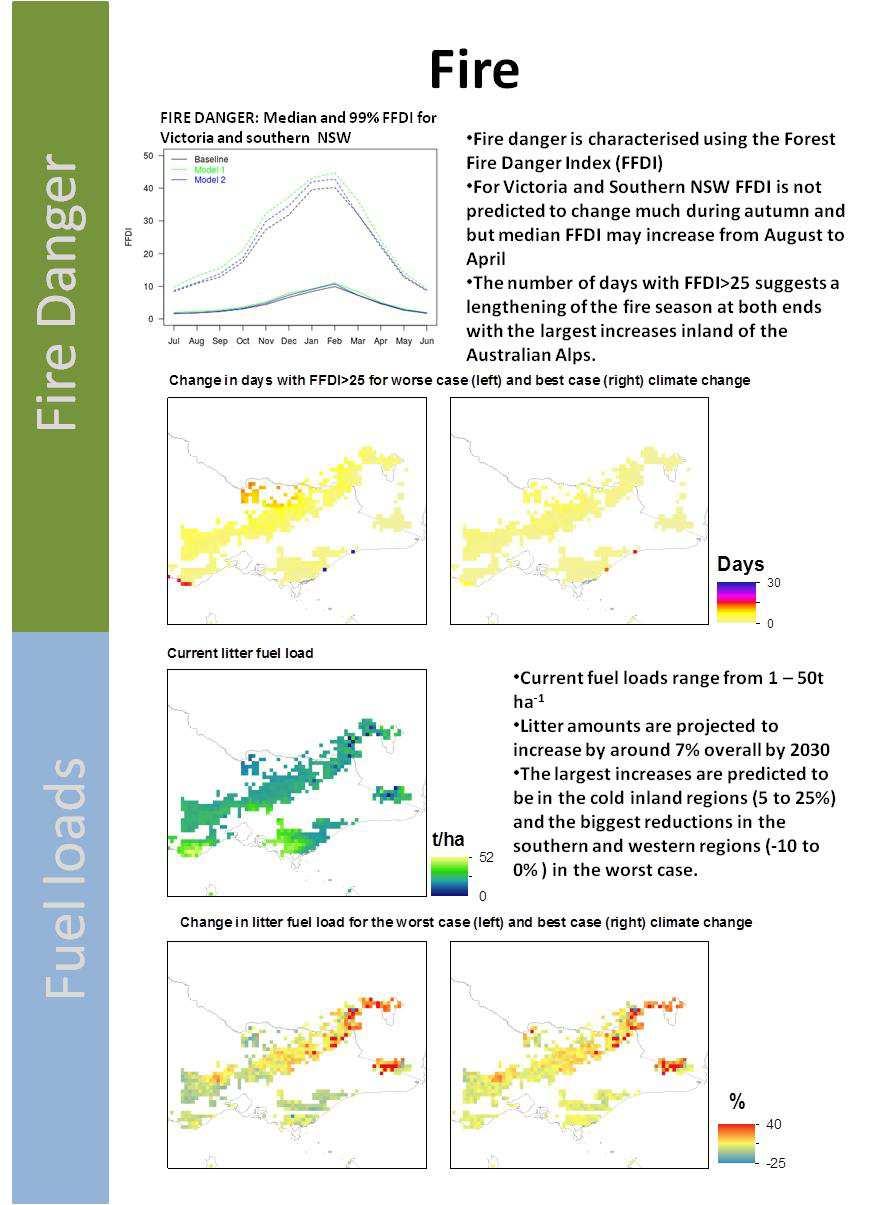
3 23 Victoria and southern NSW Regional Scorecard 23 Volume change with no elevated CO 2 (Medium fertility, deep soils) Least favourable Median Most favourable Percentage change in production from current % < >25 Median Mortality (remaining SPH from 1) Increase in high FDDI days Key Points Climate The climate is predicted to be warmer and drier with average temperature increases of.74 degrees and a 7% decrease in rainfall. Stand Volume and survival In the absence of an elevated CO2response, we can anticipate either no change or in decreases up to % in some parts along the coast or the dry inland regions. Areas that are potentially limited by cold temperatures may see increases in productivity as temperatures warm. The number of rotation failures and the level of mortality increases in the dry inland areas at the edges of the estate but overall mortality is minimal Adaptation option Fire risk There are moderate increases in risky fire weather (forest fire danger index, FFDI, >25) predicted for the majority of the estate. There are some significant increases in the dry inland areas and some coastal areas Changes in fire weather and intensity are Pest risk Areas at high risk of pest damage are unlikely to change much by 23 Areas with optimal climate (EI) have climatic conditions conductive to high levels of defoliation (>6%) in most years Number of rotations where there was plantation failure (out of 1) Optimum climatic suitability: defoliating pests Mycosphaerella Mycosphaerella leaf disease EI > 37 Puccinia Myrtle rust EI > 45 Uraba lugens EI > 2 Overview

4 23 Volume change with no elevated CO 2 Shallow soil Current production Least favourable Median Most favourable Key points Production Deep soil Shallow soil Current production Legend Volume m 3 ha -1 High : 25 Low : 5 Least favourable Median Most favourable Percentage change in production from current % < > Volume change with elevated CO 2 Current production Least favourable Median Most favourable Where there is no response to elevated CO2 production is predicted to range from losses up to 25% to positive responses of 25%. The southern parts of the estate are generally predicted to remain similar under the median scenario with decreases of up to 25% in the least favourable scenario. These areas are amongst the more productive parts of the region. The colder areas around the Australian Alps are likely to see increases in production as the temperature limitations are reduced. Inland areas around Shepparton and Echuca are likely to incur significant reductions in productivity. In regions where productivity is predicted to decrease (less than 25% loss), adaption through changes in silviculture may mitigate the potential losses in production. Deep soil Current production Least favourable Median Most favourable Legend Volume m 3 ha -1 Percentage change in production from current % High : 25 Low : 5 < > 25 Where there is predicted response to elevated CO2, productions is positive across both deep and shallow soils, bar some inland regions (Shepparton to Echuca). This area is likely to be significantly impacted under the least favourable and median futures. It is predicted there will be significant reductions in survival and adaptation options are limited. The largest increases are generally seen where production is low and small absolute gains can have a large percentage increase.
5 Adaptation to changes in production and mortality Site A Site C Site B Adaptation strategies examined were reduced spacing, and reduced spacing + fertiliser application Without these strategies all three reference sites are predicted to experience a drop in productionby 23 Site A 5 4 SPH1 (Original) SPH1 fertiliser (Option 1) SPH8 (Option 2) SPH8 fertiliser (Option 3) Volume m 3 ha Stems per ha remaining (%) Effects in change in stocking and fertiliser application on production and mortality Site B Volume m 3 ha -1 Effects in change in stocking and fertiliser application on production and mortality Site C 4 a Volume m 3 ha -1 Effects in change in stocking and fertiliser application on production and mortality SPH 1 (Original) SPH 1 fertiliser (Option 1) SPH 8 (Option 2) SPH 8 fertiliser (Option3) SPH 1 (Original) SPH 1 fertiliser (Option 1) SPH 8 (Option 2) SPH 8 fertiliser (Option3) Stems per ha remaining (%) 1 8 SPH 1 (Original) SPH 1 fertiliser (Option 1) SPH 8 (Option 2) SPH 8 fertiliser (Option3) Stems per ha remaining (%) Site A: Modelling suggests reducing the number of sph from 1 to 8 resulted in little change in production but reduced mortality levels to insignificant levels. Applying fertiliser may increase production but there is an increased risk of mortality, on average 5% loss but up to 25% Site B: Modelling suggests reducing the number of sph from 1 to 8 resulted in little change in production (- 2%) but reduced mortality levels to insignificant levels. Applying fertiliser may increase production without increasing risk when planting at 8 sph and a small increase in risk at 1sph. Site C: At some locations we predict a high proportion of failures irrespective of silviculture, giving a b-modal distribution of yields, with those that fail during critically dry years at one end of the scale and those that survive yielding modest production. One those very drought prone sites fertiliser application increases the risk of failure and reduces overall production through exacerbated drought effects. Adaptation Strategies
6
7
8 Defoliation at 3 years Pests % Defoliation Defoliation at 8 years % difference in final volume (control-defoliated) Fertility High Med Low (489) (377) (259) Fertility High Med Low (489) (377) (259) Higher rainfall site Production Pests: % difference in final volume (control-defoliated) Fertility High Med Low (292) (21) (155) Pest damage may amplify negative effects of climate change on stand productivity. Defoliators are the main pest types in the region (Table 2). For 2 indicative sites (wetter and drier, and either low. medium or high fertility), we predict that: Maximum reduction in final volume will average 15% at these sites (~3-7 m3/ha), with greatest impact occurring with high defoliation and high fertility (Figure 11) There will be considerable between-site variability in responses Greatest impact of defoliation on final stand volume will occur when defoliation is high and fertility is high Later age defoliation is likely to have a greater impact than early age defoliation Multiple defoliations will have a substantially greater impact on volume than single events, resulting in up to 2% reductions in final volume (~4-1 m3/ha) particularly at high rainfall sites( Figure 12) Lower rainfall Fertility High (292) Med (21) Low (155) Lower rainfall site Figure 11. Effectof asingle early (3 years)- or later (8 years)-age defoliationevent on final stand volume,(age 15) for a wetter and drier site. The more negative the number, the larger the impact. High, med and low indicate site fertility levels. Numbers in brackets indicate predicted final stand volume in the absence of defoliation. Higher rainfall % difference in final volume (control-defoliated) High Med Low High Med Low Site fertility Site fertility Figure 12. Rotation-length effects of single versus 3 6% defoliations starting at age 8, for a lower and higher rainfall site and three fertility levels
9 Possible effects of climate change on abundance of current key pests in the region Key pests Christmas beetles Damage type Damage age Warmer temps Defoliation All acgvity mortality if soil temp >3 C Eucalypt weevil Defoliation All generagon mortality Spring beetles Defoliation All acgvity Autumngum moth Defoliation Seedlings and young trees generagon mortality Eucalypt beetles Defoliation All generagon mortality Gum leaf skeletoniser Creiispsyllid Septorialeaf blight Mycosphaerella leaf disease Defoliation All generagon mortality Defoliation, discoloration Seedlings and young trees generagon mortality Defoliation All spores and growth if also higher humidity Defoliation Pre canopy closure spores and growth if also higher humidity heatwaves Drought Storms mortality autumn adult emergence mortality Shorter diapause larval survival and emergence Wet soil a trigger for adult emergence mortality abundance abundance if host is waterlogged spores and growth spores and growth spores and growth if also higher humidity spores and growth if also higher humidity Risks from climate change Eucalypt stem borer Stem damage Post canopy closure abundance abundance The main pests damaging eucalypt plantations in this region are defoliators Defoliating insects and stem borers are likely to be favoured by warmer mean temperatures but generally not by heatwaves Foliar diseases will be favoured by warmer mean temperatures but increasing droughts will likely reduce the abundance and distribution of these pests Stem borers are attracted to stressed trees and may amplify drought impacts Management strategies to control defoliation impacts are limited (Table 3), and include fertilising to promote crown recovery, thinning to reduce drought stress and monitoring/controlling insect populations Table 3. Possible management strategies for reducing the impacts of pests on stand productivity Damage type Defoliation Stem damage All Management strategy Fertilise to promote crown recovery Thin plantations to manage drought stress Monitor populations and control when populations are high Comments May increase drought mortality risk Can help manage drought risk Requires understanding of threshold population numbers for risk monitoring and modelling Adaptation strategies
10 Methods CLIMATE: Historical climate data were obtained from the Bureau of Meteorology s Data drill, consisting of interpolated grids splined using data from meteorological station records at a scale of.5 degrees, covering the years We used the Climate Futures Framework (Whetton et al 212) to select climate models that represented the worst case, most likely and best case climate futures for the main temperate plantation regions in Australia, resulting in 4 5 climate models being run per region, using an A2 emissions scenario. A regular grid of.1 degree was used across all regions, and climate data were generated centred around 23. We used the McVicar et al (28) mean wind data set in the fire danger modelling. PRODUCTIVITY AND DROUGHT: Productivity estimates were updated from previous analyses, using the process-based model CABALA. Six standard soil types were set up (low, medium and high fertility for each of shallow and deep soil depth) to provide broad representation of soils in each plantation region. The silvicultural regime was a 1 year rotation planted at 1 stems/ha, an initial fertiliser application of 5 kg/ah urea, and no further silviculture except an at-planting fertiliser application. Twenty separate rotations were simulated by running the model with 2 different planting dates over a 3 year block of weather. For each region simulations included the factorial combination of 6 soils, 4 climate models, 3 timeframes and 2 planting dates. The number of surviving rotations out of 2 was calculated to estimate probability of mortality occurring, and the mean stems/ha at the end of surviving rotations was calculated. For all combinations, the model was run assuming either no acclimation or full acclimation of photosynthesis to higher atmospheric CO 2 concentration, reflecting the high uncertainty around how plantations will respond to higher CO 2. FIRE: Fuel loads were calculated as the litter load estimated using CABALA. Weeds or debris on-site were not included. The Forest Fire Danger Meter model (McArthur 1967) was used to calculate daily forest fire danger index, which was used to characterise fire danger. Fire damage days were calculated as the number of days with plantation fire intensity above 4 kw/m. PESTS: Tables of key plantation pests were produced and potential responses to climate were summarised using literature review. The niche model CLIMEX was used to examine potential changes in the distribution of 5 eucalypt pests. The process-based model CABALA was used at selected high and low productivity sites in each region to identify stand responses to defoliation, using the methods described above. ADAPTATION: CABALA was used to examine how initial spacing or fertilising might be used to manage drought. Effects on final stand density, probability of stand mortality, stand volume and wood properties were estimated, for a subset of indicative sites per region. For fire and pests risk management, adaptation strategies are suggested based on literature and expert advice. Further information Dr Libby Pinkard CSIRO Land and Water Private Bag 12, Hobart, 71 Australia Libby.Pinkard@csiro.au Jody Bruce CSIRO Land and Water Private Bag 12, Hobart, 71 Australia Jody.Bruce@csiro.au References Whetton, P., Hennessy, K., Clarke, J., McInnes, K., Kent, D.S., 212. Use of Representative Climate Futures in impact and adaptation assessment. Climatic Change 115, McVicar, T.R., Van Niel, T.G., Li, L.T., Roderick, M.L., Rayner, D.P., Ricciardulli, L., Donohue, R.J., 28. Wind speed climatology and trends for Australia, : Capturing the stilling phenomenon and comparison with nearsurface reanalysis output. Geophysical Research Letters 35.
11 Other project outputs FINAL PROJECT REPORT Pinkard E, Bruce J, Battaglia M, Matthews S, Drew D, Downes, G (214). Adaptation strategies to manage risk in Australia s temperate plantations. Final report to FWPA prepared by CSIRO, and available at: Regional report 1: South west Western Australia eucalypt plantations Regional report 2: South west Western Australia radiata pine plantations Regional report 3: Green Triangle eucalypt plantations Regional report 4: Green Triangle radiata pine plantations Regional report 5: Eastern Victoria/southern NSW eucalypt plantations Regional report 6: Eastern Victoria/southern NSW radiata pine plantations Regional report 7: Northern NSW radiata pine plantations Regional report 8: Tasmania eucalypt plantations Regional report 9: Tasmania radiata pine plantations Spatial database: all data generated in the project is available via a spatial database ( Updated CABALA model, contact: Jody Bruce CSIRO Land and Water Private Bag 12, Hobart, 71, Australia Jody.Bruce@csiro.au Citation Pinkard E, Bruce J, Battaglia M, Matthews S, Drew D, Downes, G (214). Climate change and Australia s Plantations. Regional report 6. Victoria and southern New South Wales eucalypt plantations. CSIRO Copyright and disclaimer 215 CSIRO To the extent permitted by law, all rights are reserved and no part of this publication covered by copyright may be reproduced or copied in any form or by any means except with the written permission of CSIRO. Important disclaimer CSIRO advises that the information contained in this publication comprises general statements based on scientific research. The reader is advised and needs to be aware that such information may be incomplete or unable to be used in any specific situation. No reliance or actions must therefore be made on that information without seeking prior expert professional, scientific and technical advice. To the extent permitted by law, CSIRO (including its employees and consultants) excludes all liability to any person for any consequences, including but not limited to all losses, damages, costs, expenses and any other compensation, arising directly or indirectly from using this publication (in part or in whole) and any information or material contained in it.