Rogue Basin Ecological Integrity Assessment and Climate Change Management Interactions
|
|
|
- Patrick Hutchinson
- 5 years ago
- Views:
Transcription


1 Rogue Basin Ecological Integrity Assessment and Climate Change Management Interactions Jimmy Kagan OSU PSU UO

2 Ecological Integrity Measures (by area) Land management status Landscape features Habitat characteristics Representative species At-risk species Nature s benefits Size Fragmentation Landscape, stream connectivity and permeability Landscape context Type and Non-native species Unique native importance species Clearcuts and overstory Condition and burns Vertebrates vulnerability species status (riparian or forest Roads and buildings structure, water Vascular plant chemistry, cover) Farmed or plowed species status Biotic composition areas (native, invasive, noxious) Key processes (fire, hydrology, flood, nutrients) Large concentrations (migrations, flyway stopovers) Keystone species Relative rarity Population size and vulnerability Support systems (pollinators, prey, etc.) Type and intensity of threats Community engagement Nature recreation ecotourism Sufficient clean water Harvested resources (e.g. game, timber, mushrooms) Pollination Source: Collaboration involving Oregon Biodiversity Information Center, NatureServe, Defenders of Wildlife, U.S. Geological Survey, and New Nature of Business.
3 Human Modification Nationwide

4 Landscape Permeability Nationwide

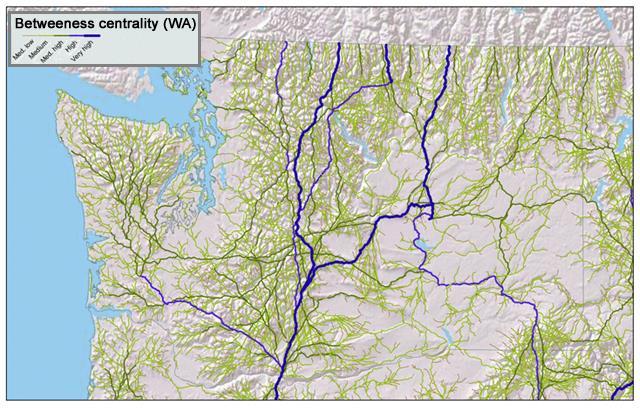
5 Flow Routes/ Connectivity in Washington and Western Montana

6 Landscape Context: Connectivity, surrounding land use, patch size, and stressors

7 Conservation Opportunities & Intact Landscapes


8 Wetlands Landscape Integrity at Finer Scales
9 Ecological Integrity Measures (by area) Land management status Landscape features Habitat characteristics Representative species At-risk species Nature s benefits Size Fragmentation Landscape, stream connectivity and permeability Landscape context Type and importance Condition and vulnerability (riparian or forest structure, water chemistry, cover) Biotic composition (native, invasive, noxious) Key processes (fire, hydrology, flood, nutrients) Unique native species Vertebrates species Forest status structure Vascular plant species status Large concentrations (migrations, flyway stopovers) Keystone species Relative rarity Population size and vulnerability Support systems (pollinators, prey, etc.) Type and intensity of threats Community engagement Size of trees Nature recreation ecotourism Snags Sufficient clean Down wood water Tree cover Harvested resources (e.g. game, timber, mushrooms) Pollination Source: Collaboration involving Oregon Biodiversity Information Center, NatureServe, Defenders of Wildlife, U.S. Geological Survey, and New Nature of Business.

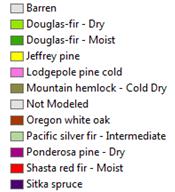
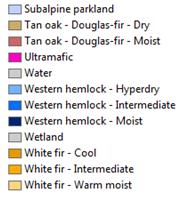
10 Potential Natural Vegetation

11 Forest Canopy Cover
12 Tree Diameter

13 Tree Diameters in the Major Rogue River Sub-basins
14 Ecological Integrity Measures (by area) Land management status Landscape features Habitat characteristics Representative species At-risk species Nature s benefits Size Fragmentation Landscape, stream connectivity and permeability Landscape context Type and importance Condition and vulnerability (riparian or forest structure, water chemistry, cover) Biotic composition (native, invasive, noxious) Key processes (fire, hydrology, flood, nutrients) Unique native species Vertebrates species status Vascular plant species status Large concentrations (migrations, flyway stopovers) Fire Keystone species Relative rarity Population size and vulnerability Support systems (pollinators, prey, etc.) Type and intensity of threats Community engagement Nature recreation ecotourism Sufficient clean % Stand replacement water fires Harvested resources (e.g. Vegetation departure game, timber, mushrooms) Fire regime group Pollination Source: Collaboration involving Oregon Biodiversity Information Center, NatureServe, Defenders of Wildlife, U.S. Geological Survey, and New Nature of Business.

15 Percent Stand Replacement Fires (Land Fire )

16 Vegetation Departure (Land Fire )
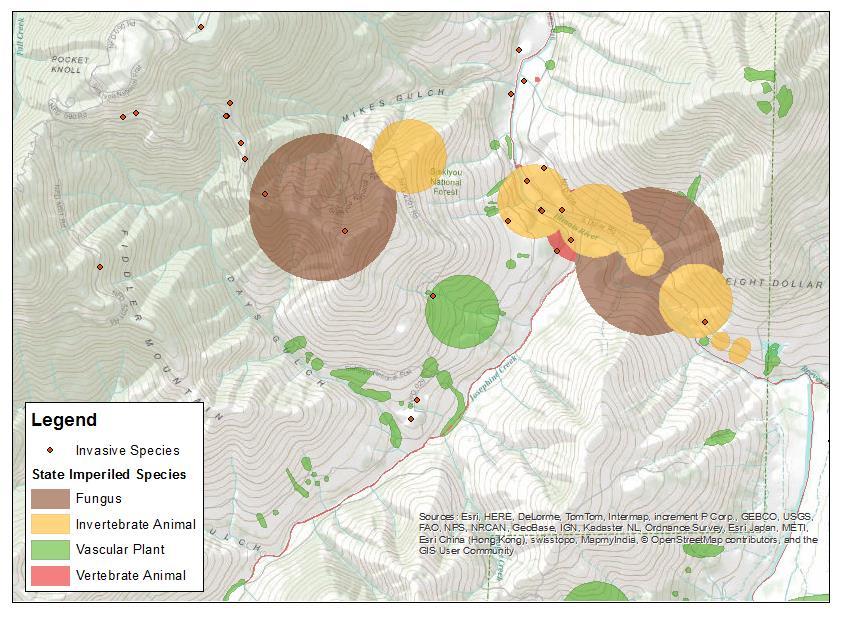
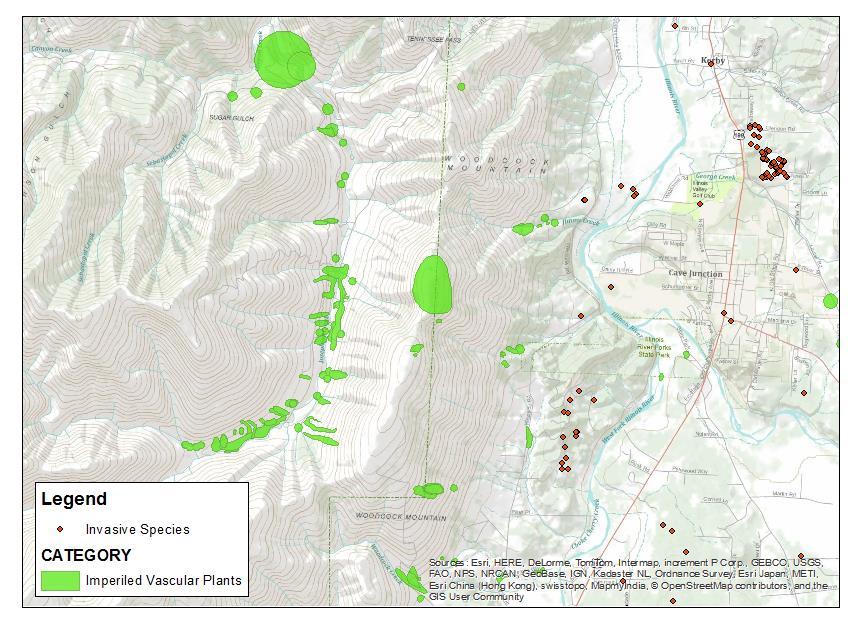
17 Ecological Integrity Measures (by area) Land management status Landscape features Habitat characteristics Representative species At-risk species Nature s benefits Size Fragmentation Landscape, stream connectivity and permeability Landscape context Type and importance Condition and vulnerability (riparian or forest structure, water chemistry, cover) Biotic composition (native, invasive, noxious) Key processes (fire, hydrology, flood, nutrients) Unique native species Vertebrates species status Vascular plant species status Large concentrations (migrations, flyway stopovers) Keystone species Relative Animal rarity distribution presence or absence Population size and vulnerability Amount of good habitat Support systems (pollinators, prey, etc.) Plant distribution Type presence and or absence intensity of threatsamount of good habitat Community engagement Nature recreation ecotourism Sufficient clean water Harvested resources (e.g. game, timber, mushrooms) Pollination Source: Collaboration involving Oregon Biodiversity Information Center, NatureServe, Defenders of Wildlife, U.S. Geological Survey, and New Nature of Business.


")

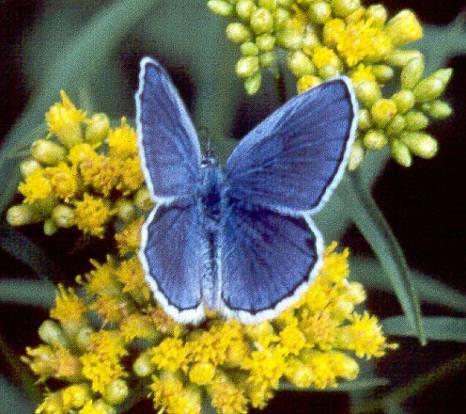


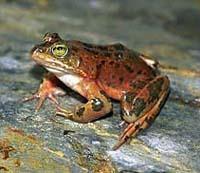
18 Presence or Absence Oregon Spotted Frog (Rana pretiosa)


19 Predicted Habitat within Occupied Watersheds


20 Predicted Habitat within Occupied Watersheds


21 Predicted Habitat within Occupied Watersheds
22 Ecological Integrity Measures (by area) Land management status Landscape features Habitat characteristics Representative species At-risk species Nature s benefits Size Fragmentation Landscape, stream connectivity and permeability Landscape context Type and importance Condition and vulnerability (riparian or forest structure, water chemistry, cover) Biotic composition (native, invasive, noxious) Key processes (fire, hydrology, flood, nutrients) Unique native species Vertebrates species status Vascular plant species status Large concentrations (migrations, flyway stopovers) Keystone species Relative rarity Population size and vulnerability Support systems (pollinators, prey, etc.) Type and intensity of threats Population size Community engagement Annual variance in Nature population recreation size ecotourism Adjacent threats Sufficient clean Threat immanence water Harvested Habitat quality resources (e.g. game, timber, mushrooms) Pollination Source: Collaboration involving Oregon Biodiversity Information Center, NatureServe, Defenders of Wildlife, U.S. Geological Survey, and New Nature of Business.
23
24

25 How Do We Use this Information? Inform state-and-transition models used to evaluating alternatives in various plans. Develop information needed to evaluate impacts of climate change. Help identify conservation priorities


26 Southwest Oregon & Rogue Basin BLM USFS Other (Park/FWS) Private State Tribal
27 Use Data to Run Models and Hook to Design management scenario Interpretations Fuels Wildlife habitat Treatment finances Ecosystem Services Economic potential Terrestrial habitat State and Transition Models Watershed Interpretations Aquatic habitat Wildfire-fuel hazards

28 Lower Joseph Management Areas Timber Production HCNRA Forage Emphasis HCNRA Dispersed Recreation/Timber Research Natural Area Research Natural Area/Wild & Scenic River Old Growth Preserve Wildlife/Timber Winter Range Wild and Scenic Rivers HCNRA Dispersed Recreation/Native Vegetatio


29 Lower Joseph Forest Structure No Management, After 30 Years Grass/forb/shrub Large tree closed forest Large tree open forest Medium tree closed forest Medium tree open forest Not forested Pole tree closed forest Pole tree open forest Recent disturbance Small tree closed forest Small tree open forest Young, closed forest Young, open forest

30 Integrating Climate Change & Land Management Models Climate Information MC2 Dynamic Global Vegetation Model Climate-informed State-and-Transition Models Oak woodlands Early Mid Chaparral Late Conifer Ponderosa Pine Douglas-fir Early Mid Early Late Mid Late Oldgrowth Oldgrowth
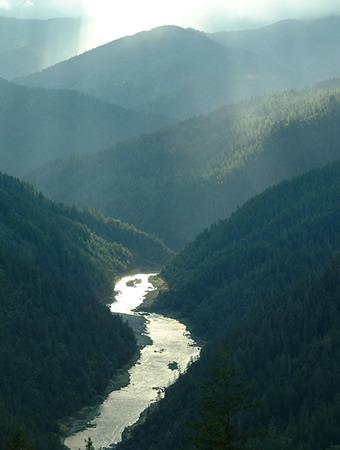
 impacts rivers and streams We need to learn how to measure these impacts, and the corresponding changes in water quantity, quality, and aquatic")
31 Linking Upland and Stream Outputs Ecological integrity measures, and the models are separate for aquatic & terrestrial habitats Upland land management changes (forestry, development, restoration) impacts rivers and streams We need to learn how to measure these impacts, and the corresponding changes in water quantity, quality, and aquatic habitat.

32 Questions? Comments?