Measuring Ecological Integrity Across Jurisdictions and Scale
|
|
|
- Bernadette Lyons
- 5 years ago
- Views:
Transcription


1 Measuring Ecological Integrity Across Jurisdictions and Scale Jimmy Kagan OSU PSU UO


2 PCAST highlighted the need to coordinate cross-scale and cross agency collaboration in monitoring for biodiversity.

3 Forest planning rule To aid managers in describing ecosystems when conducting Forest Land Management Plan revisions and to provide a basis for monitoring ecosystem integrity and the diversity of plant and animal communities.


4 The challenge: What is the simplest combination of measures that reveal the current condition of biodiversity and can demonstrate positive or negative change over time? Defenders of Wildlife
5 Characteristics / design criteria Uses, enhances existing data Multiple spatial, temporal scales Repeatable, updatable, feasible, transparent Incorporates data from variety of sources Defenders of Wildlife

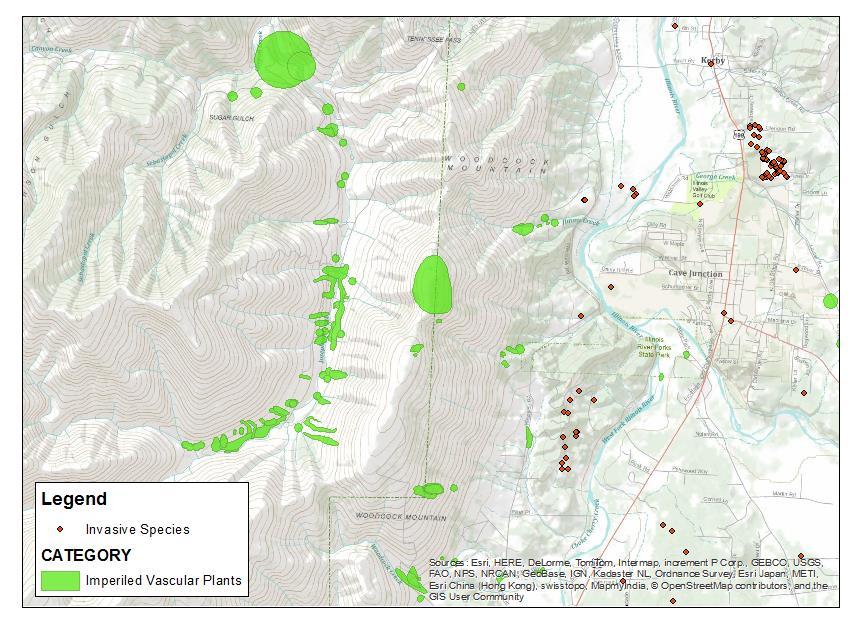
6 Ecological Integrity Measures (by area) Land management status Landscape features Habitat characteristics Representative species At-risk species Nature s benefits Size Fragmentation Landscape, stream connectivity and permeability Landscape context Type and Non-native species Unique native importance species Fires and clearcuts Condition and Vertebrates vulnerability Human development species status (riparian or forest structure, water chemistry, cover) Biotic composition (native, invasive, noxious) Key processes (fire, hydrology, flood, nutrients) Vascular plant species status Large concentrations (migrations, flyway stopovers) Keystone species Relative rarity Population size and vulnerability Support systems (pollinators, prey, etc.) Type and intensity of threats Community engagement Nature recreation ecotourism Sufficient clean water Harvested resources (e.g. game, timber, mushrooms) Pollination Source: Collaboration involving Oregon Biodiversity Information Center, NatureServe, Defenders of Wildlife, U.S. Geological Survey, and New Nature of Business.

7 Human Modification Nationwide Theobald Landscape Ecology.

8 Landscape Permeability Nationwide Theobald et al Conservation Letters.
9 Landscape Context: Connectivity, surrounding land use, patch size, and stressors Comer, P. J. & J. Hak Landscape Condition in the Conterminous United States. Spatial Model Summary. NatureServe, Boulder, CO.


10 Wetlands Landscape Integrity at Finer Scales
11 Ecological Integrity Measures (by area) Land management status Landscape features Habitat characteristics Representative species At-risk species Nature s benefits Size Fragmentation Landscape, stream connectivity and permeability Landscape context Type and importance Condition and vulnerability (riparian or forest structure, water chemistry, cover) Biotic composition (native, invasive, noxious) Key processes (fire, hydrology, flood, nutrients) Unique native species Vertebrates species Forest status structure Vascular plant species status Large concentrations (migrations, flyway stopovers) Keystone species Relative rarity Population size and vulnerability Support systems (pollinators, prey, etc.) Type and intensity of threats Community engagement Size of trees Nature recreation ecotourism Snags Sufficient clean Down wood water Tree cover Harvested resources (e.g. game, timber, mushrooms) Pollination Source: Collaboration involving Oregon Biodiversity Information Center, NatureServe, Defenders of Wildlife, U.S. Geological Survey, and New Nature of Business.


12 Gradient Nearest Neighbor Structure Maps
13 Forest Canopy Cover

14 Tree Diameter
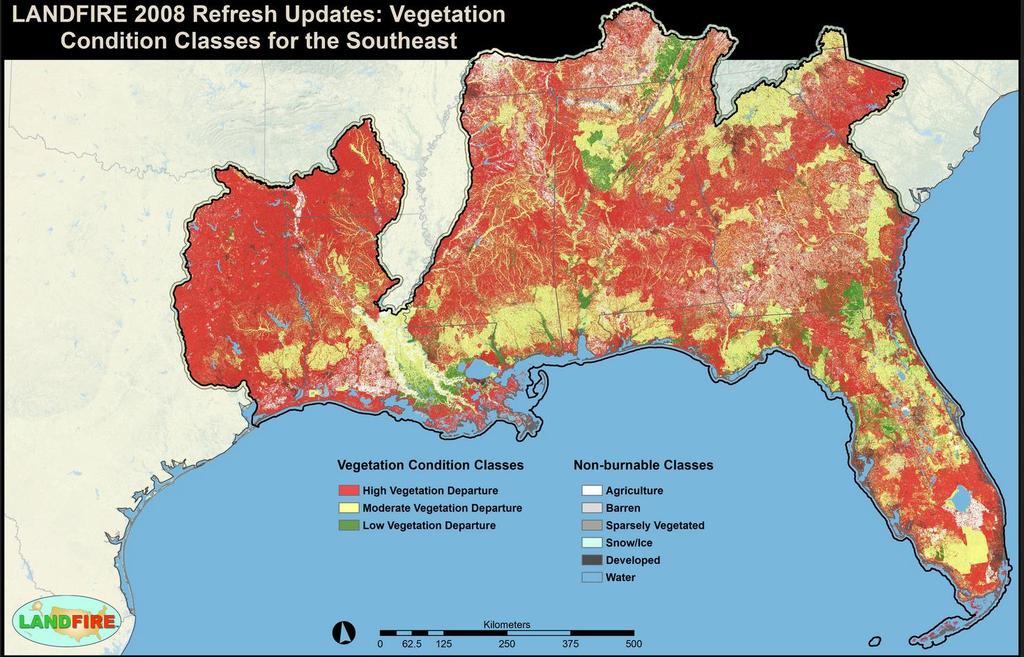
15 Ecological Integrity Measures (by area) Land management status Landscape features Habitat characteristics Representative species At-risk species Nature s benefits Size Fragmentation Landscape, stream connectivity and permeability Landscape context Type and importance Condition and vulnerability (riparian or forest structure, water chemistry, cover) Biotic composition (native, invasive, noxious) Key processes (fire, hydrology, flood, nutrients) Unique native species Vertebrates species status Vascular plant species status Large concentrations (migrations, flyway stopovers) Fire Keystone species Relative rarity Population size and vulnerability Support systems (pollinators, prey, etc.) Type and intensity of threats Community engagement Nature recreation ecotourism Sufficient clean % Stand replacement water fires Harvested resources (e.g. Fire Risk game, timber, mushrooms) Vegetation departure Pollination Source: Collaboration involving Oregon Biodiversity Information Center, NatureServe, Defenders of Wildlife, U.S. Geological Survey, and New Nature of Business.
16
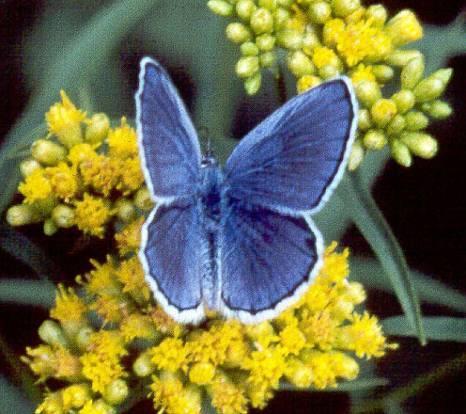
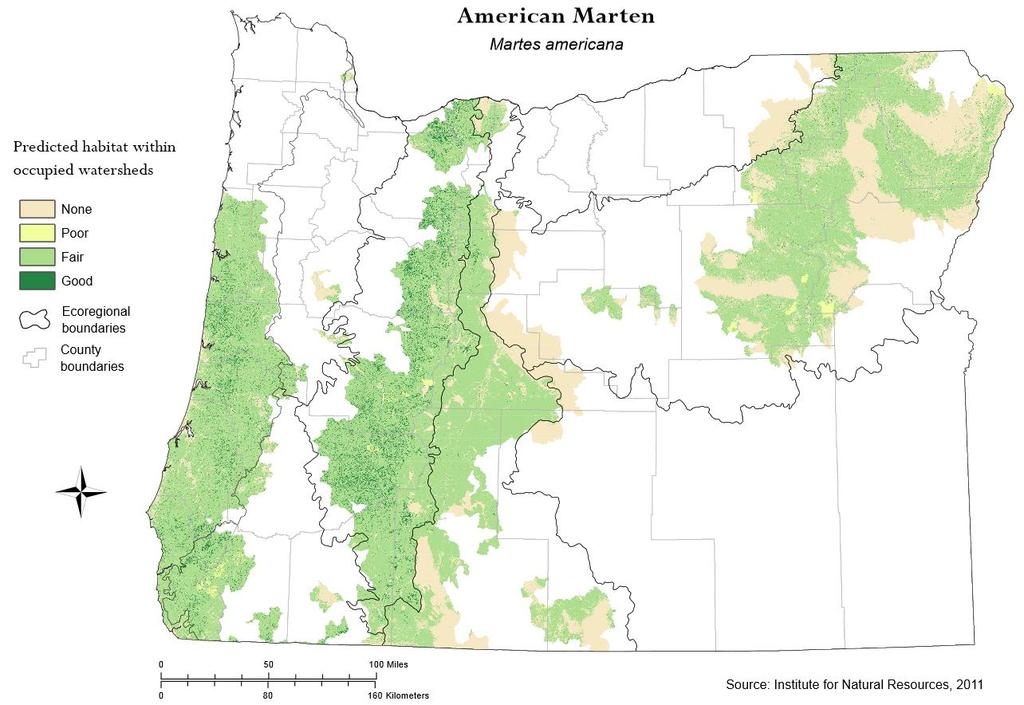
17 Ecological Integrity Measures (by area) Land management status Landscape features Habitat characteristics Representative species At-risk species Nature s benefits Size Fragmentation Landscape, stream connectivity and permeability Landscape context Type and importance Condition and vulnerability (riparian or forest structure, water chemistry, cover) Biotic composition (native, invasive, noxious) Key processes (fire, hydrology, flood, nutrients) Unique native species Vertebrates species status Vascular plant species status Large concentrations (migrations, flyway stopovers) Keystone species Relative Animal rarity distribution presence or absence Population size and vulnerability Amount of good habitat Support systems (pollinators, prey, etc.) Plant distribution Type presence and or absence intensity of threatsamount of good habitat Community engagement Nature recreation ecotourism Sufficient clean water Harvested resources (e.g. game, timber, mushrooms) Pollination Source: Collaboration involving Oregon Biodiversity Information Center, NatureServe, Defenders of Wildlife, U.S. Geological Survey, and New Nature of Business.


")
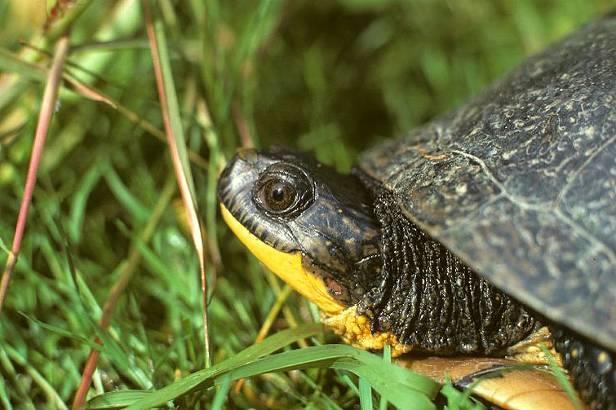

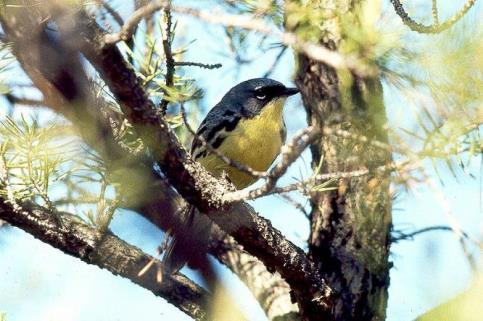
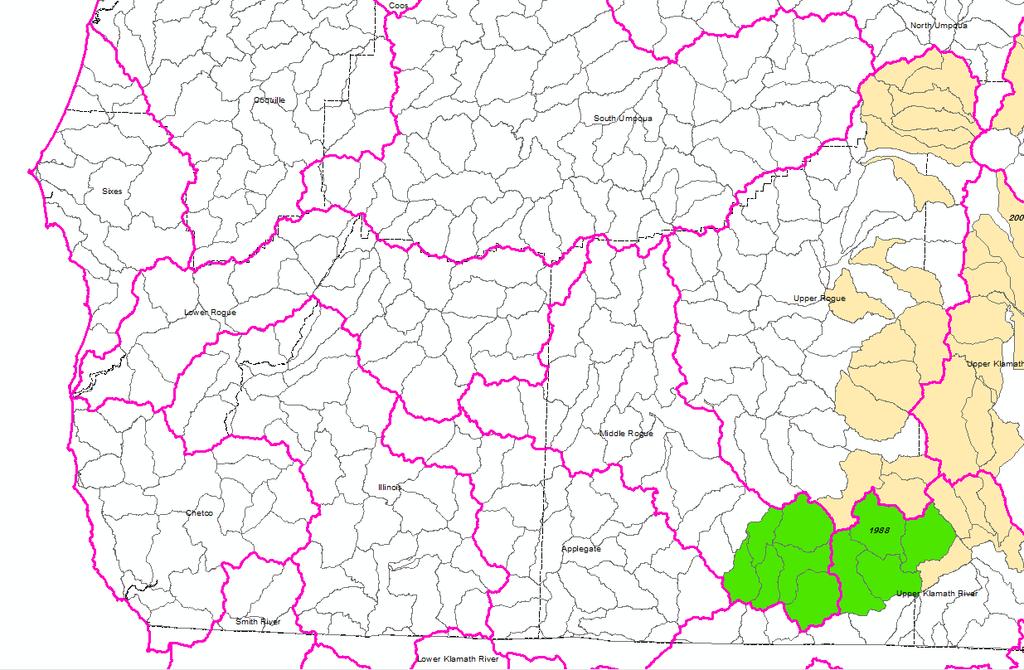

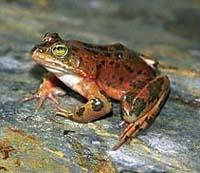
18 Presence or Absence Oregon Spotted Frog (Rana pretiosa)
19
20 Ecological Integrity Measures (by area) Land management status Landscape features Habitat characteristics Representative species At-risk species Nature s benefits Size Fragmentation Landscape, stream connectivity and permeability Landscape context Type and importance Condition and vulnerability (riparian or forest structure, water chemistry, cover) Biotic composition (native, invasive, noxious) Key processes (fire, hydrology, flood, nutrients) Unique native species Vertebrates species status Vascular plant species status Large concentrations (migrations, flyway stopovers) Keystone species Relative rarity Population size and vulnerability Support systems (pollinators, prey, etc.) Type and intensity of threats Population size Community engagement Annual variance in Nature population recreation size ecotourism Adjacent threats Sufficient clean Threat immanence water Harvested Habitat quality resources (e.g. game, timber, mushrooms) Pollination Source: Collaboration involving Oregon Biodiversity Information Center, NatureServe, Defenders of Wildlife, U.S. Geological Survey, and New Nature of Business.
21
22 Why Do We Need This? How Do We Use This Information? Inform state-and-transition models used to evaluate alternatives in various plans, Develop information needed to evaluate impacts of climate change, Help identify restoration priorities, To measure biodiversity related ecosystem services and to evaluate change over time.

23 How Does It Get Done? Assign agency staff to integration efforts Create a climate where success requires interaction Offer incentives for cross-jurisdictional management
24 Prioritize integration, enhancement of critical baseline data Human footprint (roads, power lines), Aquatic features (rivers, streams), Species (observational data, focal, invasive), Soils, Vegetation plots across agencies. Defenders of Wildlife

25 Allocate funding for data integration

26 Establish consistent protocols and standards for data collection, integration and analysis

27 Support citizen science programs Funding Tech support repository for data photo points Training

28 Questions? Comments? Jimmy Kagan, INR, or office, mobile