, Co Investigators Mr. Nathan Smith and Ms. Christina Brassey Graduate Assistants
|
|
|
- Peter Barnett
- 5 years ago
- Views:
Transcription
, G. Stovold (SCION, Rotorua), C. Balocchi (Bioforest S.A.), Co Investigators Mr. Nathan Smith and Ms. Christina Brassey Graduate Assistants")
1 Genetic Variation in Resistance to Pitch Canker and Western Gall Rust in Monterey Pine (Pinus radiata D. Don): Results from a Three Country Collaborative Field Trial A.C. Matheson (CSIRO Plant Industry), W.R. Mark (Cal Poly State University), G. Stovold (SCION, Rotorua), C. Balocchi (Bioforest S.A.), Co Investigators Mr. Nathan Smith and Ms. Christina Brassey Graduate Assistants
2 Outline Review IMPACT plantation field trials from Santa Cruz County, CA Report on the progress of plantation Discuss the work in progress on pitch canker and western gall rust Discuss work still to be completed Questions, Advice, and discussion
3 1998 Australia, Chile and New Zealand agreed to work together in a program designed to test their elite breeding lines and to test for the genetics of Project Background 1946 Pitch Canker discovered in SE USA Caused by the necrotrophic, ascomycete Fusarium circinatum (teleomorph = Gibberella circinata Nirenberg & OʹDonnell) Reproduces sexually in the SE US, but only asexually in California 1986 Pitch Canker discovered in Monterey Pine in California in the Santa Cruz and San Francisco area on planted trees 1992 Pitch Canker discovered in native stands at Año Nuevo and Monterey

4 Bole Canker in Field Trial
5 1998 Australia, Chile and New Zealand agreed to work together in a program designed to test their elite breeding lines and to test for the genetics of Project Background 1997 Pitch Canker in 22 counties in CA and Board of Forestry passes resolution for Zone of Infestation Monterey pine genetic diversity low among pine species Early estimates of resistance in Monterey pine were as low as 3 % Multiple visits to USA from New Zealand and Australian scientists to assess the risk to plantations Pitch Canker also in Spain, South Africa, Chile, Haiti, Mexico, Portugal, and Chile

6 Necrotic Bark Tissue
7 1998 Australia, Chile and New Zealand agreed to work together in a program designed to test their elite breeding lines and to test for the genetics of Project Background 1998 Australia, Chile and New Zealand agreed to work together in a program designed to test their elite breeding lines and to test for the genetics of resistance to Pine Pitch Canker 1998 IMPACT Conference held at Monterey to develop strategy for continued assessment of risk

8 Branch Canker from Field Trial
9 1998 Australia, Chile and New Zealand agreed to work together in a program designed to test their elite breeding lines and to test for the genetics of Project Background. Estimated land area used for Monterey pine plantations worldwide in Adapted from Balocchi, et al., Country Area (ha) Production (1000m 3 /yr) Chile Australia New Zealand Spain South Africa Other 100 NA Total
10 1998 Australia, Chile and New Zealand agreed to work together in a program designed to test their elite breeding lines and to test for the genetics of Project Background 1880 Western gall rust (WGR) noted in California on Monterey and ponderosa pines WGR autoecious rust Often forms large hip cankers on Monterey pine Occurs in wave years
11 1998 Australia, Chile and New Zealand agreed to work together in a program designed to test their elite breeding lines and to test for the genetics of Project Background Some pines display tolerance and resistance to WGR Monterey pine displays increased resistance with age maturation resistance No point in selecting for resistance to pitch canker and having high susceptibility to WGR

12 WGR on Field Trial Tree
13 Experimental Design Two Phase Project Phase One Greenhouse inoculation Source Pollination Number Chile Open pollination 160 New Zealand Open pollination 137 Australia Controlled Pollination 144 Australia OP AnoNuevo 18 Australia OP Monterey 16 Australia OP Guadalupe ISL 5 Australia OP Cambria 3 TOTAL 483

14 Experimental Design Two Phase Project Phase One Greenhouse inoculation
15 Experimental Design Two Phase Project Phase Two Field Trials Two Locations selected Año Nuevo and Cambria site which was never approved Plant best performers selected from greenhouse trials Año Nuevo Planted February 12, 2005
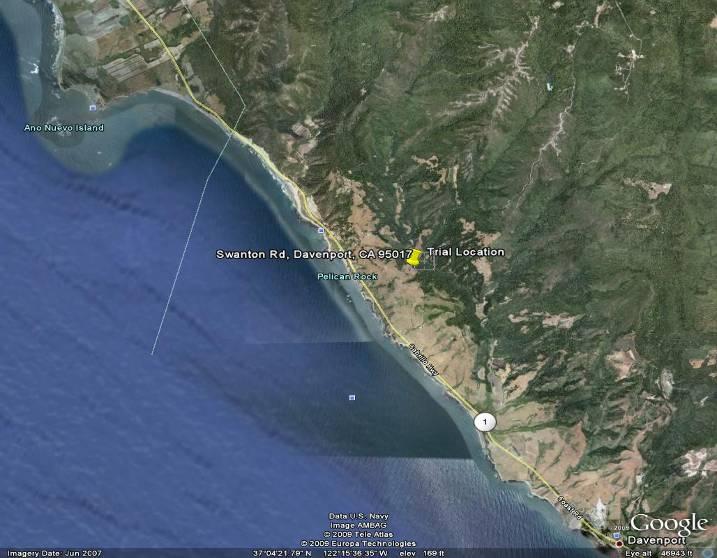
16 Plantation Location
17
18 Experimental Design Two Phase Project Phase Two Planting Stock Año Nuevo Source Pollination Number Chile Open pollination 85 New Zealand Open pollination 82 Australia Controlled Pollination 97 TOTAL 264


19 Experimental Design Seedlings grown at USFS Institute of Forest Genetics, Placerville, CA
20 Experimental Design Two Phase Project Phase Two Field Trials Native stand location row column design was utilized Five replicates with 4 tree line plots Design is resolvable as a randomized block design No buffers Tree spacing 2.4m X 3.0 m

21 Experimental Design Two Phase Project Phase Two Field Trials

22 Experimental Design Field Plot Layout

23 Experimental Design Field Location

24 Experimental Design Planting by Cal Poly Students, Feb 5, 2005

25 Seedling with Seedlot Label

26 Plantation after First Weed Treatment

27 Field after 12 months

28 Field after 15 months

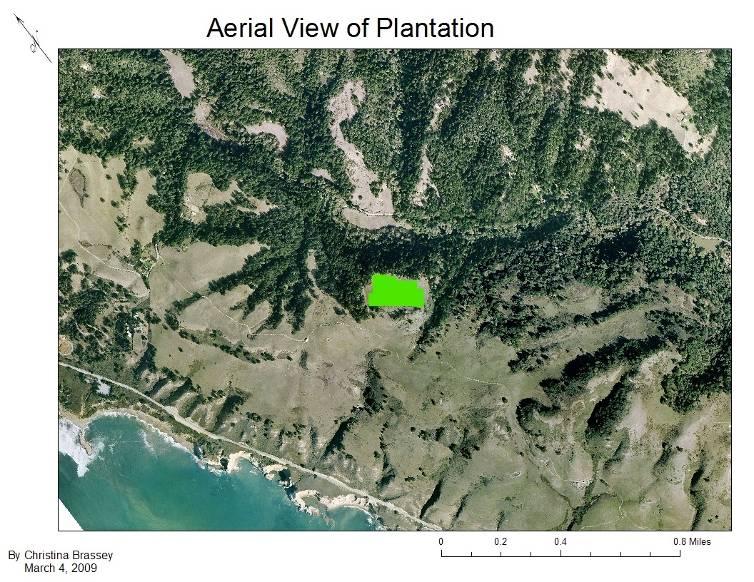
29 Plantation Aerial View

30 Issues with Plantation Unanticipated mortality causes
31 Issues with Plantation Wet areas caused high mortality Deer rub on saplings caused injury and loss Diplodia pinea outbreak

32 Wet Area Delineation 92% mortality in yellow area and 61 % in green area in Rep 2, overall mortality in Rep 2 62%, Rest of plantation 44.5%. Significant at the P = 0.05

33 Standing Water
34 Deer Damage Overall damage rate at 23.5% Logistic regression for rub status versus Replication, Stock and Height Significance at the P = rubs Replication and height rubs Replication and height rubs Height rubs Replication and height


35 Height Rub Summary Number of Trees Tree Height (dm)

36 Diplodia effects

37 Diplodia Effects
38 Diplodia Infection Rates 0.25 Mean number of symptoms per tree pitchy buds flagging Suborigin
39 Diplodia by Suborigin
40 Diplodia Spatial Analysis Mean number of symptoms per tree Replication pitchy buds flagging
41 Diplodia Spatial Analysis (GIS)
42 Diplodia Spatial Analysis (GIS)

43 Diplodia Spatial Analysis (GIS)
44 Nearest Neighbor Spatial Analysis Spatial Pattern Observed Mean Distance Expected Mean Distance Nearest Neighbor Ratio Z-score P-value 2007 Flagging Clustered Pitchy buds Random Combined Clustered Flagging Clustered < Pitchy buds Clustered Combined Clustered Flagging Clustered Pitchy buds Clustered Combined Random Chlorotic tips Clustered <0.0001
45 Greenhouse PC Inoculation Results Individual Tree Heritabilities (from Matheson et al. 2006) Population Heritability SE (heritability) Residual Variance Chile OP Año Nuevo Monterey Australian Crosses NZ OP
46 Greenhouse PC Significant Findings Australian and NZ families have shorter lesions than Chilean, Año Nuevo, and Monterey families No significant heritability differences were found among the populations, the large residual variances suggest variation between individuals in the families were comparable
47 Greenhouse Significant Findings Further analysis of Australian families using ASReml showed heritability of lesion length was low at 0.09 with a std error of 0.06 Analysis on separate male and female effects showed that the male parents were significantly different and the female parents were not
48 Greenhouse PC Significant Findings The Año Nuevo provenance had a significantly higher heritability estimate (0.78) for lesion length than other populations whose estimate are similar to one another (0.34 to 0.49) Since pitch canker is a new disease to California, this may indicate variation in some other trait linked to resistance
49 Field Trial Preliminary Findings Preliminary analysis used only the blocking structures (replicates, rows and columns) provided for in the original design and included the tree height as a covariate Replicates are treated as fixed effects, the rows and columns as random effects A binomial model with a logistic link function rather than models using normal distribution suggests the heritability is 15.21% ±9.44% (or ± )
50 Field Trial Preliminary PC Findings A fitted individual tree mixed model in ASReml was utilized to get the BLUP (Best Linear Unbiased Predicted) breeding values for the parents of the trees involved in the trial The correlation with the greenhouse results is 0.284, using the Chilean and New Zealand families only
51
52
53
54 Field Trial Preliminary PC Findings Potential explanations of poor correlation with greenhouse results Presence absence data versus measured values for lesions Inoculation versus natural infection from vectors or wounds Escape of susceptible individuals Difficulty in accurate assessment of large trees in field
55 Field Trial Preliminary WGR Findings The differences between families (seedlots) using a logarithmic transformation are highly statistically significant (P<0.001) A mixed model treating seedlots and replicates as fixed (rows and columns random) was used to obtain an estimate of the statistical significance of the differences between families
56 Field Trial Preliminary WGR Findings The fact that the differences between families is so strong suggests that the heritability will be high A proper genetic analysis is not done yet, so we cannot give you an estimate for the heritability
57
58
59
60 Additional Studies and Ongoing Analysis Spatial spread of Diplodia, PC and WGR in plantation, Preliminary data on Diplodia suggests a significant relationship to spatial patterns Completion of WGR data analysis Completion of PC data analysis Correlation of PC and WGR resistance Inoculation and wounding studies on adjacent plantation of identical planting stock

61 Plantation Removal by Cal Poly Students

62 Continued Effects of Unforeseen Mortality Factor
63 Funding and Support Cal Poly State University Natural Resources Management Dept Swanton Pacific Ranch Cal State University Agricultural Research Initiative Cal Fire CSIRO SCION BioForest SA USFS Institute of Forest Genetics
64 Thank You