Stillwater Sciences. Stillwater Sciences. Snohomish County Public Utility District No.1 PO Box 1107 M/A E1 Everett, WA 98206
|
|
|
- Jared O’Connor’
- 5 years ago
- Views:
Transcription


1 FINAL REPORT FEBRUARY 2015 Sultan River Riverine Habitat Monitoring PREPARED FOR Snohomish County Public Utility District No.1 PO Box 1107 M/A E1 Everett, WA PREPARED BY 108 NW Ninth Ave., Suite 202 Portland, OR 97209
2 Suggested citation: Sultan River riverine habitat monitoring. Prepared by Stillwater Sciences, Portland, Oregon for Snohomish County Public Utility District No.1., Portland, Oregon. Cover photos: Clockwise from top left: Installed large wood in Side Channel 1; Stillwater staff surveying the main channel of the Sultan River; bridge on Side Channel 4; upper end of Side Channel 4. i
3 Table of Contents EXECUTIVE SUMMARY STUDY OBJECTIVES AND DESCRIPTION BACKGROUND INFORMATION METHODS Study Area Description and River Reach Delineation Riverine Habitat Mapping and Large Woody Debris Survey Delineation of in-river habitat units In-river LWD inventory Characterization of river channel substrate Deviations from RSP 18/Monitoring Plan RESULTS Survey Results: Riverine Habitat and Large Woody Debris Habitat unit composition Results: large woody debris survey Characterization of river channel substrate DISCUSSION Riverine Habitat Characteristics Main channel Side channels Large Woody Debris Characteristics Sediment Characteristics REFERENCES ii
4 Tables Table 1. Reaches surveyed and the year the survey was conducted. LWD installations were constructed in 2012, between the last two surveys Table 2. Riverine habitat types Table 3. Large woody debris attributes Table 4. Discharge at time of each survey as measured by USGS gage , Sultan River below powerplant near Sultan, WA Table 5. Criteria used to identify primary and subtypes and associated field code acronyms.. 7 Table 6. List of pool-forming factors and associated field codes... 8 Table 7. Composition of surveyed riverine habitat units by river reach and side channels of the lowermost 2.7 miles of the Sultan River Table 8. Percent total surface area by riverine habitat unit, by river reach and side channels in the Study Area Table 9. Average wetted width by surveyed riverine habitat unit within the Study Area Table 10. Average unit length by surveyed subtype within the Study Area. Italicized entries indicate measurement of a single unit Table 11. Primary pool-forming factors for habitat units surveyed in the Study Area Table 12. Average combined lengths of left and right bar edges for each reach per subtype Table 13. LWD density per mile in the Study Area Table 14. Tally of structure type per habitat unit Table 15. Approximate size distribution of river substrate material from sample sites throughout the Study Area Table 16. Side channel length comparisons from 2010 and 2014 data Table 17. Figures Figure 1. Comparison of approximate size distribution of river substrate in the Study Reach for 2007 and Overview map of Study Area, spanning the lowermost 2.7 miles of the Sultan River upstream of its confluence with the Skykomish River... 3 Figure 2. Photo of SC-1 in Figure 3. Photo of SC-1 in Figure Combined average percent surface area per subtype Figure 5. Box-and-whisker plots of surveyed residual pool depth by survey reach Figure 6. Average length of bar edge per subtype by reach in the lowermost 2.7 miles of the Sultan River, including side channels Figure percent surface area per subtype for the lower 2.7 miles of the Sultan River Figure 8. Comparison of SC-1 composition by surface area in 2010 and Figure 9. Comparison of SC-2 composition by surface area in 2010 and Figure 10. Glide with helicopter placed logs Figure 11 Pool unit Figure 12. SC-3 composition by surface area in 2007 and Appendices Appendix A. Field Data Sheets Appendix B. Maps Illustrating 2014 Habitat Units Appendix C. Maps Illustrating Large Woody Debris Appendix D. Maps Illustrating 2010 Habitat Units iii
5 EXECUTIVE SUMMARY conducted a field habitat survey of the lower 2.7 miles of the Sultan River in March 2014, including four side channels (of which three had been previously surveyed). The study was undertaken to determine if any habitat changes have occurred since the initial baseline survey in 2007 that included the mainstem river and Side Channel 3 (SC-3), and the subsequent 2010 survey of Side Channels 1 (SC-1) and 2 (SC-2). The surveys were conducted as part of the relicensing of the Henry M. Jackson Hydroelectric Project. Table 1 lists each reach and the year it was surveyed. Riverine habitat attributes recorded for this study include in-stream unit subtype (e.g., pools, riffles, glides, islands), measurements of wetted unit surface area dimensions (length and width), unit margin features (lengths of undercut banks and bar edges), and the distribution and characterization of large woody debris (LWD). Subsequent to the 2007 and 2010 surveys, engineered LWD jams have been installed along the margins of the mainstem, the side channels have been enhanced with engineered LWD, and other channel enhancements were made in all four side channels. Table 1. Reaches surveyed and the year the survey was conducted. LWD installations were constructed in 2012, between the last two surveys. Reach Surveyed in 2007 Surveyed in Surveyed in 2014 Mainstem Yes No Yes Side Channel 1 No Yes (partially) Yes Side Channel 2 No Yes Yes Side Channel 3 Yes No Yes Side Channel 4 No No Yes LWD installations The results of the study indicate that natural processes of wood recruitment and channel evolution have thus far resulted in only modest limited changes to habitat attributes in the mainstem of the Sultan River since the initial surveys were conducted in 2007 and The side channels are primarily glide habitat, with smaller amounts of low-gradient riffles and a few pools. The presence of engineered log jams and LWD in the mainstem river and along the side channels represent, by far, the greatest improvement in habitat along the lower Sultan River since 2007 and They have successfully stabilized the inlet to side channels, such that all had flowing water at the 320 cfs mainstem discharge during which the 2014 survey was made. Although the installations have not initiated widespread changes in habitat features to date beyond their simple presence and the local cover that they provide, their persistence and continued interaction with future high flows may result in greater habitat complexity in the future. 1 STUDY OBJECTIVES AND DESCRIPTION The objective of this habitat survey was to delineate in-river habitat units and to conduct an inriver large woody debris inventory in the Sultan River s lower 2.7 miles, including four previously identified side channels (Figure 1). The mainstem and SC-3 were surveyed as part of project relicensing in 2007 and this effort was reported in Revised Study Plan 18: Riverine, Riparian, and Wetland Habitat Assessment (hereafter referenced as RSP 18 ). In 2010, habitat was surveyed in SC-1 and SC-2 and a geomorphic assessment was conducted to inform wood 1
6 placement and channel enhancement feasibility. Construction occurred in 2012, with inlet and outlet enhancement and boulder placement associated with the four side channels SC-1, SC-2, SC-3, and SC-4. Enhancements included multiple log structures and individual logs in the side channels and seven large engineered log jams in the mainstem. The 2014 survey was a follow-up habitat survey required by the Comprehensive Settlement Agreement for the continued operation of the Jackson Hydroelectric Project, operated by the Snohomish Public Utility District (the District) in accordance with FERC licensing requirements. Habitat re-surveys are triggered by high process flow events, of which one occurred in March 2014 (with a peak discharge of 4,940 cfs at USGS mainstem gage , corresponding to a 3- to 4-yr flood). The primary purpose for resurveying is to identify any significant changes that have occurred since 2007 and 2010 that could affect fish habitat in the lower Sultan River. This study thus evaluates habitat changes that have occurred as a result of the constructed habitat enhancements and their interaction with a single high-flow event. This study also provides baseline information for comparison with future habitat surveys in the mainstem and side channels of this reach of the Sultan River. 2 BACKGROUND INFORMATION As part of the formal relicensing process for Culmback Dam in 2007, RSP 18 was completed to address Federal Energy Regulation Commission (FERC) requirements for a detailed description of aquatic and terrestrial resources of the Project-related environment between Culmback Dam and the mouth of the Sultan River. Study objectives were designed to provide the District with the information required to make management decisions pursuant to FERC guidelines as well as other federal, state, and local requirements. The Sultan River below Culmback Dam is a highly confined, steep channel over 13 of its 16-mile length to its confluence with the Skykomish River. The canyon that confines the river creates a high-energy environment that significantly affects the nature of instream habitats found within it. At approximately river mile (RM) 3.3, however, the river transforms into a less confined, alluvial valley where the channel widens and gravels from upstream sources deposit and accumulate. This survey was conducted on the lowermost low- gradient alluvial portion of the watershed (Figure 1) below the power line crossing at RM 2.7. The Sultan River below Culmback Dam currently provides spawning and rearing habitat for numerous species of resident and anadromous salmonids. The reach between the Culmback Dam and the Diversion Dam (RM 9.7) supports self-sustaining stocks of resident rainbow trout (O. mykiss), cutthroat trout (O. clarki), and mountain whitefish (Prosopium williamsoni). Anadromous species, including Chinook salmon (Oncorhynchus tshawytscha), coho salmon (O. kisutch), pink salmon (O. gorbuscha), chum salmon (O. keta), coastal cutthroat trout (O. clarki) and steelhead trout (O. mykiss), are utilizing spawning and rearing habitats within the river downstream of the Diversion Dam, which at present is a barrier to upstream passage. Bull trout (Salvelinus confluentus) have not been observed spawning in the Sultan River but are known to use the lower river as rearing/foraging habitat during odd years when pink salmon eggs are prevalent. Each of these fish species depend on aquatic habitats that are affected by Project operations, and it is thus important to collect information on habitats within the affected reach on an ongoing basis. 2
.")
7 Figure 1. Overview map of Study Area, spanning the lowermost 2.7 miles of the Sultan River upstream of its confluence with the Skykomish River (bottom right portion of the image). The four side channels covered by this survey are highlighted. 3
8 3 METHODS 3.1 Study Area Description and River Reach Delineation RSP 18 broke the river into three operational reaches and four survey reaches, each of which contained multiple habitat units identified by Natural Sequence Order (NSO) or unit numbers. The present Study Area for the 2014 survey covers the lower mainstem Sultan River from the power lines at RM 2.7, including four side channels within the reach, to its confluence with the Skykomish River. The 2014 survey took place wholly within Operational and Survey Reach 1. Habitat unit numbers assigned to the mainstem and SC-3 in 2007 have not been altered except in the case where habitat has changed. Habitat boundaries assigned in 2010 for SC-1 and SC-2 were sufficiently different in 2014 that the habitat unit numbers for these side channels were redefined during the present survey. Maps illustrating 2010 habitat units are included in Appendix D. 3.2 Riverine Habitat Mapping and Large Woody Debris Survey Methods used to quantify in-river habitat units and associated LWD for the 2014 survey were identical to those utilized in 2007 and were selected to provide repeatable identification of habitat types, dimensions, and locations, as well as documentation of associated LWD. In 2010, only a qualitative LWD evaluation was conducted in the two side channels covered by that survey. General notes were made on significant LWD, but specific data such as size and decay class were not recorded. The classification schemes used to identify specific habitat unit types, substrate sizes, and LWD attributes are given in Tables 2 and 3. Table 2. Riverine (instream) habitat types. Habitat types Pool Riffle Cascade Rapid Glide Island Side Channel Undercut Banks Backwater Areas Bar Edges 4
9 Table 3. Large woody debris (LWD) attributes. LWD jam LWD piece Number of Pieces Dimension (length, width, height) Channel Position (bank, mid-channel, bar) Percent of Channel Width Largest Piece Size Length Diameter Decay Class Species Class (conifer, deciduous) Rootwad (yes, no) Anchoring (bed bank) Channel Position (bank, mid-channel, bar) Delineation of in-river habitat units The in-river habitat unit classification system and field methods from RSP 18 were used for this survey. The classification system and field methods were adapted from those commonly used in Washington State (Pleus et al. 1999; Schuett-Hames et al. 1999). They provide consistency for unit type identification and for recording unit dimensions. Habitat attributes recorded include unit type (e.g., pools, riffles), measurements of wetted unit surface area dimensions (length and width), unit margin features (lengths of undercut banks and bar edges), and LWD characteristics. Example habitat unit field data collection forms and respective criteria for identification are provided in Appendix A. The habitat and LWD assessments were conducted in July and August 2014 within the Study Area. The assessment involved a field survey (or census) by a two-person crew and was conducted moving upstream from the mouth of the Sultan River to RM 2.7. Flows during the survey (313 to 320 cfs) were maintained by dam releases to match the discharge experienced during the initial surveys in 2007 (319 cfs). Prior to enhancements, SC-1 and SC-2 were only activated at higher flows; therefore the 2010 survey of these two side channels was conducted at a higher discharge (Table 4). Table 4. Discharge at time of each survey as measured by USGS gage , Sultan River below powerplant near Sultan, WA. Year of survey Flow (cfs) to to 320 5
, and wetted widths and depths are obviously altered.")

10 Habitat unit delineation and measurement of habitat features is best conducted at similar flows in order to make direct comparisons. At different flows, bank edges can be inundated or revealed (changing the measurement of bar edges and undercut banks), and wetted widths and depths are obviously altered. The different discharges between 2010 and 2014 resulted in 0.45 ft stage difference in the Sultan River mainstem gage. Differences in depth in each of the side channels were recognized, but unquantified. As one example, Figures 2 and 3 show photographs taken in 2010 and 2014 within approximately 25 ft of each other of the same habitat unit (SC1-6 [SC1-15 in 2010]). From these and the remainder of the field photos, there was clearly more water present in 2010 than in 2014, rendering some of the direct comparisons of habitat changes between years less precise. Figure 2. Photo of SC-1 in Figure 3. Photo of SC-1 in The field crew surveyed each unit semi-sequentially to identify habitat unit boundaries and associated attributes. For the mainstem, data were collected in a hierarchical manner to first identify or confirm previous habitat unit boundaries, to verify or assign a habitat subtype, and to define the unit s position within the lateral channel. These first-order, reach-scale data were recorded using the same alphanumeric coding system as in RSP 18 that assigned: (1) a unique numeric data identifier (Natural Sequence Order or NSO unit number); (2) a primary unit type (pool, riffle, or other); (3) a subtype (riffle, pool, subsurface flow, obscured, or other [Pleus et al. 1999]); and (4) a ranking that defined the degree to which the unit occupied the wetted channel. The latter included primary main channel units (Category 1), secondary main channel habitat units (i.e., units that did not span the entire river channel) (Category 2), and side channel habitat units separated from the main channel by an island (Category 3). Islands (Category 3) were identified according to Schuett-Hames et al. (1999), who defined the minimum length of an island unit being at least two times the bankfull channel width with the terrestrial area vegetated by perennial plants two meters or greater in height. Subsequent data, including unit subtype and dimension measurements, were recorded for each habitat unit. Length, average depth (except in pool habitat units), and three wetted width measurements were either verified from the previous study or recorded for each habitat unit that were either newly delineated (as in the side channels) or re-delineated where habitat units had changed since the last survey. Habitat unit subtypes were designated for the pool and riffle primary units according to the criteria given in Table 5. Additional information was recorded for pools, including maximum depth, residual pool depth, and the dominant factor forming the pool according to the criteria given in Table 6 (Pleus et al. 1999). 6
11 Table 5. Criteria used to identify primary and subtypes and associated field code acronyms. (Subtype designations and definitions are adapted from Flosi et al and Edelen 2005.) Primary habitat unit type Riffle (R) Pool (P) Other (OT) * Habitat sub-type Low Gradient Riffle (LGR) High Gradient Riffle (HGR)* Rapid (RPD) Glide (GLD) Cascade (CAS) Main Channel Pool (MCP) Lateral Scour Pool (SCP) Island (ISL) Subsurface flow (SUB) This habitat sub-type was only used in the 2010 survey. Criteria definition Shallow reaches with swiftly flowing, turbulent water with some partially exposed substrate. Gradient <4% is usually cobble-dominated. Relatively higher gradient than low gradient riffles and dominant bed material is cobble instead of gravel. Steep sections of moderately deep, swift, and very turbulent water. Amount of exposed substrate is relatively high. Gradient is >4%, and substrate is boulder dominated. In Flosi et al. (1998), these are termed high gradient riffles. Wide uniform channel bottom. Flow with low to moderate velocities, lacking pronounced turbulence. Substrate usually consists of cobble, gravel, and sand. The steepest riffle habitat, consisting of alternating small waterfalls and small shallow pools. Substrate is usually bedrock and boulders. Large pools formed by mid-channel scour. Water velocity is slow, and the substrate is highly variable. Formed by flow impinging against a partial channel-bank obstruction. Bars or land segments within the stream channel that are relatively stable, usually vegetated, and normally surrounded by water. That portion (part or all) of the water that infiltrates the stream bed and moves horizontally through and below it. It may or may not return to the stream channel at some point downstream. 7
12 Table 6. List of pool-forming factors and associated field codes (Pleus et al. 1999). Definitions for individual large woody debris (LWD) pieces versus debris jams are according to Schuett- Hames et al. (1999). Field code Pool-forming factor 1 LWD log(s) 2 LWD rootwad(s) 3 LWD jam 4 Roots of standing tree(s) or stump(s) 5 Boulder(s) 6 Bedrock 7 Channel bedform 8 Resistant bank 9 Artificial bank 10 Beaver dam 11 Other/Unknown In-river LWD inventory Survey methods to characterize and enumerate LWD within the Study Area followed methods refined for the Timber Fish and Wildlife Monitoring Program (Schuett-Hames et al. 1999). Deviations from survey methods included consolidating LWD into size categories and characterizing LWD in debris jams by tallying individual pieces and rootwads, as was done in In 2010, only qualitative notes were taken on the existing LWD. Example field data collection forms and criteria are provided in Appendix A. For the field survey, LWD was defined as dead logs, limbs, or rootwads partially or entirely located within the bankfull channel. LWD was enumerated according to a minimum size and length criteria. Individual downed logs and rootwads tallied had a minimum length of two meters and a mid-point diameter of twenty centimeters or greater. Total length for each piece was recorded, and a diameter class was assigned. Diameter classes were defined as (1) 20 cm to <40 cm, (2) 40 cm to <60 cm, or (3) 60 cm. The location of LWD, either primarily (greater than 50 percent) within the wetted channel (zone 1) or within the bankfull channel width (zone 2), was also recorded based on the wetted channel conditions present. Additional LWD data attributes recorded were: anchor feature (root system, boulder, pinned, or unstable [Schuett-Hames et al. 1999]); species class (conifer, deciduous, or unknown); decay class (1-5, [Robison and Beschta 1990 cited in Schuett-Hames et al.1999]); and the presence or absence of an intact rootwad. In addition to individual pieces of LWD, debris jams were recorded on base maps and their dimensions estimated. The criteria for identifying debris jams was the accumulation of ten or more pieces of interlocked LWD (including rootwads) where at least ten pieces were 20 cm in diameter and >1.82 m (6 ft) in length, and the majority of the debris jam was located within the bankfull channel (Schuett-Hames et al. 1999). Attribute data recorded for debris jams included a 8
13 tally of all pieces and rootwads meeting the criteria described above, and approximate length, width, and height dimensions. Specific diameter and length measurements were recorded for the most prominent individual piece within each jam. All LWD locations were identified by recording the associated habitat unit NSO in addition to other data described above. The location and characteristics of engineered log jams, log structures, single placed logs, were noted separately from the naturally occurring LWD Characterization of river channel substrate Wolman pebble counts (Wolman, 1954) were conducted using the standard methodology in the same habitat unit as in 2007 (habitat unit 89) on the mainstem, and one count was conducted in each of the side channels not previously surveyed. No pebble counts were conducted in Pebble count results are typically summarized by the intermediate diameter of the median particle size, D 50 (Wolman 1954). D 50 values ranging from 20 to 60 mm, with less than 10% of particles smaller than 0.85 mm in diameter, are considered suitable substrate size for spawning anadromous fish (Kondolf and Wolman, 1993; Kondolf 2000). In addition to the value of D 50, we also report D 16 (the particle size that 16 percent of all particles are smaller than) and D 84 (the particle size that 84 percent of all particles are smaller than). 3.3 Deviations from RSP 18/Monitoring Plan There were no significant deviations from the RSP 18 measurement methods, although some enhancements were employed to facilitate current and future uses. These include a Google Earth.kmz file, with all habitat units delineated and field photographs from the 2010 and 2014 surveys embedded, neither of which were provided with the 2007 or 2010 data. In addition, GPS coordinates for the wetted width measurements of the side channels are provided with the GIS data to ensure repeatability with future efforts. 4 RESULTS 4.1 Survey Results: Riverine Habitat and Large Woody Debris Habitat unit composition A total of 111 in-river habitat units were surveyed within the Study Area. The spatial distribution of these habitats is best viewed using the maps and interactive.kmz file provided with this report. Maps illustrating 2014 habitat units are included in Appendix B. Low-gradient riffles, glides, and islands are the most abundant habitat unit subtypes, in order of prevalence; in total, they account for 88% of all habitat units surveyed. Table 7 provides summary statistics for habitat unit types by reach. In terms of combined average percent surface area per subtype, glides account for 55%, low gradient riffles for 25%, and islands for 16% (Figure 4, Table 8). 9
14 2014 Average Percent Surface Area Per Subtype GLD ISL LGR MCP RPD SCP Subsurface Figure Combined average percent surface area per subtype. Habitat subtypes are as listed in Table 5: glide (GLD), island (ISL), low gradient riffle (LGR), main channel pool (MCP), rapid (RPD), lateral scour pool (SCP), and subsurface. 10
15 Table 7. Composition of surveyed riverine habitat units by river reach and side channels of the lowermost 2.7 miles of the Sultan River. Primary unit type Pool Riffle Other Total habitat units * Habitat Sub-type Mainstem (unit cat 1*) Process reach ID and side channel Mainstem (unit cat 2 & 3)* SC-1 SC-2 SC-3 SC-4 Total number of habitat units Main channel pool Lateral scour pool Backwater pool 0 Low gradient rifle High gradient riffle Rapid 1 1 Glide Cascade 0 Island Subsurface Mainstem (unit category 1) includes primary main channel units. Mainstem (unit categories 2 and 3) includes secondary main channel habitat units (i.e., units that did not span the entire river channel) and side channel habitat units separated from the main channel by an island. 11
16 The average wetted widths for the primary unit type of pool in the mainstem ranged from 20.0 to 28.0 ft. The average wetted width for pools in the side channels ranged from 11.2 to 31.9 ft. For riffles and glides in the mainstem and the four side channels, the average wetted width ranged from 10.1 ft for low-gradient riffles in SC-1 to 92.0 ft for glides in the main channel (Table 9). Habitat unit lengths within the total Study Area range between 25 ft and 1,276 ft, with rapid and glide habitat units being the longest and backwater pools the shortest (Table 10). In SC-2, average unit lengths are generally smaller than the other reaches contributing to the side channel s complexity in terms of variability of habitat. Even at the low flows maintained for the surveys, the Sultan River is large, deep and fast, and crews were unable to wade across most of the units. Previous wetted width data for units surveyed in 2007 were visually compared to current conditions; no evidence of changes in the values (which would indicate active bank erosion or sediment accretion) or active erosional or depositional features themselves were noted. Glides were longest in the main channel and in SC-4 (a homogenous reach composed 90% of one continuous glide with a length of 1,276 ft), with an average overall length of 485 ft across all reaches. The sole rapid in the Study Area within the mainstem was (coincidentally) also 485 ft long. Islands had the next highest average unit length of 355 ft. 12
17 Table 8. Percent total surface area by riverine habitat unit, by river reach and side channels in the Study Area. Primary unit type Habitat Sub-type Mainstem (unit cat 1*) Mainstem (unit cat 2 & 3*) Process reach ID and side channel SC-1 SC-2 SC-3 SC-4 Combined average % surface area Pool Riffle Other * Main channel Lateral scour Backwater Low gradient High gradient Rapid Glide Rapid(was cascade) Subsurface Island Mainstem (unit category 1) includes primary main channel units. Mainstem (unit category 2 and 3) includes secondary main channel habitat units (units that did not span the entire river channel) and side channel habitat units separated from the main channel by an island. Table 9. Average wetted width (ft) by surveyed riverine habitat unit within the Study Area. Primary unit type Subtype Mainstem (unit cat 1) Mainstem (unit cat 2 & 3) SC-1 SC-2 SC-3 SC-4 Pool Main channel pool Lateral scour pool* Low gradient riffle Riffle High gradient riffle Glide * Width of lateral scour pools is an estimate of the pool within the wider channel. 13
18 Table 10. Average unit length (ft) by surveyed subtype within the Study Area. Italicized entries indicate measurement of a single unit (i.e., not an average value). Habitat Process reach ID and side channel Primary unit type Pool Riffle Other Total average unit length (ft) Subtype Mainstem (unit cat 1*) Mainstem (unit cat 2 & 3*) SC-1 SC-2 SC-3 SC-4 Total average unit length (ft) Main channel Lateral scour Backwater Low gradient High gradient Rapid Glide , Cascade Island Subsurface * Mainstem (unit category 1) includes primary main channel units. Mainstem (unit categories 2 and 3) includes secondary main channel habitat units (units that did not span the entire river channel) and side channel habitat units separated from the main channel by an island. 14
19 Additional pool habitat unit attributes Where possible, the apparent primary factor responsible for each pool s formation was recorded during field survey efforts, as specified in the study plan. Within the Study Area, 45% of the pools either formed or were constructed adjacent to engineered wood (Table 11). Two of the seven large engineered log jams had pools formed or created in front of them. For the remaining pools, channel bedform (18%), resistant bank (18%), and LWD (l8%) were primary factors in their formation. Table 11. Primary pool-forming factors for habitat units surveyed in the Study Area. Reach ID and side channel Pool-forming factor Mainstem (unit category 1*) Mainstem (unit category 2 & 3*) SC-1 SC-2 SC-3 SC-4 Total # of pools Roots of standing trees or stumps (Field code 4) Boulder(s) (Field code 5) Bedrock (Field code 6) Channel Bedform (Field code 7) Resistant Bank (Field code 8) Artificial Bank (Field code 9) LWD (logs) (Field Code 1) Engineered Log Jam Associated Total * Mainstem (unit cat 1) includes primary main channel units. Mainstem (unit cat 2, 3) includes secondary main channel habitat units (units that did not span the entire river channel) and side channel habitat units separated from the main channel by an island. 0 15
20 Residual pool depth measurements for a given stream provide the number and spatial distribution of deep pool habitats that can support aquatic life even through annual low-flow periods. Residual pool depth is the maximum wetted depth minus the wetted pool crest depth (Lisle 1987). Median residual pool depths were comparable between reaches, ranging from 1.4 ft (SC-1) to 3.9 ft (mainstem). Residual depths were most variable in SC-3 (Figure 5). In all cases, residual pool depth on average was 2.3 ft with the first quartile measuring about 1.8 ft. However, survey measurements likely underestimated actual residual pool depths. Low visibility made it difficult to locate maximum depth accurately, and one pool in SC-3 that did not exist in 2007 was too deep to safely measure. Figure 5. Box-and-whisker plots of surveyed residual pool depth by survey reach. The boundary of a box closest to zero indicates the 25th percentile, diamond within a box marks the median and the boundary of a box farthest from zero indicates the 75th percentile. Box whiskers indicate the minimum and maximum values Bar edge and undercut habitat attributes Bar edge habitat is used by emergent juvenile salmon during spring and early summer rearing periods because of their conditions of low velocity and shallow depth. Bar edge and undercut bank habitat were recorded as the percent of the unit length on either the right or left edges of each habitat unit. Results are presented as cumulative averages for both sides of the stream (i.e., left and right combined). Bar edge habitat is described as gravel bars along stream margins, either wetted or immediately adjacent to the wetted fringe. In this regard, it was primarily present in low-gradient riffle and glide habitats (Figure 6). 16
21 Mainstem (unit 1) Mainstem (units 2 & 3) SC-1 SC-2 SC-3 SC-4 Overall 10 0 MCP SCP LGR RPD GLD SUB Figure 6. Average length (expressed as a percent) of bar edge per subtype by reach in the lowermost 2.7 miles of the Sultan River, including side channels. Within the total surveyed Study Area, bar edge habitat constitutes approximately 44% of stream length. Bar edge habitat is more abundant in mainstem of the Sultan River (24%) (Table 12). Table 12. Average combined lengths of left and right bar edges for each reach per subtype (ft). Subtype Mainstem (unit cat1) Mainstem (unit cat 2 & 3) SC-1 SC-2 SC-3 SC-4 Overall Main Channel Pool (MCP) Lateral Scour Pool (SCP) Low Gradient Riffle (LGR) 2,965 1, ,171 Rapid (RPD) Glide (GLD) 4,995 1, ,021 8,337 Subsurface (SUB) % total average combined length per reach 41% 70% 22% 17% 58% 71% Undercut banks associated with habitat units provide refuge cover and habitat complexity for fish and other aquatic organisms. Throughout the total surveyed Study Area, only 11 habitat units had undercut banks. Undercut banks were present on the mainstem, SC-1, and SC-2 and are restricted to main channel pools, glides, and riffles. The majority of undercut bank habitat observed is present in the mainstem and SC-2. When comparing the average combined length (right and left 17
22 bank) of undercut habitat within each reach to the reach s total length, it accounts for approximately 12% of the total cumulative perimeter length in SC-2, 4.1% in SC-1, and 1.2% in the mainstem. Across all reaches, undercut bank features were essentially absent (1.8% of total stream length) and predominantly found alongside main channel pools (9% of total main channel pool stream length in the study area) Results: large woody debris survey A field census of abundance and key attributes of LWD was included with the riverine habitat survey of the Study Area LWD individual pieces The density of LWD can be presented using a variety of denominators. For this report, density of LWD is presented as pieces per mile of stream channel. Only naturally occurring LWD was tallied (see Section below for a discussion of engineered wood structures). In some locations it was unclear whether the wood occurred naturally or had been placed as part of stream enhancement. In such cases where the origin of the wood was ambiguous, it was included in the natural LWD tally. Maps indicating the distribution of LWD by habitat unit are included as Appendix C. Survey reach Table 13. LWD density per mile in the Study Area. Length (mi) LWD density per mile including only individual pieces LWD density per mile including individual pieces and debris jam pieces Mainstem SC SC SC SC Data collected for individual LWD pieces included categories of piece diameter, length estimates, species type, and decay class. For purposes of the survey, individual LWD pieces were tallied separate from pieces occurring within debris jams. Fifty six percent of all individual LWD pieces were downed trees of a small diameter class (20 to 40 cm), 34% were of medium diameter (>40 60 cm), and 10% were of large diameter (>60 cm). Eleven of the 216 tallied wood pieces were rootwads and are not included in the calculations in Table 13. The position of LWD within the bankfull channel was also recorded. Wood was classified on whether it was primarily (greater than 50%) in Zone 1 (wetted width) or 2 (bankfull width). LWD pieces in the wetted channel were also further differentiated if any part of the LWD extended to mid channel. The position of LWD within the channel is relevant to understanding how LWD contributes to habitat complexity by affecting channel hydraulics at different river discharges (Ralph et al 1994; Montgomery et al. 1995). Within the Study Area, 50 % of the individual LWD pieces were primarily in Zone 2. The remaining 50% of individual LWD pieces occur within the wetted river channel (Zone 1), with 33% of those extending into mid-channel. 18
23 Tree species type and decay class were identified for all individual LWD pieces. Throughout the total surveyed Study Area, LWD by species was composed of 80% unknown species (classified as such due to a lack of bark or otherwise identifying features), 11% coniferous species, and 9% deciduous species. Using a decay class scale of 1 to 5, where 1 indicates the lowest state of decay and 5 indicates the highest state of decay, the majority (75% ) of individual LWD pieces were within decay classes 1 to 3, indicating that they are of fairly recent (i.e., the last few decades) origin LWD jams Within the Study Area there were 2 natural debris jams within the wetted portion of the river channel at the time of the survey. This includes a jam in habitat unit 36 (unchanged from the 2007 survey) and a jam in habitat unit 93 at the mouth of SC-4. This jam had accumulated against an engineered log jam within the last two years LWD engineered wood Since the last survey, significant habitat enhancement has been conducted in the form of engineered log jams in the main stem, log structures in the side channels and helicopter placed LWD. The log jams were installed to stabilize the entrances of the side channels, and to direct flow into the side channels. Seven large engineered log jams, approximately 30 ft wide across the face, 12 to 15 ft high, and extending approximately 10 ft into the wetted channel have been installed. This compares to just two naturally occurring jams noted during this survey. The naturally occurring jams extend farther into the channel (much of the engineered jams are buried in the banks, but may become exposed over time), but the engineered log jams represent twice the number of jams in the study reach over Small pools have either former or were constructed at the base of two of these jams. Only the log jam at the mouth of SC-4 has accumulated any significant wood in addition to what was initially installed. According to plans provided by Snohomish County PUD, habitat enhancement included placement of 370 logs, most with rootwads attached. The logs were primarily inches in diameter, with some greater than 24 inches. The logs ranged from 20 to 50 ft long. The wood habitat enhancements include seven large engineered log jams, 30 to 35 ft wide across the face, 12 to 15 ft high and extending approximately 10 ft into the wetted channel. Small pools have either former or were constructed at the base of two of these jams (Habitat units 79a and 93a, refer to the habitat unit maps in Appendix B). In addition to the log jams, there is one log revetment along a residential lawn in habitat unit 80. While the number and location of log structures observed was not identical to what was depicted on the plans provided by the District, the volume and nature of LWD placement was consistent with the plans. The following is a description of engineered LWD structures and logs placed in the side channels since the previous habitat survey. Photographs were taken of many of these structures and can be viewed on the provided.kmz file. SC-1 Investigators classified LWD structures in SC-1 into four categories: Structures: Structures were three-log structures, two logs pinned into the bank, and one parallel to the bank, generally with an attached rootwad. 2-log pins: same as three-log structures, but with just one log pinned into the bank, and one log parallel to the bank. 19
24 Single Logs: Single logs pinned to the bank Mid-channel: Mid channel structures consisted of three logs buried in a bundle in the middle of the channel, two had cut-ends emerging from the substrate while the third had a root-wad emerging from the substrate. They extended out of the substrate six to eight ft. Table 14 includes the tally for the habitat units for these structure types. If any part of the structure was within the wetted channel at the time of the survey, it was considered to be in Zone 1. Structures that were completely above the water surface were in Zone 2. Table 14. Tally of structure type per habitat unit. Habitat unit SC1-1 SC1-2 SC1-3 SC1-11 Zone Structures 2-log Single logs Mid- Left Right Left Right Left Right Channel bank bank bank bank bank bank Unit SC1-6 (all habitat units are depicted on maps in Appendix B) had numerous helicopterplaced logs that were difficult to differentiate in some cases from natural LWD. Sixteen logs ranging in length from 10 to 35 ft were assumed to be helicopter-placed and were not included in the natural LWD tally. Unit SC1-14 has two very old and rotted cabled log structures. One consisted of three small logs 10 ft long, and the other consisted of one rootwad and one log eight ft long. SC-2 Unit SC2-4 contained one structure composed of 4 logs, three with rootwads, extending six to eight ft into the channel, and one channel spanning log. The logs extended from both the right and left banks. One apparently natural log was pinned against one of the rootwads. Unit SC2-13 contained a structure with two rootwads extending six to eight ft into the wetted channel, with a crossbar log with rootwad pinning them to the bank and extending along 35 ft of channel. A 40-ft channel-spanning log was present just upstream, along with a possibly natural (or helicopter placed) 50-ft log extending from the top of bank into the channel. Unit SC2-15 had six logs with rootwads pinned with boulders extending approximately 20 ft into the wetted channel. The second-most downstream log had a small beaverdam built against it. Aside from this, there was no natural wood accumulation on any of the engineered structures. SC-3 SC-3 had two large woody debris structures on the left bank from the border of unit 1-47 and 1-46 extending into unit Each consisted of 3 logs with rootwads extending approximately 6 ft 20
25 into the channel, and tied to the bank with one cross log with rootwad. Each extended along 35 ft of bank. SC-4 SC-4 has nine, possibly ten, engineered wood structures and single logs (with one additional single logs that may have been naturally occurring, or may have been placed), all in habitat unit SC4-1. No natural accumulation of large woody debris was noted against any of the structures. LWD structures 1 8 are located on the right bank, with 9 and 10 on the left bank. Descriptions of the structures follow. 1. Twelve logs buried in the bank, jutting into the channel, with two visible crossbeam logs perpendicular to the 2. Single log buried in the bank extending approximately three ft into the wetted channel 3. Two logs extending parallel along the channel, with a third log extending approximately six ft into the channel above the water surface. 4. One log structure along 35 ft of bank consisting of four logs (one with rootwad) and three rootwads. The logs extend 8 to 15 ft into the channel, and the rootwads are attached to logs buried in the bank, anchoring the other logs. 5. May be a natural or placed log anchored to the bank extending 22 ft into the channel 6. Structure made up of 3 logs; two with rootwads extending five and 11 ft into the channel, respectively. The third log is buried in the bank perpendicular to the channel, anchoring the first two logs. 7. Two logs extending out into the channel approximately five ft along 12 ft of bank. One log atop the other and perched above the water surface 8. One rootwad extending into the channel, tied to the channel with one crossbeam log with attached rootwad. Both run along approximately ten ft of shore, and extend out from the bank approximately five ft into the wetted channel. 9. Two logs buried into the bank, extending approximately 7.5 ft into the wetted channel. 10. One log extending approximately seven ft into the channel, anchored by a second log buried in the bank, with only its rootwad extending into the channel Characterization of river channel substrate Pebble count results are typically reported in D values, with the number following the D representing the percentage of particles smaller than that size, (for instance D 50 is the 50th percentile, or median substrate size) (Wolman 1954). Results from Wolman pebble counts are presented in Table
26 Table 15. Approximate size distribution (in mm) of river substrate material from sample sites throughout the Study Area. Reach Unit number Stream substrate particle size (mm) containing sample D 16 D 50 D 84 OR SC SC SC The pebble counts indicated that the gravel patches assessed were all suitable for spawning, although the median size in SC-2 was slightly higher than considered to be the ideal range (62 mm vs 60 mm). 5 DISCUSSION 5.1 Riverine Habitat Characteristics The primary objective of this 2014 study is to identify any significant changes that have occurred since 2007 in the lower 2.7 miles of the Sultan River and side channels that could affect fish habitat. When comparing the 2014 to 2007 and 2010 data, the following general observations were made: The percent of total surface area of each subtype in the Study Area was not significantly different than what existed in in Glides accounted for 66%, low gradient riffle for 29%, and islands for 6% (Figure 7) in In 2014, glides account for 55%, low gradient riffles for 25%, and islands for 16 %. Compared to 2007 and 2010, results in 2014 show an additional 4,834 ft of stream length was created due to both naturally created channels and the enhancement of SC-1, -2, and -4 (Table 16). SC-3, surveyed last in 2007, has increased in complexity by the creation of one additional island and one pool. Compared to 2007, there was an overall net gain for the study area combined of 1,706 ft in left bank bar edge and 933 ft of right bank bar edge habitat. Thirty percent of the increase in left bank bar edge and 23% of the increase in right bank bar edge occurred in SC-3. The remaining increase in bar edge occurred in the mainstem. Higher flow and high water levels in 2010 prohibit the ability to make valid comparisons to bank bar edge in SC-1 and SC-2 and are therefore not included in this analysis. Lastly, unit 37 (mainstem) and 50 (SC-3) no longer exhibit undercut bank features. Overall, compared to 2007, there was a net increase in the length of left bank undercut of 911 ft and a net increase length of 201 ft of right undercut bank. No other changes in undercut lengths were observed. Higher flow and high water levels in 2010 prohibit the ability to make valid comparisons to undercut features for SC-1 and SC-2 and are therefore not included in this analysis. 22
27 2007 Percent Total Surface Area (Lower 2.7 miles of Sultan R.) GLD HGR ISL LGR MCP Figure percent surface area per subtype for the lower 2.7 miles of the Sultan River. Habitat subtypes as described in Table 3: glide (GLD), HGR (high gradient riffle), island (ISL), low gradient riffle (LGR), and main channel pool (MCP) Main channel Mainstem habitat unit changes constituted ~10% of total bank length, along with localized changes in the vicinity of the engineered log jams. Specifically, the following changes were noted: three small side channels not previously mapped were observed at units 1-60 and 1-35 adding 747 ft of stream length and increasing wetted surface area by 16,004 ft 2 ; some bar edge lengths changed, resulting in net gains of 1,024 ft of left bar edge and 714 ft of right bar edge; undercut banks were no longer observed in 1-37; undercut lengths increased by 238 ft on the left bank and by 168 ft on the right bank due to the formation of undercuts at 1-35A and 1-92; seven large engineered log jams were installed to stabilize the entrances of the side channels and direct flow; small pools have either former or were constructed at the base of two of the installed jams; and the log jam at the mouth of SC-4 has accumulated additional wood beyond what was initially installed. The accumulation included 19 pieces and extends across the entrance to SC-4. The engineered log jams have stabilized the entrances to the side channels and appear to be functioning to direct flow into the side channels, as all side channels contained flowing water with 320 cfs mainstem flows. The engineered debris jams have accumulated (and will likely continue to accumulate) additional large woody debris and contribute to habitat complexity over time. 23

28 5.1.2 Side channels The four side channels vary in their complexity, with SC-2 and SC-3 being the most diverse with generally smaller and less uniform habitat units. SC-1 and SC-4 are homogenous, especially SC-4 which is 90% composed of one large, continuous glide. The enhancement of the side channels has led to increased habitats, even during low flows, as outlined in the results section. There has been a gain of 4,834 ft in low-flow stream channel length since 2007 (Table 16), adding habitat complexity and refugia. This gain comes through the reconnection (at lower flows) of the side channel extending south from habitat unit SC1-5, and containing SC1-1 and SC1-2. While this unit is currently primarily a largely homogenous run, it has abundant engineered LWD that provides cover, and over time should result in additional habitat complexity. Photos provided with the.kmz file will be useful in determining future changes to the side channels over time. Table 16. Side channel length comparisons from 2010 and 2014 data. Side channel 2007 and 2010 lengths (ft) 2014 digitized lengths (ft) Difference SC-1 2,512 5,744 3,232 SC-2 1,735 1, SC-3 2,202 2, SC-4 No Data 1,467 1,467 Total gain or loss in side channels 4,834 SC-1 SC-1 was previously surveyed for habitat in 2010 before enhancements were made to the channel. This survey did not include the southerly extension (units SC1-1 and SC1-2 of the 2014 survey). In 2014, SC-1 was largely uniform, consisting mostly of glides with smaller amounts of pools and riffles (Figure 8). The pools mostly appear to have been constructed or have formed at installed large woody debris. There are some deeper areas beginning to form at large wood structures within the glides, and it is reasonable to expect that habitat complexity will increase with additional high-flow events. Figure 8. Comparison of SC-1 composition by surface area in 2010 and In 2010, investigators mapped long contiguous areas of SC-1 as main channel pools, notably six contiguous pool units SC1-10 through SC1-15. In 2014, field observations indicated that this entire stretch should be mapped as a single glide unit (SC1-6), reflecting its homogeneous nature 24

29 and the absence of any habitat enhancements between 2010 and There are many possible reasons for the characterization as pools in 2010 and glides in 2014: actual changes to the morphology of the side channels, higher water in 2010, and the inherent subjectivity of habitat typing, especially among slower-water habitat types (Poole et al. 1997). Therefore, we do not believe that these results necessarily indicate that there has been a significant loss of pool habitat in the side channels, and in any case juvenile salmonids are likely to use pools and slow glides in much the same way (especially if the habitats have a similar degree of cover). Thus, although the raw data show a loss of pool area, any actual effect on fish would be premature. Likewise, in 2010, investigators quantified some riffles as high gradient. They chose to differentiate high- and low-gradient riffles to characterize variations in grade and substrate type. However, the 2010 high-gradient riffles did not approach the 4% grade threshold from Flosi et al. (1998) required to meet this definition; the same was true in 2014, and so this category was not mapped in the recent survey. Thus, the results do not indicate a loss of high gradient riffles between 2010 and 2014, only a change in classification criteria that is recommended to be maintained in all future surveys. SC-2 SC-2 is more structurally complex than SC-1, with generally smaller and less uniform habitat units. Although not yet occurring, the new LWD structures are likely to accumulate additional large wood and may retain spawning gravels and initiate pool formation over time. Figure 9. Comparison of SC-2 composition by surface area in 2010 and In the 2014 habitat typing, individual units were generally smaller than in 2010, and adjacent units of the same types were not subdivided into separate units unless there was an intervening unit of sufficient extent to be mapped (for instance, two glides were not mapped as separate units unless there was an intervening pool or riffle). When comparing 2010 and 2014 by surface area, results show a loss of pool habitat and an increase in glide habitat, although this distinction is highly flow-dependent and could primarily reflect the higher flows during the 2010 survey rather than an actual loss of pool habitat (Figure 9). Since 2010, there have been abundant wood structures (helicopter-placed logs) placed in many of these areas (i.e., mapped as pools in 2010 and as glide in 2014) at the north end of SC-2. Figures 10 and 11 illustrate two such areas near each other (SC2-5 in 2010 and SC2-15 in 2014). 25

.")
30 Figure 10. Glide (SC2-15) with helicopter placed logs (2014). Figure 11. Pool unit (SC2-5, 2010). Given the large amount of wood placed throughout SC-2 and visual comparisons such as these, the greater degree of habitat complexity and more, smaller habitat units in 2014 is likely an accurate indication of actual habitat changes between the two survey years, rather than simply an artifact of different mapping techniques between crews, or differences in flow. SC-3 In the Stillwater 2007 report, data for SC-3 were included in the OR1 mainstem reach. For this report, the side channel habitat unit data are reported as a separate reach (SC-3). Since the last survey, SC-3 has had an engineered large wood structure installed. The composition in terms of surface area per subtypes is unchanged between 2010 and 2014 (Figure 12). However, a secondary channel, not previously mapped, was surveyed adjacent to unit 1-54; it measured 317 ft in length with a surface area of 2,821 ft 2. In addition, units 1-52 and 1-53 (previously mapped as a low-gradient riffle and a glide) could not be differentiated and were combined into a single low-gradient riffle. Additionally, the upstream 134 ft of unit 1-51 (previously mapped as a glide) was identified as a pool. Additional changes in SC-3 since 2007 include: bar edge lengths increased for a net gain of 489 ft on the left bank and 219 ft on the right bank; undercut banks were no longer observed in unit 50; an island was formed at unit 1-54B; the length of the island at 1-55 was reduced by 83 ft ; and the length of the pool at 1-57 was reduced by 9 ft and its residual depth decreased by 4 ft. The effects of these minor changes on habitat and fish carrying capacity are both positive and negative, and likely not large in aggregate. 26
31 Figure 12. SC-3 composition by surface area in 2007 and SC-4 SC-4 was not previously surveyed. SC-4 habitat conditions are homogeneous with one glide unit, one riffle unit, and a pool at its mouth. 5.2 Large Woody Debris Characteristics There were some shifts in LWD distribution than can be best compared on the distribution maps and GIS layers from 2007 and In terms of number of pieces per mile, the amount of naturally occurring LWD in the mainstem of the Sultan River and SC-3 was little changed from 2007, with 35 pieces per mile in 2007 vs. 36 pieces per mile in The number of pieces tallied was very similar, with 120 pieces in 2014 and 107 in Most of the wood is individual pieces, with only two jams. One natural jam has formed at the mouth of SC-4 against an engineered log jam, and the other is unchanged from A jam recorded in 2007 on habitat unit 55 (an island), was not found by field staff in There were similar percentages of LWD present (primarily in Zone 2) in both survey years, with 56 % in 2014 and 55 % in The wood present was more decayed in 2014 than 2007, with 43% of the LWD classified in decay classes 4 or 5 in 2014, vs 22% in The amount of naturally occurring LWD in the lower 2.7 miles of the Sultan River and side channels is low and located on the stream margins. As such, it does little to contribute to fish habitat. The engineered log jams and LWD placed since 2007 were designed to provide habitat complexity, divert water into the side channels, retain gravel, provide bank habitat at varying flows, and roughen the flood plain. The engineered jams represent a significant increase in LWD in the mainstem over levels observed in 2007 and have begun to contribute to habitat complexity through the formation of pools and the accumulation and retention of natural LWD, which has limited availability (due to the upstream dam) and/or may be flushed downstream and lost from the system. In 2010, investigators noted only one debris jam (shown in photos as perched on the bank, and not extending into the wetted channel), two individual pieces of LWD, and several locations of placed wood in SC-1, and only seven pieces of LWD in SC-2. The habitat enhancements conducted since that time have contributed a very significant amount of LWD to the side channels. 27
32 The structures and logs in the side channels are providing cover for fish over a range of flows. Although most of the structures have not yet accumulated any additional large wood or led to the formation of pools, they are well-positioned to serve as a catalyst for habitat change (e.g. accumulation of addition wood, retention of gravel, and increasing habitat complexity in the side channels) in the future. 5.3 Sediment Characteristics Only one pebble count was conducted in 2007 in the Study Reach, and its location was revisited for 2014 (Table 17). Table 17. Comparison of approximate size distribution (in mm) of river substrate in the Study Reach for 2007 and Year Unit number Stream substrate particle size (mm) D 16 D 50 D * * The size distributions for this site were erroneously reported in RSP 22; values reported here were recalculated from the raw field data. As can be seen, the median and 84 th percentile particle sizes were smaller in 2007 than were present in This could be due to actual change in the particle size, the pebble counts could have been conducted in a different portion of Unit 89, or the variability could be due to the imprecise nature of pebble count data. Olsen et al. (2005) found that it is difficult to reduce differences in pebble count metrics among observers below 10 to 15 percent, with additional variability introduced by substrate heterogeneity at a site, timing, and differences in substrate sample locations. Thus, it cannot be conclusively determined from only one paired measurement that the observed differences between 2007 and 2014 are due to an actual, systematic shift in substrate size. 6 REFERENCES Edelen, W.J A Technical glossary of stream & river stabilization, restoration, and bioengineering terms. Flosi, G., Downie, S., Hopelain, J., Bird, M., Coey, R. and Collins, B. California salmonid stream habitat restoration manual rd ed. California Department of Fish and Game. Kondolf, G. M Assessing salmonid spawning gravels. Transactions of the American Fisheries Society 129: Kondolf, G. M., and M. G. Wolman The sizes of salmonid spawning gravels. Water Resources Research 29: 2,275 2,285. Lisle, T. E Using residual depths to monitor pool depths independently of discharge. Research Note PSW-394. USDA Forest Service, Pacific Southwest Forest and Range Experiment Station, Berkeley, California. 28
33 Mongtomery, D. R., J. M. Buffington, R. D. Smith, K. M. Schmidt, and G. Pess Pool spacing in forest channels. Water Resources Research 4: 1,097 1,105. Olsen, D. S., B. B. Roper, J. L. Kershner, R. Henderson, and E. Archer Sources of variability in conducting pebble counts: their potential influence on the results of stream monitoring programs. Journal of the American Water Resources Association 41:1,225 1,236 Pleus, A. E., D. Schuett-Hames, and L. Bullchild TFW monitoring program method manual for the habitat unit survey. Prepared for the Washington State Dept. of Natural Resources under the Timber, Fish and Wildlife Agreement. TFW-AM ; DNR#105. Poole, G. C., Frissell, C. A., Ralph, S. C In-stream habitat unit classification: inadequacies for monitoring and some consequences for management. Journal of the American Water Resources Association 33: Ralph, S. C., G. C. Poole, L. L. Conquest, and R. J. Naiman Stream channel morphology and woody debris in logged and unlogged basins of Western Washington. Canadian Journal of Fisheries and Aquatic Sciences 51: Robison, E. G., and R. L. Beschta Characteristics of coarse woody debris for several coastal streams of southeast Alaska, USA. Canadian Journal of Fisheries and Aquatic Sciences 47: 1,684 1,693. Schuett-Hames, D., A. E. Pleus, J. Ward, M. Fox, and J. Light TFW monitoring program method manual for the large woody debris survey. Prepared for the Washington State Deptartment of Natural Resources under the Timber, Fish, and Wildlife Agreement. TFW-AM DNR#106. Wolman, G. M A method of sampling coarse river-bed material. Transactions, American Geophysical Union 35, Number 6. 29
34 Appendix A Field Data Sheets
35 Sultan River In-River Habitat Survey Date QC Reach Form # of Date NSO (cont) Crew QC'er BFW Criteria Recorder Dimensions Pool Data Bar Edges Undercut bank nso core unit type sub unit type unit category length (ft) avg. depth(ft) wet width1 wet width2 wet width3 Pool Out Depth Pool Form Fact Pool Max Depth Dive (Y/N) bar % left bank bar % right bank uc % left bank uc width (ft) uc % right bank uc width (ft) comments
36 Reaches Operational Reaches A RM Confluence with Skykomish River upstream to BPA transmission line crossing B RM BPA transmission line crossing upstream to Jackson Powerhouse Process Reaches C RM Jackson Powerhouse upstream to City of Everett Diversion Dam D RM City of Everett Diversion Dam upstream to Culmback Dam Habitat Unit Codes Core Unit Types Riffle Pool Sub-surface flow Wetland Obscured Other R P SSF W OB OT Sub - unit types (Calif. salmonid stream restoration manual) Pool forming features (TFW pg 24) Pool MCP main channel pool (e.g. trench pool, mid-channel pool, channel conf. pool, step pool) 1 LWD log(s) 7 channel bedform SCP scour pool (e.g. corner pool, scour enhanced by root wad - log - boulder) 2 LWD rootwad(s) 8 resistant bank BKW backwater pool 3 LWD jam 9 artificial bank 4 roots of standing trees or stump(s) 10 beaver dam 5 Boulder(s) 11 other / unknown 6 Bedrock Riffle LGR Low gradient riffle HGR High gradient riffle GLD Glide CAS Cascade Unit Category 1 primary units: dominant units in the mainchannel 2 secondary units: sub-dominant units within the main channel that span less than 50% of the wetted channel width along less than half their channel length 3 side channel units: units in smaller clearly defined channels that are separated from main low flow channel (say by an island for example)
37 LWD Single Pieces Date Reach Form # of NSO (cont) Crew BFW Recorder NSO Rtwd diam 20cm Diameter Small >20 to <40cm Med 40 to <60cm Large >60cm Length (ft) Zone 1 or 2 Mid-chan (Y/N) Rtwd (Y/N) Anchor R / P / B / U Species Conf / Dec / Unk Decay Class (1-5) KEY PIECES Key Piece # Piece Diam (cm) QC'D BY DATE:
38 LWD data sheet debris jams Sultan River LWD SURVEY Date QC Debris Jams Reach Form # of OC'er NSO (cont) Recorder Date BFW Criteria LWD DEBRIS JAMS NSO Jam # Lowest Zone (1or2) Mid- Chan (Y/N) Tally Rtwd diam 20cm Tally Pieces Approx 20 cm Key Piece# DJ Largest Piece Diam (cm) Length (ft) DJ Length (ft) DJ Dimensions DJ Width (ft) DJ Height (ft)
39 LWD Hab Survey Codes Descriptions ZONE 1 ZONE 2 ZONE 3 defined as the portion of the bankfull channel that is wetted at the time of the survey, regardless of whether the water is flowing or stagnant defined as the area between the bankfull channel edge on both banks, below an imaginary line that connects those points, above the wetted gravel bars channel surface, and includes areas such as dry the area vertically above Zone 2, the bankfull channel ZONE 4 area outside of the bankfull channel and Zone 3 LWD Log Criteria 1 dead 2 the root system (if present) no longer supports the weight of the stem / bole 3 minimum diameter of 0.1 meters along 2 meters of its length, AND 4 minimum 0.1 meter of length extending into the bankfull channel LWD Rootwad Criteria 1 dead 2 root system detached from original position 3 minimum diameter of 0.2 meters with a total length <2 meters; AND, 4 minimum 0.1 meter of length extending into the bankfull channel LWD Jam Identification 1 minimum 10 qualifying pieces of LWD either physically touching at one or more points, or associated with jam structure 2 minimum 0.1 meter of one LWD piece's length extending into the bankfull channel KEY PIECE CRITERIA See pg 17 and Appendix C of TFW Large Woody Debris Survey Manual
40 Sultan River Habitat Survey Wolmann Pebble Count Date Date Reach Reach NSO BFW (m) NSO BFW (m) FeatureID Feature# size (mm) Count Total # size (mm) Count Total # Mud Silt <2 Mud Silt <2 Fine Sand <2 Fine Sand <2 Sand 2-4 Sand 2-4 G 4-6 G 4-6 R 6-8 R 6-8 A 8-12 A 8-12 V V E E L L S S C C O O B B B B B B L L D D R R S S Bdrck Bedrock Bdrck Bedrock Comments: Total = Total = Comments:
41 Comments Log Sultan River Hab Survey Aerial Photo Mapping: Landmark / Photo / Comments Log Date: River Reach: Form of Comments NSO ID / Item# Photo# GPS ID Info
42 Appendix B Maps Illustrating 2014 Habitat Units

43

44
45
46

47

48
49
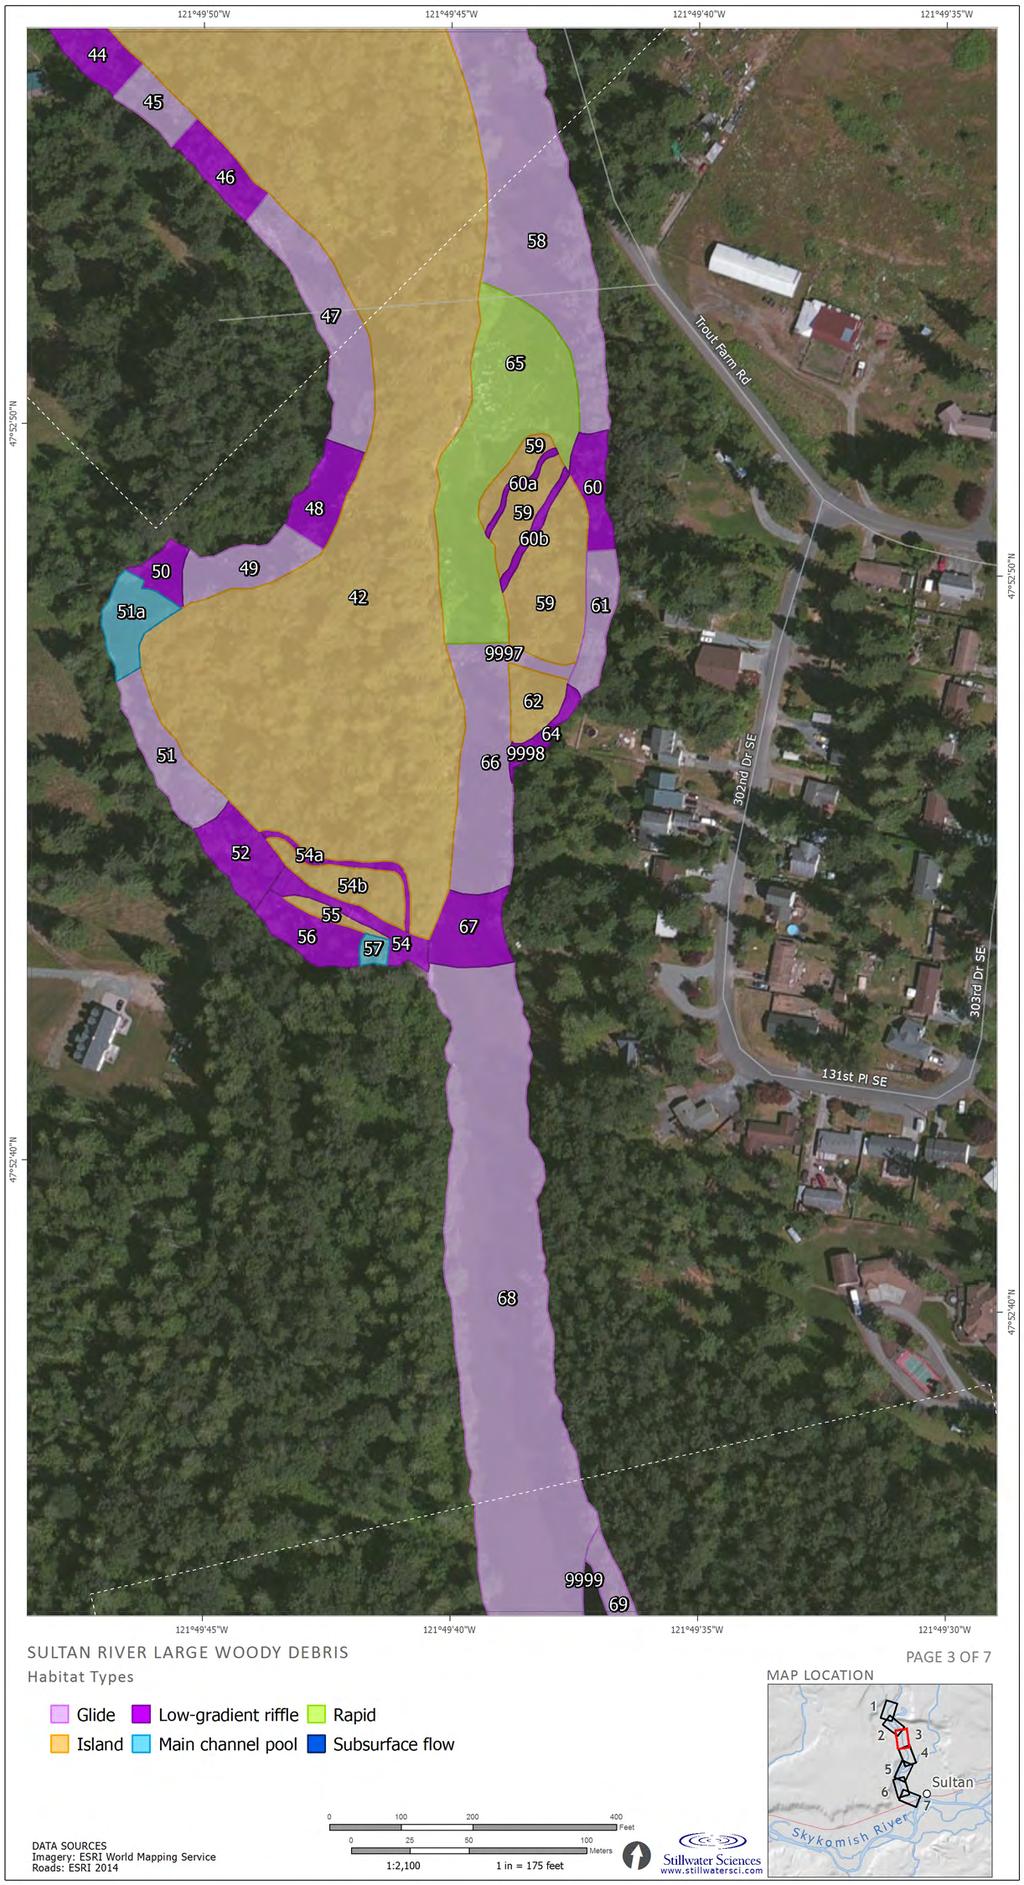
50 Appendix C Maps Illustrating Large Woody Debris

51
52
53

54

55
56

57
58 Appendix D Maps Illustrating 2010 Habitat Units

59

60