A Report on Existing and Possible Tree Canopy in the borough of Pottstown, PA
|
|
|
- Brenda Small
- 5 years ago
- Views:
Transcription


1 Pottstown Land Cover
 is the layer of leaves, branches, and stems of trees that cover the ground when viewed from above.")


 found that 778 acres of the borough were covered by tree canopy (termed Existing")
 of the borough s land area could theoretically be modified to accommodate tree canopy (termed Possible TC).")
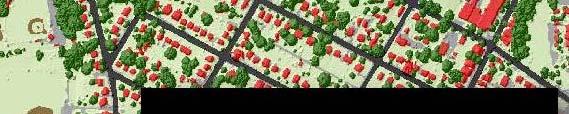
2 A Report on Existing and Possible Tree Canopy in the borough of Pottstown, PA Why is Tree Canopy Important? Tree canopy (TC) is the layer of leaves, branches, and stems of trees that cover the ground when viewed from above. Tree canopy provides many benefits to communities, improving water quality, saving energy, lowering summer temperatures, reducing air pollution, enhancing property values, providing wildlife habitat, facilitating social and educational opportunities, and providing aesthetic benefits. Establishing a tree canopy goal is essential for communities seeking to improve their green infrastructure. A tree canopy assessment is the first step in urban forest planning, providing estimates for the amount of tree canopy currently present in a county as well as the amount of tree canopy that could theoretically be established. National Research Council. Urban Forestry: Toward an Ecosystem Services Research Agenda: A Workshop Summary. Washington, DC: The National Academies Press, How Much Tree Canopy Does Pottstown Have? An analysis of Pottstown, PA based on land cover data derived from highresolution aerial imagery and LiDAR (Figure 1) found that 778 acres of the borough were covered by tree canopy (termed Existing TC), representing 25% of all land in the study area (Figure 2). An additional 51% (1,600 acres) of the borough s land area could theoretically be modified to accommodate tree canopy (termed Possible TC). In the Possible TC category, 35% (1,095 acres) of total land area was classified as Vegetated Possible TC and another 16% as Impervious Possible TC (505 acres). Vegetated Possible TC, or grass/shrub, is more conducive to establishing new tree canopy, but establishing tree canopy on areas classified as Impervious Possible TC will have a greater impact on water quality and summer temperatures. Project Background The goal of the project was to apply the USDA Forest Service s Tree Canopy Assessment protocols to the Borough of Pottstown, Pennsylvania. The analysis was conducted using imagery acquired in 2010 and LiDAR acquired in This project was made possible through funding from Trees, Inc. The Spatial Analysis Laboratory (SAL) at the University of Vermont s Rubenstein School of the Environment and Natural Resources carried out the assessment in collaboration with Montgomery County, the Delaware Valley Regional Planning Commission, Trees Inc. and the USDA Forest Service s Northern Research Station. Pottstown Study Area Figure 1: Study area and example of the land cover derived from highresolution imagery for this project. Figure 2: Tree Canopy metrics for Pottstown based on % of land area covered by each TC type. Key Terms TC: Tree canopy (TC) is the layer of leaves, branches, and stems of trees that cover the ground when viewed from above. Land Cover: Physical features on the earth mapped from aerial or satellite imagery, such as trees, grass, water, and impervious surfaces. Existing TC: The amount of urban tree canopy present when viewed from above using aerial or satellite imagery. Impervious Possible TC: Asphalt or concrete surfaces, excluding roads and buildings, that are theoretically available for the establishment of tree canopy. Vegetated Possible TC: Grass or shrub area that is theoretically available for the establishment of tree canopy. Not Suitable: Areas where it is highly unlikely that new tree canopy could be established (primarily buildings and roads).
, was 11%, much lower than the 25% obtained in this study (based on the total")
, which only accounted for")
, and LiDAR acquired in 2010, in")
.")
.")
.")
 Existing Tree Canopy (TC) b.")
3 Mapping Pottstown s Trees Parcel Summary A previous estimate of tree canopy for Pottstown, derived from the 2001 National Land Cover Database (NLCD 2001), was 11%, much lower than the 25% obtained in this study (based on the total area of the borough, including water). This large difference was attributable to the low resolution of NLCD 2001 (Figure 3a), which only accounted for relatively large patches of tree canopy. Using highresolution satellite imagery acquired in the summer of 2012 (Figure 3b), and LiDAR acquired in 2010, in combination with advanced automated processing techniques, land cover for Pottstown was mapped with such detail that trees as short as 8ft tall were detected (Figure 3c). After land cover was mapped for the study area, Tree Canopy (TC) metrics were summarized for each property in the study area s parcel database (Figure 4). Existing TC and Possible TC metrics were calculated for each parcel, both in terms of total area (square footage) and as a percentage of the land area within each parcel (TC area divided by land area of the parcel). The resulting data can be used to assess the tree canopy and tree planting opportunities for every property in the borough of Pottstown. Parcels a. NLCD 2001 Percent Tree Canopy (30m) Existing Tree Canopy (TC) b Aerial Imagery (1m) Possible Tree Canopy (TC) c. Tree Canopy from 2012 Imagery Figure 3: Comparison of NLCD 2001 (a) to high-resolution imagery (b) and tree canopy (c) derived for this study. Figure 4: Parcel-based TC metrics. TC metrics are generated at the parcel level, allowing each property to be evaluated according to its Existing TC and Possible TC.


4 Land Use UTC assessment methods permit analysis of Existing and Possible Tree Canopy according to any geography of interest, such as land use (Figures 5 and 6) from the County s existing parcel database. The land use analysis showed how important residential areas for sustaining and increasing the borough s tree canopy as residential land is the single largest land use type by total land area, total area of Existing TC and total area of Possible TC. Nevertheless, there is clear evidence that an all lands approach would be required if Pottstown is to make substantial gains to its tree canopy coverage. Figures 5 and 6: Graphics of tree canopy metrics relative to generic land-use categories for Pottstown, PA. The size of each rectangle is proportionate to the amount of land in each land-use category, while the color gradient represents the percentages of existing and possible tree canopy. The percentage text indicates the amount of land in each class covered by Existing or Possible TC respectively. This is followed by the Existing and Possible TC acreage in each category.


.")
.")
5 Socio-Demographic Analysis US Census block groups contain a wealth of socio-demographic information that, when combined with Tree Canopy metrics, provide new insights into the relationship between the citizens of Pottstown and their tree canopy. This study computed tree canopy metrics using 2010 US Census data. Percent Existing and Percent Possible Tree Canopy maps indicate socio-demographic units where tree canopy is sparse and where planting opportunities exist (Figure 7a & 7b). These maps can be used to help direct resources for tree planting. Many of the block groups in the lowest median income brackets have a relatively low amount of tree canopy (Figure 7c). Population density is relatively high in some of these block groups with low amounts of Existing Tree Canopy and would thus be places to look at enhancing tree canopy for the benefit of these population centers (Figure 7d). (a) (b) (c) (d) Figure 7: (a) Percent Existing TC; (b) Percent Possible TC; (c) 2011 median income per capita; and (d) people per square mile for census block groups in Pottstown, PA.

. A higher PPI score indicates a higher priority for planting.")
6 Priority Planting Index The Priority Planting Index (PPI), developed by the US Forest Service, incorporates census data and Tree Canopy metrics to score block groups based on the need for tree plantings. It is a simplistic method to prioritizing areas for tree plantings. The Priority Planting Index, which factors in population density, Existing Tree Canopy, and per capita tree cover helps to identify areas where tree planting efforts can be targeted to address issues of environmental justice (Figures 8 & 9). A higher PPI score indicates a higher priority for planting. Interestingly, the areas with high PPI values also have relatively high amounts of Possible Tree Canopy (see previous page). Analysis of Pottstown compared with the rest of Montgomery County shows a majority of the study area to be below average in both existing tree canopy and tree canopy per capita (figure 10). Figure 8: Tree canopy per capita by census block group in feet squared per person. Figure 9: Priority Planting Index by census block group. Figure 10: Comparison of existing tree canopy and tree canopy per capita in census block groups in Pottstown and surrounding Montgomery County.

 illustrated this effect in the Pottstown and greater Montgomery County region. (Figure 11).")


7 Urban Heat Island Effect A well-known benefit of trees is their ability to reduce ground-surface temperatures, both by direct shading and retention of soil moisture. In areas where tree canopy has been removed, surface temperatures can be substantially higher than adjacent forested areas. The effect may be most pronounced in areas with extensive impervious surfaces, which absorb and hold thermal radiation from the sun. Analysis of recent thermal data (Landsat, August 28, 2010) illustrated this effect in the Pottstown and greater Montgomery County region. (Figure 11). This relationship was further confirmed by plotting surface temperature versus Existing Tree Canopy, summarized according to census block groups in Pottstown and Montgomery County, PA; a statistically-significant inverse relationship was apparent, with surface temperatures increasing as tree canopy decreased, and impervious area increased (Figure 12). This graphic further shows Pottstown as having above-average surface temperatures and below-average tree canopy compared with Montgomery County as a whole. Pottstown Study Area Figure 11: Landsat-derived surface temperatures for Pottstown, PA and surrounding area, August 28, Figure 12: Plot of surface temperatures versus percent Existing Tree Canopy, summarized according to US Census Block Groups in Pottstown, PA and surrounding Montgomery County, August 28, 2010.


8 Watersheds In addition to political and social criteria, tree-canopy patterns can be summarized according to many environmental geographies of interest. Watershed boundaries, for example, better show the borough s distribution of tree canopy as it affects the hydrologic environments of the study area. Figures 13 and 14 show the existing and possible tree canopy percentages for the extents of the four subwatersheds that fall within the Pottstown town boundary. These areas flow into the Schuykill River, Manatawny Creek, and Sprogles Run. The areas of these watersheds that fall outside the Pottstown boundary were removed from this analysis. The upstream subwatershed of the Schuykill River contains the highest percentage of tree canopy in the study area, but also has the largest potential for increased tree canopy area, reflecting the lower population density in this area. The more urbanized downstream subwatershed of the Schuykill has the lowest percentage of existing tree canopy, but maintains a fairly high percentage of possible tree canopy area, showing large potential hydrological benefits from urban tree canopy restoration efforts in this area. Existing Tree Canopy Manatawny Creek Possible Tree Canopy Sprogles Run Manatawny Creek Schuykill River Sprogles Run Schuykill River Figures 13 and 14: Existing and Possible Tree Canopy for subwatersheds within the Pottstown town boundary. GIS Database Decision Support GIS Database Parcel-based Tree Canopy (TC) metrics were integrated into the County s existing GIS database. Decision makers can use GIS to query specific TC and land-cover metrics for a parcel or set of parcels. This information can be used to estimate the amount of tree loss in a planned development or set TC improvement goals for an individual property. Figure 15: GIS-based analysis of parcel-based TC metrics for decision support. In this example, GIS is used to select an individual parcel. The attributes for that parcel, including the parcel-based TC and land-cover metrics, are displayed in tabular form providing instant access to relevant information.

, this value estimated at approximately $9.")
9 Valuation of Ecosystem Services A major reason why tree canopy is underprovided in urban areas is because there is not a market value attributed to the numerous services they provide to inhabitants of these areas. Significant research has been done to address this problem by estimating the non-market monetary value that trees create in populated environments. Using the criteria that has been developed by the leading research in this field (figure 16), an estimate can be made of the value that the trees in Pottstown provide its residents based on the tree canopy metrics determined through this study. Shown below (figure 17), this value estimated at approximately $9.1 million per year is broken down by land use type to show the various types of value created by the existing tree canopy in Pottstown. It should be noted that these values are only estimates and that it is impossible to truly capture all the value that trees provide urban inhabitants. However, using this as a guide can be a helpful tool to show where investment in tree canopy improvements may have the largest ecological return on investment. Figure 16: Value estimates of urban tree canopy per hectare. Figure 17: Ecosystem Service Values of tree canopy in Pottstown by land use types.


10 Tree canopy in Pottstown, PA is a vital asset that reduces stormwater runoff, improves air quality, reduces the borough s carbon footprint, enhances quality of life, contributes to savings on energy bills, and serves as habitat for wildlife. The borough of Pottstown should consider setting tree canopy goals, not only for increasing the overall tree canopy but to focus on increasing tree canopy in urban and residential areas that have low Existing Tree Canopy and high Possible Tree Canopy. Strategies for increasing tree canopy will likely differ by land-use type. The outreach and incentive mechanisms for planting trees on commercial properties will differ greatly from residential properties. New urban development projects in Pottstown should include in their plans new tree plantings in yards, common areas, and transportation rights-of-way. These new trees will produce a net gain in canopy while mitigating the effects of increased impervious surfaces. Some land uses will not necessarily be appropriate for planting trees, including vegetated lands that are occupied by cemeteries, golf courses, and wetlands. Efforts to increase tree canopy in these areas and other highly-developed zones might be most efficiently focused on extensive impervious surfaces such as parking lots and industrial sites, where tree canopy must be Conclusions limited in areal extent yet often offer important reductions in stormwater runoff. The shade produced by trees in developed areas also help reduce the urban heat island effect. This type of limited but strategic tree planting is pertinent to all land-use types that contain vegetated or impervious surfaces; many opportunities exist for expanding tree canopy. For example, other potential sites include road medians, sidewalks, driveways, storage areas, large expanses of lawn, and brushy vegetation. Under the right circumstances, these sites could be modified to support additional trees. There is evidence that tree canopy coverage is linked to sociodemographic factors. The information from this study can be used to better address environmental justice issues. Pottstown s residents are key to preserving the borough s existing tree canopy along with any efforts to increase tree canopy as residential land is the single largest land use type, more tree canopy is on residential land than any other land use type, and there is more room to plant trees on residential land than any other land use type. Efforts to preserve and expand Pottstown s tree canopy will likely take many forms. Tree canopy prioritization analyses can help managers make strategic decisions to match their objectives, from the property parcel level to the watershed scale. Figure 18: Comparison of Existing and Possible Tree Canopy with other Pennsylvania communities that have completed Tree Canopy Assessments. Prepared by: Jarlath O Neil-Dunne University of Vermont Spatial Analysis Laboratory joneildu@uvm.edu Additional Information For more info on the Urban Tree Canopy Assessment please visit Spatial Analysis Lab Tree Canopy Assessment Team: Noah Ahles, Ernie Buford, Paige Cornell, James Clark, Mike Franck, Daniel Hedges, Jon Liebherr, Sarah Leidinger, Laura Kim, Sean MacFaden, Amy Mietkiewicz, Thomas Nieuwenhuis, Jarlath O Neil-Dunne, Tim Pede, Max Reis, Bradley Roy, Anna Royar, Henry Schmid, and Benjamin Whitney.