Greening Oakland s Infrastructure Tree by Tree
|
|
|
- Austin Morton
- 5 years ago
- Views:
Transcription


1 Greening Oakland s Infrastructure Tree by Tree Greg McPherson Environmental Lecture Series Oakland, CA March 5, 2008 Center for Urban Forest Research


2 Vision Habitat for People


3 Cities Without Trees


4 Cities With Trees Cooler cities Lower energy bills Safer cities Happy people Less stress Clean air Better shopping Clean water


5 Cause for Concern? Value goes down

6 Today Value of trees in Oakland Sustainable streets
7 Tree Quiz Bradford Pear 9 years old 9 inch dbh 28 ft. tall 19 ft. spread Number of leaves?? (#) Total leaf area?? (sq.ft.) H 2 O retainment capacity?? (gal)

8 Tree Quiz Bradford Pear 9 years old 9 inch dbh 28 ft. tall 19 ft. spread Number of leaves 88,908 Total leaf area 3,846 sq ft H 2 O retainment capacity 55 gal


9 To demonstrate new ways that trees add value - quality of life - to communities. Center for Urban Forest Research USDA Forest Service PSW Research Station Davis, CA We convert research results into financial terms to stimulate community investment in trees.

10 Areas of Research Investment Value Benefits and Costs Energy Conservation Air Quality Improvement Reducing Runoff FireWise Landscapes

11 Today Value of trees in Oakland Sustainable streets


12 Benefit-Based Approach Structure Function Management Value
13 Benefit-Cost Modeling Tree Building/ Utility Climate Benefit Prices Program Costs Benefit Models Energy Air Quality Carbon Runoff Aesthetics Resource Units Benefit and Cost Values

14 Reference City Research Collected data Berkeley park/street trees Analyzed growth rates and dimensions Estimated magnitude of annual benefits Priced benefits Priced tree care costs Calculated net annual benefits, benefit-cost ratios

15 Products Municipal Forest Resource Assessment Regional Tree Guide Regional Benefits And Costs Calculated Examples of Estimating Benefits And Costs Of Tree Planting Projects Guidelines For Selecting And Placing Trees STRATUM data sets
16 City Tree Survey Stratified random sample Predominant species» 22 species representing ~75% of forest trees per species Minimum 40 year age range

17 Tree Measurements 25 measurements for each tree, including: Diameter-at-breast-height Tree height Crown (bole) height Crown diameter Leaf area Crown shape Tree orientation and setback Condition and location Pruning level Grow space type and size Hardscape damage
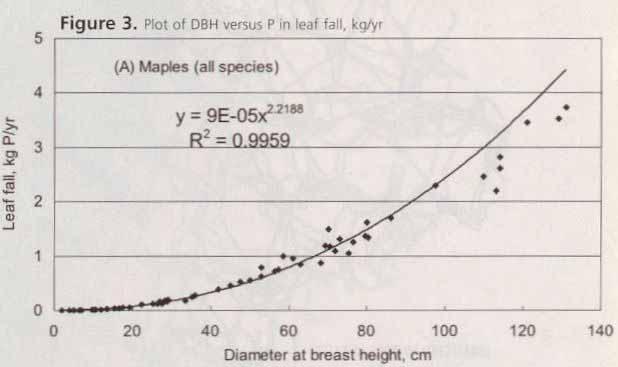
18 Fit Curves for Growth 16 SPECIES: Littleleaf Linden Height (m) HT DBH PHT2 DBH UB2 DBH LB2 DBH DBH (cm)


19 For typical large, medium, small, and conifer tree. Velvet ash Cherry plum Camphor Monteray pine Dimensions at maturity differentiate tree size. For public (street/park) and private property locations (east, south, west). Reporting Results
20 Size at 20 Years Small Medium Large Height (ft) Spread (ft) LSA (sq ft) ,370
 Carbon trading credits - CO 2 ($15/ton) Damage value and control cost of emissions air pollutants (Wang & Santini) Retention/detention costs")
21 Research Process Value Analysis Pricing Benefits Oakland market prices ($0.13/kWh, $1.31/therm) Carbon trading credits - CO 2 ($15/ton) Damage value and control cost of emissions air pollutants (Wang & Santini) Retention/detention costs stormwater runoff ($0.004/gal) Median sale price - residential property = $525,000

22 Research Process Value Analysis Calculating Costs Surveyed 8 commercial and municipal arborists: Planting Pruning Removal and disposal Pest and disease control Irrigation Infrastructure Leaf litter cleanup Liability Administration
23 Average Annual Street Tree Management Costs ($28/tree) Infrastructure Repair 8% Clean-Up 1% Admin/Other 3% Planting 13% Remove/Dispose 6% Pruning 69%
24 Research Process Value Analysis Calculating Net Benefits Benefits minus Costs

25 Conserving Energy
26 Conserving Cooling Energy West is the best South solar access Shade heat sinks Increase canopy citywide to reduce heat island
, Street/Park Save annual")
 $32/yr total")
27 Conserving Energy Velvet ash, 20 years (34- ft tall), Street/Park Save annual AC costs (127 kwh, $27/yr) Save winter heating costs ($5) $32/yr total savings

28 Reducing Atmospheric Carbon Dioxide

29 Reducing Atmospheric Carbon Dioxide Increase tree stocking levels Create diverse habitats Select well-adapted, long-lived trees Locate to maximize energy savings Utilize removed trees Wood products Bioenergy
30 Reducing CO 2 Velvet ash, 20 years, Street/Park Total Net = 135 lb Total Value = $1

31 Reducing Stormwater Runoff
32 Reducing Stormwater Runoff Watershed benefits can exceed irrigation costs Water quality benefit can exceed flood control benefit To maximize interception: Large leaf and stem surface areas Coarse textured surfaces Match foliation period to rainfall pattern


33 Reducing Runoff Velvet ash, 20 years Intercepted = 535 gal Value = $3


34 Improving Air Quality Ozone: 160 million people Particulates: 100 million people

35 Improving Air Quality


36 Improving Air Quality Lots 3 F degrees cooler Cabin degrees cooler Gas temp 4-8 degrees cooler Reduce VOC 1ton/day Parking Lots

37 Improving Air Quality Plant tolerant species Conifers Hairy plant parts, long petioles Oak, birch, sumac, maple, ash Locate close to and downwind of source, plant multiple rows Sustain large, healthy trees Shade parked cars

38 Improving Air Quality Velvet ash, 20 years, (lbs) NO2 = 0.17 SO2 = 0.04 PM10 = 0.28 Ozone = 0.20 VOCs = 0.01 BVOCs = 0.00 Net Value = 0.69, $1

39 Others Things Trees Do

40 Trees. Vital to Human Health. Tree-filled neighborhoods: Lower levels of domestic violence Are safer and more sociable Tree-filled landscapes reduce stress Trees decrease need for medication and speed recovery times
 Each large front yard tree adds 1% to sales price Large specimen trees")
41 Trees Sell Houses. (At higher prices.) Each large front yard tree adds 1% to sales price Large specimen trees can add 10%, or more, to property values.


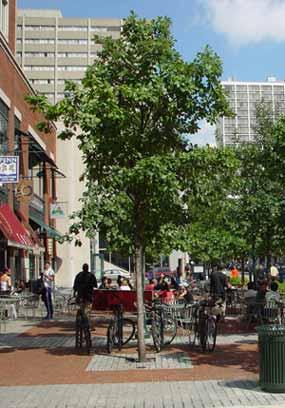
42 Trees Mean Better Business. In tree-lined commercial districts... More frequent shopping Longer shopping trips Shoppers spend more for parking Shoppers spend 12% more for goods

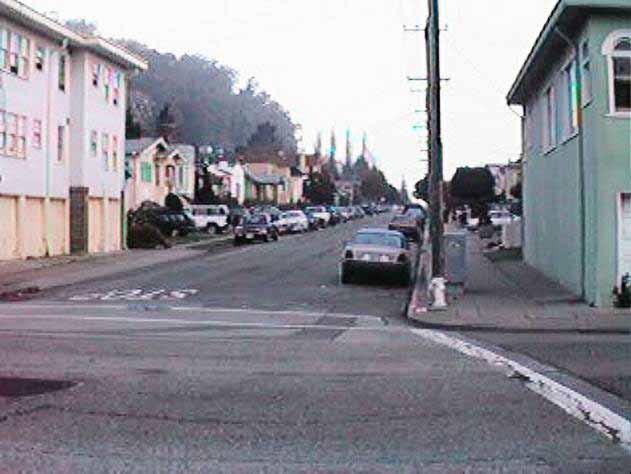
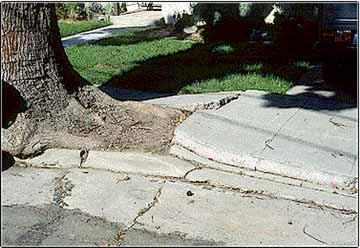
43 Trees Improve Pavement Performance. More shade means more time between repaving. 20% shade improves pavement condition by 11%. 60% savings for resurfacing in 30 years

44 Aesthetic and Other Benefits Velvet ash, 20 years $85
45 Benefits, Costs, Net Benefits Velvet Ash, Street/Park $/Year Year after planting Year after planting Energy Carbon Air Quality Storm Runoff Aesthetic/Other Planting Pruning Remove/Dispose Net Infrastructure Benefit Repair Clean-Up Admin/Other
46 Average Annual Total Benefits and Costs Costs $17.20 $24.02 $28.35 Benefits $46.67 $65.99 $ Net Benefits $29 $42 $101

47 Today Value of urban trees Sustainable streets

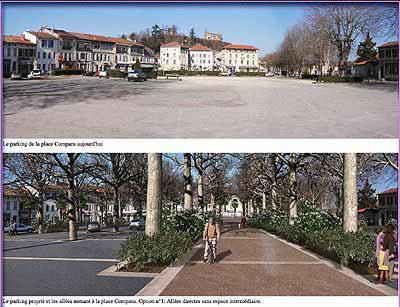
48 Urban Advantage

49 Urban Advantage

50 Ettie Street Watershed


51 Initial Results 1,400 planted 9% TCC increase 3% runoff reduction 946 lbs of pollutants 19-32% interception Runoff 4 times greater 1% vs 15% TCC


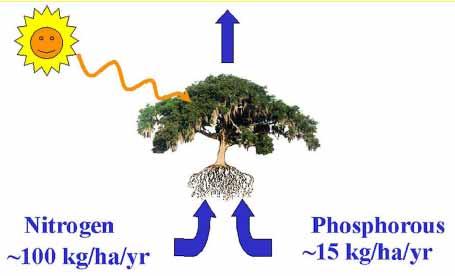
52 Ultimate Fate of Pollutants
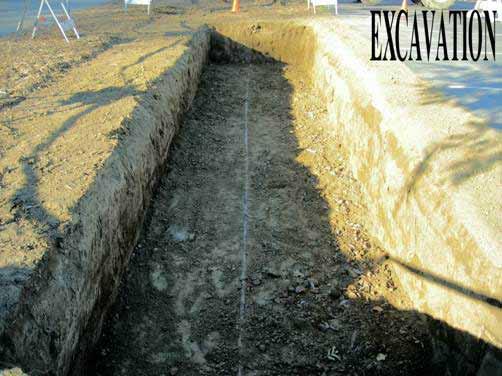
53 Green Infrastructure BioTechnology Engineered soil permits tree growth and reduces runoff
54 Green Infrastructure BioTechnology

55 Green Infrastructure BioTechnology Trees: Solar powered green machines
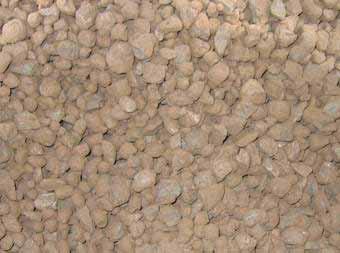


56 Engineered Soil Carolina Stalite soil (CS) Davis soil
57 Pollutant Removal N TKN NH4-N NO3-N P K Zn Cr Average % Max Min STD

58 UCD Parking Lot


59 Parking Lot Measurements Runoff quantity Water quality Surface runoff Subsurface moisture Tree growth

60 Urban Advantage

61 Urban Advantage
62 Size & Longevity Matter CO2 after 60 years Crape myrtle 150 kg Hackberry DBH ,500 kg Years After Planting Hackberry Crape Myrtle
63 Tree Species Matters Crown density Complexity Surface features Foliation period


64 Space Matters Sidewalk Damage - Large Trees '% of Trees Damaging''''' Setback Between Tree Center and Sidewalk (ft)

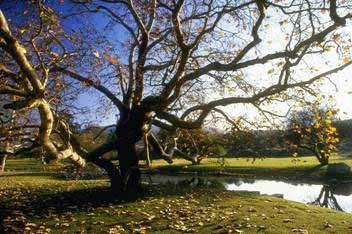
65 Make More Space For Trees

66 Space in Our Hearts & Minds

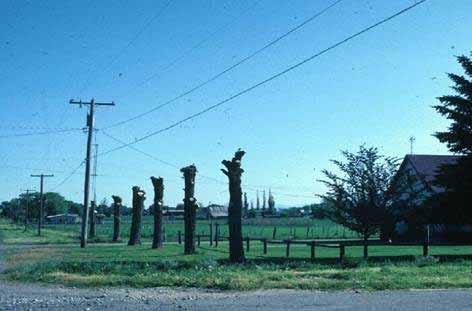
67 Challenges Safety Visibility Lighting Crashes Other Infrastructure Roots, hardscape, sewers Leaves and litter Powerlines Irrigation and subbase Crows Other Environmental Diversity and Invasive Species BVOCs, allergens Runoff water quality Solar access Water conservation Solid waste

68 Opportunities Urban forestry in spotlight Carbon, water, and air quality investments utilities, cities, corporations How best design plantings to maximize effect & minimize conflicts? Regulatory quality data on performance? Installation Survival Growth Performance


69 We Live in an Urban Forest
70 Questions?