Benefits on supply chain performance of implementing a regional logistic centre
|
|
|
- Lucy Hardy
- 5 years ago
- Views:
Transcription


1 Benefits on supply chain performance of implementing a regional logistic centre Luc LeBel, ing.f., Ph.D. François Sarrazin, M.Sc. Nadia Lehoux, ing. Ph.D. FORAC research consortium Université Laval Stellenbosch, South Africa Feb. 27 March v
, Avg stem size 0.130 m3 (SPF) Biological product Freshness, heterogeneity Author: L.")
2 Sorting : Think Trees species of trees and shrubs in Canada s forests Fir, Spruce, Pine, Birch, Poplar, Larch, Ash, Cypress, Cedar, Linden, Willow, Sizes vary greatly ex: In Quebec, 2 to 20 m (height), Avg stem size m3 (SPF) Biological product Freshness, heterogeneity Author: L. LeBel 2

3 Operations in the forest are expensive Typical logging camp Author: Groupe Rémabec Expo-Conférence Université Laval, 1er février

4 Forest product industry network The Forest Products Network involves Numerous and diversified stakeholders for the procurement, production and transportation of products to the market Divergent processes 4 different supply chains Source: Lehoux et al., 2012 Different activities related to each other 4


5 On the Road Again Author: L. LeBel Source: Author: L. LeBel Author: L. LeBel Author: L. LeBel 5
 Author:")

6 Extra-heavy load ( kg pay load) Author: Groupe Rémabec Stellenbosch, 27 fev.- March

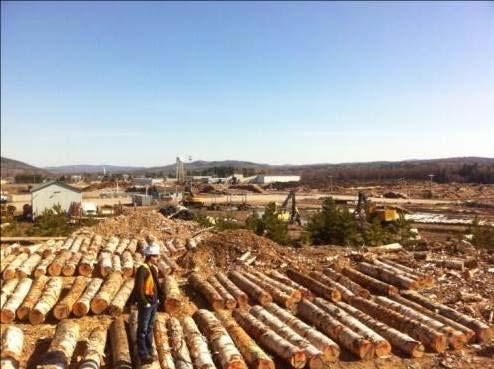
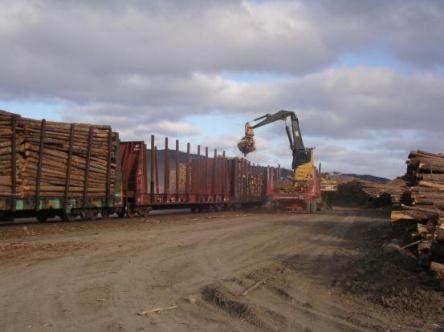


7 Photos: L. LeBel
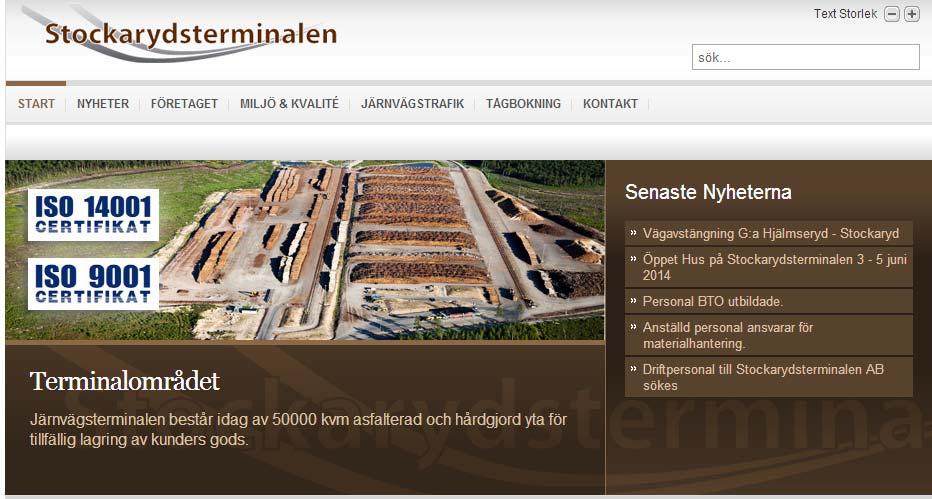
8 Source: stockarysterminalen 8

9 9


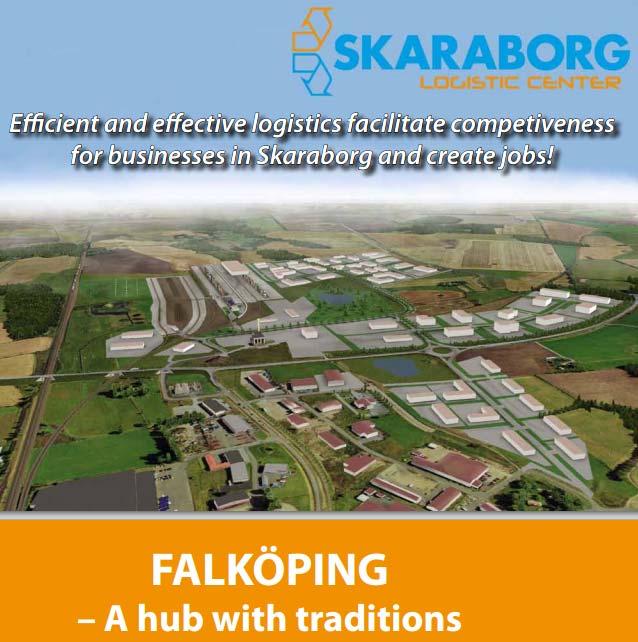
10 Integration of the logistical centre in the forest network?? Stellenbosch, 27 fev.- March
 Stellenbosch, 27 fev.")
11 Research objectives Establish a model for conceiving and piloting a logistical centre Identify the key parameters in regards to the profitability of this centre Test the model to a real case Develop the business model Source: Cloutier et al. (2009) Stellenbosch, 27 fev.- March
12 Pros and cons of sorting and processing yards Pros : Lower sorting cost Fewer sorting errors Make possible the use of heavy load trucks Coordination hub Cons : Additional wood handling Fewer direct deliveries Capital costs of implementing the yard Stellenbosch, 27 fev.- March
13 Model : Profit maximisation Objective function : Network revenues Harvestingcosts Stumpage and fees Sorting costs Transport cost Yard costs Storage costs i u u U p p P D V l f p M P l i p l c c s p P E l i p l f x c p l f s pl i x V spl i p nbm ois I x pl iu c x c x p lt plt t plt ij ij ij ij i j p l t i j p l t p L P f j Y M p f p fj c z c n y y y y y l y c x p l p l i i Stellenbosch, 27 fev.- March
14 Optimization Mauricie region Category/Parameter Realistic Specific case Sources for data MÉRIS + Harvest allocations + VTM project (FORAC) Same as Realistic + industry Harvest allocation m m 3 Time period 8 8 Planning horizon Two years Two years # of species 11 9 End products Truck types 4 4 Harvest zones 9 12 Stellenbosch, 27 fev.- March


15 Specific case : industry network Parent Site Vallières Commonwealth Plywood PFM Rivière aux rats Westrock John Lewis Saint Roch Saint Georges Commonwealth Plywood Shawinigan Saint Tite Savco Kruger Legend Pulp and paper Sawmilling Veneer OSB pannel Yard Hardwood Softwood Mixed wood Domtar Stellenbosch, 27 fev.- March
16 Results : specific case Profit change ($/m 3 *) Sorting yard /Transport Yard only (no BH) Yard +Routing Site Vallières only + 1,20$ Vallières & Saint Georges + 0,87$ + 1,39$ Vallières & Saint Tite + 0,34$ + 1,63$ Vallières & Rivière aux Rats + 1,02$ + 2,18$ * Total available volume Stellenbosch, 27 fev.- March
17 Results : specific case Profit change ($/m 3 *) Sorting Yard No Routing Routing /Transportation Status quo + 0,11$ Rivière aux Rats + 0,53$ + 0,71$ * Total available volume Stellenbosch, 27 fev.- March
18 Results : Specific Case $/available m 3 $1,20 $1,08 $1,06 $1,00 Revenue increase $0,80 $0,60 $0,40 $0,56 $0,56 $0,20 $ $0,02 $0,17 Rivière aux rats Routing Rivière aux rats & Routing Value variation Volume variation 18
19 Results : Specific Case Category/Scenario Status quo Rivière aux rats Gain ($) Gain ($/available m 3 ) Revenues $ $ $ 1,64 $ Harvesting & Royalties $ $ ( ) $ (0,24) $ Costs Sorting & Production $ $ $ 0,26 $ Transportation $ $ ( ) $ (0,93) $ Yard Implementation $ $ ( ) $ (0,20) $ Inventory $ $ $ 0,00 $ PROFITS $ $ $ 0,53 $ 19
20 Results : Specific Case Category/Scenario Status quo Rivière aux rats & Routing Gain ($) Gain ($/available m 3 ) Revenues $ $ $ 1,62 $ Harvesting & Royalties $ $ ( ) $ (0,24) $ Costs Sorting & Production $ $ $ 0,25 $ Transportation $ $ ( ) $ (0,71) $ Yard Implementation $ $ ( ) $ (0,20) $ Inventory $ $ (5 517) $ (0,00) $ PROFITS $ $ $ 0,71 $ 20
21 Results : specific case Additional volume is obtained Comes from distant sectors and lower value wood Less wood is abandoned in the forest More harvest, more value creation Deliveries from more distant sectors can be more difficult to combine for return trips Sites that can get deliveries from extra heavy loads (such as Rivière aux rats) are favoured For our case study, only make sense if you can extract more value out of each log Stellenbosch, 27 fev.- March

22 Conclusion Results : A means to estimate cost/benefits of sort yard/logistic centre Greater distances and higher hauling costs favour routing, with or without sort yard Most interesting sites in the case study prodived access to extra heavy trucks Next steps: Test more parameters Test different networks configurations Work out the economics Define business model Source: Stellenbosch, 27 fev.- March

23