Forest harvesting while maintaining potential home range core areas for the Fisher
|
|
|
- Ralf Davidson
- 5 years ago
- Views:
Transcription

1 Forest harvesting while maintaining potential home range core areas for the Fisher The crew: Rick Church Matt Niblett Klaus Barber and 9/9/2015 Symposium on Systems Analysis and Forest Resources 1
 Member of the weasel family Larger")
 One of the few predators of porcupines Found in North American forests Prey of eagles, bobcats, and mountain")
2 What is a Fisher? Scientific name is Pekania pennanti (formerly designated as Martes Pennanti) Member of the weasel family Larger than an American marten Eats small game (squirrels, wood rats, eggs, etc.) One of the few predators of porcupines Found in North American forests Prey of eagles, bobcats, and mountain lions Young fishers are prey of adult male fishers Figure from Powell (1981) 1 9/9/2015 Symposium on Systems Analysis and Forest Resources 2
3 The dilemma.. 9/9/2015 Symposium on Systems Analysis and Forest Resources 3
4 an industrial perspective. The study area involves an industrial forest that changed ownership in the late 1990 s One of the Fisher experts has gone on record in saying this area is ranked so low in habitat suitability because it resembles places where fishers are absent rather than being present So, why would this company be concerned? 1 9/9/2015 Symposium on Systems Analysis and Forest Resources 4
5 Conventional wisdom on habitat needs? The fisher requires continuous mature oldgrowth forest. Unfragmented areas should be on the order of square kilometers. But this landscape is fragmented, with a preponderance of younger aged stands 2 9/9/2015 Symposium on Systems Analysis and Forest Resources 5
6 The study area 9/9/2015 Symposium on Systems Analysis and Forest Resources 6


7 The Study Area in California The gray points represent FIA plot data used in Zielinski et al Trinity County 2 9/9/2015 Symposium on Systems Analysis and Forest Resources 7
 FIA Plots 3 9/9/2015 Symposium on Systems Analysis and Forest Resources")
8 Southwest Weaverville Study Area Douglas City Located in Trinity County Study area is approximately 69.5 miles 2 (44,000 acres) FIA Plots 3 9/9/2015 Symposium on Systems Analysis and Forest Resources 8
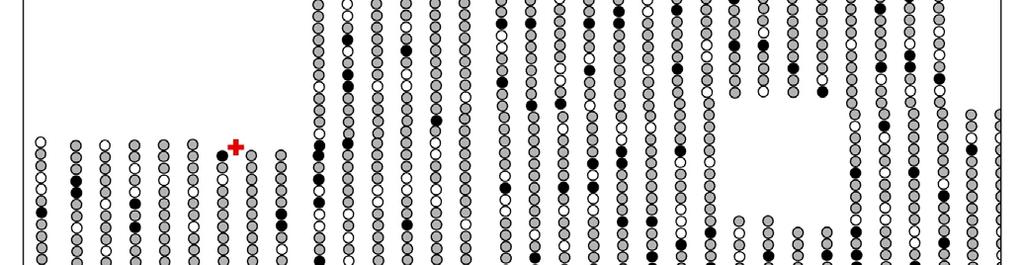
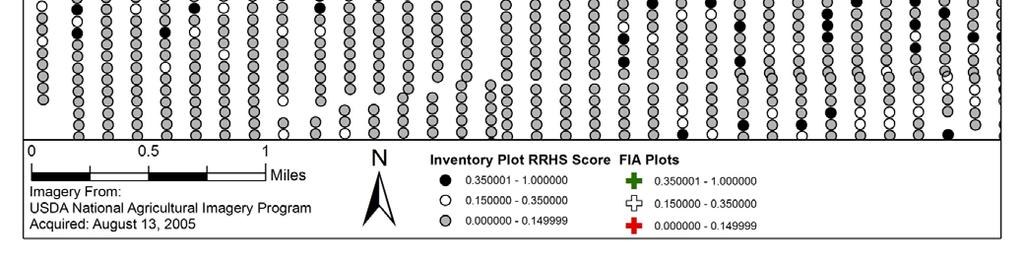
9 Study Area Plot Data 9/9/2015 Symposium on Systems Analysis and Forest Resources 9

10 Study Area Plot Data 9/9/2015 Symposium on Systems Analysis and Forest Resources 10
11 But there s a Fisher Maxwell 3b (75% kernel) 9/9/2015 Symposium on Systems Analysis and Forest Resources 11
12 Monte Carlo Simulation of Kernel Density Estimates Across the Landscape 9/9/2015 Symposium on Systems Analysis and Forest Resources 12
13 Monte Carlo Simulation of Kernel Density Estimates Across the Landscape Median and Mean Canopy cover is high; this is expected. 9/9/2015 Symposium on Systems Analysis and Forest Resources 13
14 Monte Carlo Simulation of Middleton 4 shows that on the average, almost anything else is better!!!! Median and Mean Canopy cover is very low; this is not expected. 9/9/2015 Symposium on Systems Analysis and Forest Resources 14
15 The bottom line: conventional wisdom is wrong Fisher doesn t need continuous, mature to old growth forest How did we find what was statistically significant? Read our paper: Structure of Fisher (Pekania pennant) habitat in a managed forest in an interior northern California coast range forest, Forest Science 61, 2015, What we found was, home range core areas consisted of a mix of stands, based upon a 40 acre habitat units, characterized as: Foraging areas Denning areas Connectivity 9/9/2015 Symposium on Systems Analysis and Forest Resources 15
16 Defining habitat Foraging, denning & connectivity 9/9/2015 Symposium on Systems Analysis and Forest Resources 16
17 Characterizing foraging habitat For a design unit to support foraging activities, at least 7 or more 4 acre plots must have high canopy closure Inventory plot, tracking unit k Design units are clusters/groups of approximately 10 inventory plots for a total size of approximately 40 acres 9/9/
18 Characterizing denning habitat For a design unit to be used in denning, at least two 4 acre plots must have very high canopy closure and contain several old, sizable trees (hardwoods or conifers) as meeting the standards of foraging habitat in order to be considered as denning habitat Inventory plot, tracking unit k Design units are clusters/groups of approximately 10 inventory plots for a total size of approximately 40 acres 9/9/
19 A view of design, harvest, and tracking Design Unit j of approximately 40 acres D7 y jlt 1, if design unit j achieveshabitat levell in time periodt 0, otherwise Harvest Cut Unit i , if harvest unit i is scheduledfor harvest in time period t x it 0, otherwise H9 Inventory plot, tracking unit k 1, if habitat at tracking unit k is at least levell in timeperiod s h kls 0, otherwise When harvest unit H9 is scheduled for harvest, tracking units 41 and 42 are impacted within design unit D7
20 We want to harvest, while Providing a prespecified number of Foraging design units in each decade Denning design units in each decade Providing connectivity among design units meeting habitat requirements No two adjacent cut units can be harvested in the same decade At least one adjacent cut unit is harvested in the subsequent period Harvest activities should be spread out over a rotation cycle of 8 decades, if possible Model: Density based Design to support the fisher while harvesting
21 z jt 1, if design unit j is has supportiveor den habitat as well as Con neighbors 0, if otherwise x it 1, if harvest unit i is scheduledfor harvest in time period t 0, otherwise Maximize Z v i t v it x it Maximize Z c z jt j t As applied to the Maxwell watershed, where Maxwell 3B resides, an approximately 2,900 acre area
22 1) Each harvesting unit can be scheduled at most once during the 8 decade rotation 8 t 1 xit 1 for each i 2) In each decade, no more than 30 twenty-acre harvesting units can be scheduled for harvest in this approximately 2,900 acre planning area or no more than 1/8 of the treatment units in a given decade i x 30 for each t it 3) Evaluate the habitat status of tracking unit k in time period t h klt b klt t s 1 t ( 1 a x ) r a x for each k, l, and t i ik i s s 1 i klst ik is
23 j 4) For a design unit to be considered at least supporting habitat, there must be 7 tracking units within that unit that have foraging habitat 7 y j 1s hk1s k M j for each design unit j and time period t 5) For a design unit to be considered as potential denning habitat, it must be considered to be at least supporting foraging habitat y j 2 s y j1s j for each design unit and each time period t 6) For a design unit to be considered as potential denning habitat, there must be 3 tracking units within that unit that have potential denning habitat as well 3 j y j 2 s hk 2s k M j for each design unit and each time period t
24 j t 7) Track the number of neighbors to design unit that are classified as potential supportive or denning habitat to determine if that unit j is connected to others in the same time period Con j z jt y l 1 8) Design unit cannot be considered connected in time period unless itself is classified as supporting or denning habitat in time period 2 z j y, t 2 l 1 for each design unit and time period for each design unit and time period 9) Adjacent treatment units cannot be harvested in the same time period u jlt C j ult j t j j t t t n x i it p Adj i x pt n i i for each cut unit and time period t
25 10) At least one adjacent treatment must follow a harvest in the subsequent time period t 1 xit x pt 1 p Adj i each design unit and time period j t 11) Ensure that a minimum number of foraging units exist in each time period t j y jlt Min lt l 1 each habitat level, and time period t 12) Ensure that a minimum number of denning units exist in each time period t j y jlt Min lt j 2 for each design unit and habitat level, and time period l t
26 An application to one of the watersheds in southwest Weaverville

27 Southwest Weaverville Holdings Maxwell watershed
 Maxwell")
28 675 tracking units (4 acre inventory plots) Maxwell watershed

29 Centers of design units Cut unit boundaries 66 design units, 240 cut units and 657 tracking units

30 An optimal solution.. Notice there is a delay in most of the harvesting until the third decade!
31 Summary Fisher habitat, although not requiring all old mature stands, does require a matrix of stands providing canopy cover to 70% to 80% of the area Old, sizable trees must be found scattered in at least 20 30% of the area considered to be denning habitat Connectivity is important across those areas where habitat is maintained or in transition A density based design model has been developed and applied to one watershed preliminary solution suggests that exiting stands and existing fragmentation will delay sizable amounts of harvesting for 2 to 3 decades so that a mix of foraging and denning habitat can be maintained in each decade.
32
33
34 Backup slides follow
35 The problem at hand How do you characterize an area that is suitable for a species habitat? How would you plan so that past actions, like harvesting, can continue and at the same time protect targeted species? With the two questions above in mind, let s direct our attention to the fisher 1 9/9/

36 Study Area Plot Characterization 9/9/
37 Monte Carlo Analysis of the Average and Median Landscape Attributes Our Simulation approach is as follows: 1. Generate a number (N >> nsim) random uniform points in the study area. 2. Erode the points distance r from the study area boundary, where r is the circumradius of the kernel shape. From the remaining eroded points set select nsim points. This step ensures that the shifted, rotated shapes will fall mostly within the study region. 3. Generate a random rotation of the 75% kernels between 0 and 2π. 4. Shift and rotate the kernel shape using the information from steps 2 and For each shifted and rotated kernel, identify the habitat plots inside the shape and store a summary (mean and median) of the characteristic in the subset of plots 6. Calculate the Monte Carlo p value by finding the proportion of simulated values that are as high or higher than the observed value. 9/9/
38 Monte Carlo Simulation of Kernel Density Estimates Across the Landscape Median and Mean Canopy cover is high; this is expected. 9/9/
39 Monte Carlo Simulation of Kernel Density Estimates Across the Landscape Median and Mean Canopy cover is high; this is expected. 9/9/
40 Monte Carlo Simulation of Kernel Density Estimates Across the Landscape Median and Mean Canopy cover is fairly high; this is expected. 9/9/