Ex-Ante Carbon-balance Tool (EX-ACT)
|
|
|
- Magdalene McKinney
- 5 years ago
- Views:
Transcription


1 Ex-Ante Carbon-balance Tool (EX-ACT) QUICK GUIDANCE [PHOTO]
2
3 Ex-Ante Carbon-balance Tool (EX-ACT) QUICK GUIDANCE by Uwe Grewer, Louis Bockel, Laure-Sophie Schiettecatte and Martial Bernoux Food and Agriculture Organization of the United Nations Rome, 2017
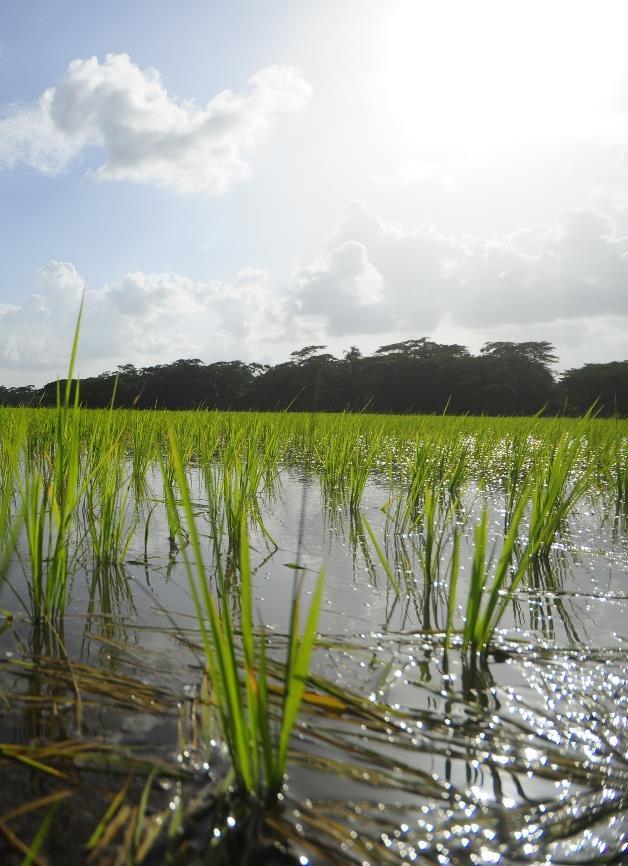
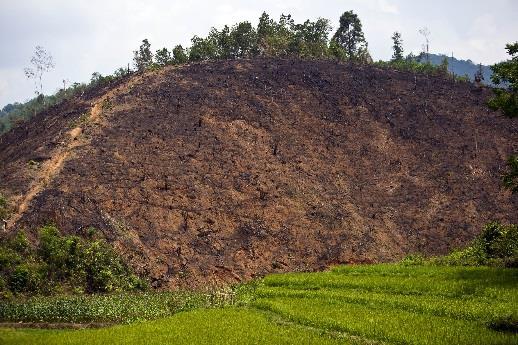
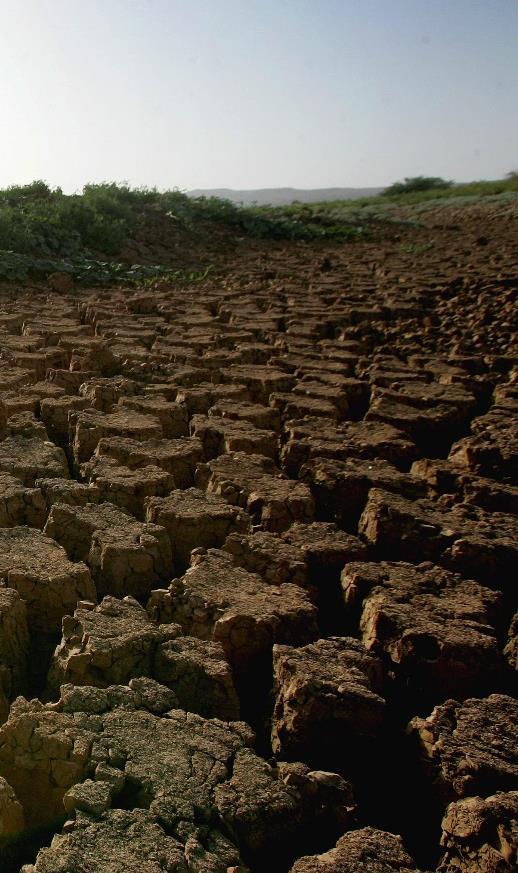
4 Cover photos: FAO/Munir Uz Zaman FAO/Olivier Asselin FAO/Joan Manuel Baliellas FAO/Giulio Napolitano The designations employed and the presentation of material in this information product do not imply the expression of any opinion whatsoever on the part of the Food and Agriculture Organization of the United Nations (FAO) concerning the legal or development status of any country, territory, city or area or of its authorities, or concerning the delimitation of its frontiers or boundaries. The mention of specific companies or products of manufacturers, whether or not these have been patented, does not imply that these have been endorsed or recommended by FAO in preference to others of a similar nature that are not mentioned. The views expressed in this information product are those of the author(s) and do not necessarily reflect the views or policies of FAO. FAO, 2017 FAO encourages the use, reproduction and dissemination of material in this information product. Except where otherwise indicated, material may be copied, downloaded and printed for private study, research and teaching purposes, or for use in non-commercial products or services, provided that appropriate acknowledgement of FAO as the source and copyright holder is given and that FAO s endorsement of users views, products or services is not implied in any way. All requests for translation and adaptation rights, and for resale and other commercial use rights should be made via or addressed to copyright@fao.org. FAO information products are available on the FAO website ( and can be purchased through publications-sales@fao.org.
5 Food and Agriculture Organization of the United Nations Rome, 2017
6
7 Contents Acknowledgments... v Acronyms... vi Executive summary... vii Section A: Quick guidance for decision makers Introduction Climate change mitigation in agriculture, forestry and fisheries... 1 a) Why target GHG mitigation in agriculture, forestry and fisheries investment planning?... 1 b) GHG accounting tools in agriculture The EX-Ante Carbon-balance Tool... 2 a) What is EX-ACT?... 2 b) Tagert users... 2 c) Basic structure of EX-ACT... 3 d) Scenario building EX-ACT results... 5 a) Interpretation of the results... 5 b) A case study from Tanzania... 6 c) Using the results... 7 Section B: Quick guidance for tool users Methodology EX-ACT data requirements... 9 a) Identifying the relevant EX-ACT modules for your project... 9 b) Overview of data requirements Building the baseline scenario Brief guide to entering data a) Where to download and how to start b) Navigation bar c) EX-ACT colour codes d) Description Module e) Data entry in the topic modules References iii
8 Figures Figure 1: Visualising the development scenarios used in EX-ACT... 4 Figure 2: The final carbon-balance... 5 Figure 3: Main EX-ACT results... 5 Figure 4: Exemplary results of an EX-ACT appraisal... 6 Figure 5: Three baseline methodologies for creating a baseline scenario Figure 6: EX-ACT navigation bar with the eight modules (green boxes) Figure 7: EX-ACT colour codes Figure 8: The Description Module Figure 9: Deforestation (Land Use Change Module) Figure 10: Tier 2 specifications for deforestation Tables Table 1: Some practical principles for the easy use of EX-ACT... 3 Table 2: break down of the smaller and up-scaled watershed components... 7 Table 3: Budget and carbon-balance of the two scenarios... 7 Table 4: Checklist for identifying project relevant EX-ACT modules Table 5: Overview of Tier 1 activity data that can be accommodated in EX-ACT (next page) iv
9 Acknowledgments This Quick Guidance was prepared by Uwe Grewer, Louis Bockel and Laure-Sophie Schiettecatte from the Agriculture Development Economics Division (ESA) of FAO and Martial Bernoux from Climate and Environment Division (FAO) & the Institut de Recherche pour le Développement (IRD). Authors acknowledge Oscar Lozada for revising the document v
10 Acronyms AFOLU CSA EX-ACT FUI GHG IFI IPCC FAO tco 2-e UNFCCC Agriculture Forestry and Other Land Uses Climate Smart Agriculture EX-Ante Carbon-balance Tool Fuel Use Intensity GreenHouse Gas International Financial Institution Intergovernmental Panel on Climate Change Food and Agriculture Organization of the United Nations tonne of CO 2 equivalents United Nations Framework Convention on Climate Change vi
11 Executive summary This Quick Guidance material provides the reader with an overview and explanation of the methodology, data requirements, application and final use of the Ex-Ante Carbon-balance Tool (EX-ACT). It complements the more comprehensive EX-ACT User Manual that is designed to equip users with an independent and proficient understanding in the use of the tool. The Quick Guidance is composed of two sections. Section A, Guide for decision makers (10 pp.), discusses the rationale behind the tool, its utilization and its results. Section B, Guide for tool users (8 pp.), introduces the more technical aspects of data collection, data entry and methodology. The Ex-Ante Carbon-balance Tool is an appraisal system developed by FAO providing ex-ante estimates of the impact of agriculture, forestry and fishery development projects, programmes and policies on the carbon-balance. The carbon-balance is defined as the net balance of all greenhouse gasses (GHGs), expressed in carbon dioxide (CO 2) equivalents, that were emitted or sequestered due to project implementation as compared to a businessas-usual scenario. EX-ACT is a land-based accounting system, estimating carbon stock changes (i.e. emissions or sinks of CO 2) as well as GHG emissions per unit of land, expressed in equivalent tonnes of CO 2 per hectare and year. The tool helps project designers to estimate and prioritize project activities with the greatest economic benefit and potential for climate change mitigation. This GHG mitigation potential may also be used for economic analyses and for allocating additional project funds. The tool can be applied on a wide range of development projects in all Agriculture, Forestry and Other Land Use (AFOLU) sub-sectors, as well as other projects concerned with climate change mitigation, watershed development, production intensification, food security, livestock, forest management or land use change. Furthermore, it is cost effective, requires a comparatively small amount of data, and is equipped with useful resources such as tables, maps and FAOSTAT data. While EX-ACT is mostly used at project level it can easily be scaled up to the programme or sector level and can also be used for policy analysis. EX-ACT is based on Microsoft Excel (without macros) and is freely available from the FAO website. EX-ACT Website: Free Tool Access: EX-ACT User Manual & EX-ACT Quick Guidance: vii
12
13 Section A: Quick guidance for decision makers 1. Introduction This Quick Guidance material is composed of two sections: The first is Section A, Quick guidance for Decision Makers (10 pp.), which discusses the rationale behind the tool, its utilization and its results. The following Section B, Quick Guidance for Tool Users (8 pp.), introduces more technical aspects of methodology data collection and data entry. Quick Guidance for Decision Makers Chapter 2 discusses the importance of targeting climate change mitigation in agricultural investment planning. It presents central facts to demonstrate the significance of agriculture sectors (e.g. crops, livestock, forestry and fisheries) as sources of carbon emissions and the potential therein for climate change mitigation. Subsequently Chapter 3 briefly presents the Ex-Ante Carbon-balance Tool in its most essential characteristics. Chapter 4 then describes the types of results obtained by EX-ACT and demonstrates how to use them for designing projects and prioritizing selected investments. Chapter 5 summarises the advantages of engaging in carbon-balance appraisal and of using the EX-ACT tool. Quick Guidance for Tool Users Chapter 6 then describes the methodology employed by EX-ACT, followed by a description of its primary data requirements (Chapter 7) and the process for building a baseline scenario (Chapter 8). Lastly, users are provided with a short guide to entering data (Chapter 9). 2. Climate change mitigation in agriculture, forestry and fisheries a) Why target GHG mitigation in agriculture, forestry and fisheries investment planning? Agriculture, Forestry and Other Land Uses (AFOLU) contribute around 25 percent of global anthropogenic emissions, primarily through deforestation, livestock emissions and soil and nutrient management. Annual GHG emissions (mainly CH 4 and N 2O) from agricultural production in were estimated at about GtCO 2-e per year, or percent of global anthropogenic emissions. Similarly GHG emissions from forestry and land-use change activities account for about tco 2-e per year, or 9-11 percent of total anthropogenic emissions (Smith et al., 2014). Furthermore, recent attention has focused on the high rates of annual carbon sequestration in vegetated coastal ecosystems (such as mangroves, marshes and seagrasses) that may be lost through habitat conversion. Residing mostly in sediments, this blue carbon can be released to the atmosphere when these ecosystems are disturbed (i.e. converted or degraded). If these emissions were accounted for, it is estimated that global deforestation would increase by up to 19 percent (Pendelton et al., 2012). The fishery sector also makes a minor, but still significant, contribution to global GHG emissions. The global fishing fleet is estimated to release about 0.13 GtCO 2-e per year during the catch phase (FAO, 2012). Currently, one third of global anthropogenic N 2O emissions are generated by aquatic systems, and by 2030 nearly 6 percent of all anthropogenic N 2O-N emission are anticipated to originate in aquaculture, at its current annual growth rate (Hu et al., 2012). Globally, the agricultural sector is the largest producer of anthropogenic non-co 2 emissions, notably CH 4 from cattle, rice plantations, and wetlands, and N 2O from fertilizers and fish-fed farming systems. The scale of global emissions from agriculture, fisheries, land use change and land conversion for aquaculture (e.g. conversion of mangrove swamps) are increasing as a result of population growth, growing consumption of animal proteins and dairy products, and the rising use of nitrogenous fertilizers. Nevertheless, the potential for climate change mitigation in agriculture is high. The IPCC estimates the global technical mitigation potential of agriculture and forestry to be between 7.18 and GtCO 2-e per year at carbon prices up to US$ 100 per tonne of CO 2-e, about a third of which can be achieved at prices up to US$ 20 (Smith et al., 2014). Thus mitigation in agriculture and forestry is a cost effective mitigation strategy when 1
14 compared with non-agriculture sectors. Within agriculture, the crop and livestock subsectors have been identified as the most cost effective areas for abatement (Smith et al., 2014). Evidence suggests that climate change will lead to decreases in the efficiency and resilience of global agricultural production 1. This will occur in tandem with an increasing demand from a growing population. Thus agriculture is not only a cause of climate change, but also heavily impacted by it. When considering their overall economic importance as well, agricultural systems are directly linked to food security and the livelihoods of vulnerable people more than any other sector. Therefore, if targeted appropriately, actions that promote climate change mitigation have the potential to benefit both climate adaptation and food security. The consideration of all these elements constitutes the paradigm of Climate Smart Agriculture (CSA) (FAO, 2013). The above reasons demonstrate the importance of striving for climate change mitigation in agriculture. Structural planning decisions in AFOLU, coastal wetlands and fishery projects, and programme and policy design are all scenarios where is essential that climate change mitigation objectives complement other development goals. b) GHG accounting tools in agriculture Today, decision makers have a wide range of GHG and climate change mitigation tools at their disposal. Each one has different objectives (raising awareness, national reporting, (ex-ante) project evaluation, etc.) and are varied in their GHGs and agricultural activities and are adapted to different geographical scales (farm, landscape, project, national scale, etc). EX-ACT aims to provide ex-ante project evaluations, requiring relatively little data and few cost requirements in order to suit the cost-effective investment project design processes that are commonplace in agricultural planning. The tool is able to accommodate location specificity (Tier 2) and so exceeds pure Tier 1 functionality. EX- ACT can also accommodate all agricultural sub-sectors, a wide range of agricultural management practices and all types of GHGs and emission processes in both the AFOLU and fishery sectors. Nevertheless each GHG tool possesses certain unique advantages. If you are searching for a GHG tool with functionalities other than those described here, please consult the online multi-criteria selector for GHG tools in agriculture, available here: 3. The EX-Ante Carbon-balance Tool a) What is EX-ACT? The EX-Ante Carbon-balance Tool (EX-ACT) is aimed at providing ex-ante estimations of the impact of development programmes, projects and policies in the AFOLU sector on GHG emissions from carbon stock changes and/or carbon changes rate, constituting the carbon-balance. EX-ACT is a land-based accounting system, measuring GHG impacts per unit of land, expressed in tco 2-e per ha and year. A selected functionality accounting for the carbon-balance per unit of produce (carbon footprint) is also available. b) Tagert users International Financial Institutions (IFIs) commit themselves increasingly to structurally consider the impact of projects and programmes on the GHG-balance as one directly targeted objective of their investment decisions. The identification of investments that are climate smart while leading to equally high socio-economic outcomes, requires an accepted methodology and practical tools for project and programme level GHG accounting. EX-ACT targets investment planners and project designers in IFIs and national planning institutions that aim at estimating the GHG-balance of investment proposals in the AFOLU sectors. The main target users should be involved during the project design stage and pursue the objective of aligning ex-ante programme and project documents in accordance with the results obtained from the EX-ACT appraisal. 1 Cf. Gornall (2010), IPCC (2007a), Beddington et al., (2012b), HLPE (2012a), Thornton et al., (2012). 2
15 c) Basic structure of EX-ACT EX-ACT is an accounting tool consisting of a set of eight linked Microsoft Excel sheets, covering different activity areas of the AFOLU sector. They allow users to specify information concerning land-use change activities and agricultural management practices, and a few geographical, climatic and agro-ecological variables. The eight modules are: 1. General description of the project (Geographic area, climate and soil characteristics, duration of the project) 2. Land use change (Deforestation, afforestation/reforestation, non-forest LUC) 3. Crop production and management (Agronomic practices, tillage practices, water & nutrient management, manure application) 4. Grassland and livestock (Grassland management practices, livestock feeding practices) 5. Land degradation (Forest degradation, drainage of organic soils, peat extraction) 6. Coastal wetlands (Extraction/excavation, drainage and restoration in coastal wetlands) 7. Inputs and further investments (Fertilizers and agro-chemical use, fuel consumption, electricity use, infrastructure establishment) 8. Fishery & aquaculture (Marine capture and associated fuel consumption, ice production, aquaculture production and emissions from feed) The wide coverage of these eight modules ensures that EX-ACT is capable of analysing a wide range of agricultural, forestry and fishery development projects, including: - Livestock and aquaculture development - Crop production intensification - Food security - Forest and coastal wetlands protection and management - Watershed development - Land and coastal wetlands rehabilitation - Climate change mitigation (forestry, etc.) - Management activities within coastal wetlands - Fishery management Depending on the project, data collection and model completion is necessary only in the modules relevant to the project. Thereby data is only required from the focal areas of the project. Indeed, rather than choosing modules according to project type, they should be chosen in regards to project impacts, i.e. what is affected by the project. This is summarized in table 1. Table 1: Some practical principles for the easy use of EX-ACT Only modules that are directly impacted by project activities have to be filled. Sophisticated data is only required for the focal areas of the project. It is normal for many data entry cells to not be used and remain empty. Information is entered on changes occurring With Project vis a vis Without Project situation. 3
 Scenario building Ex-ante project evaluation compares the impacts of a planned intervention to the business-as-usual scenario.")
16 This flexibility allows for adequate consideration of multi-faceted projects and encourages project designers to consider possible impacts on non-target areas, e.g. increased pressure for deforestation or grassland degradation. d) Scenario building Ex-ante project evaluation compares the impacts of a planned intervention to the business-as-usual scenario. Thus for each of the variables identified as relevant to the project, data is required for the following three situations: The baseline situation The With-Project scenario The Without-Project scenario (business-as-usual) Thus the data requirements of EX-ACT are very similar to the usual data required for ex-ante economic project analyses. Figure 1 below illustrates the essential differentiation that is crucial for the correct understanding of EX- ACT and its application: Thus x o denotes the initial situation of land use and management practices in the project area, (e.g. the amount of cropland managed under improved nutrient management). Intervention due to the project (With-Project scenario) will result in an increase in the area that benefits from improved management, to x 2. In the absence of project intervention (Without-Project scenario) this increase will likely be smaller only x 1 hectares will benefit from improved management (see Baseline scenario building). Thus EX-ACT differentiates between two time periods. The first is the implementation phase which defines the time period in which active project activities are carried out. This phase runs from t 0 until t 1. Thus the period covered by the analysis does not necessarily end with the termination of the active project intervention. Once an equilibrium in land use and agricultural practices is reached at t 1, further changes may occur due to the prior intervention, for instance in soil carbon content or in biomass. This period is defined as the capitalization phase and lasts from t 1 until t 2. The difference in activity data between the With- and Without-Project scenarios serves as the input data for calculating the carbon-balance of the project. Figure 1: Visualising the development scenarios used in EX-ACT 4

17 4. EX-ACT results a) Interpretation of the results All agro-ecological conditions and activity data specified for each of the chosen EX-ACT modules are used in the calculation of GHG emissions and carbon stock changes. The comparison of net emissions reveals the difference between the With- and Without-Project scenarios. This difference is then used to determine the overall carbon-balance following project implementation (see Figure 2). The main results EX-ACT results are shown in the screenshot below (Figure 3). The example project is designed for an area that experiences strong deforestation and land degradation. The project is foreseen to lower the pace of deforestation and other land use changes, while establishing agroforestry and increasing productivity through increased use of fertilizers. The EX-ACT results section may be interpreted as follows: 5 Figure 2: The final carbon-balance GHG emissions Emissions and sinks without project Final carbon balance Emissions and sinks with project Implementation phase Capitalization phase Time Overall gross results: Users are first presented with the gross emission and sequestration results of the Without-project scenario (left column) and With-project scenario (right column). The values are given in tonnes of CO 2 equivalents (tco 2-e) as totalled over the entire period of analysis, but also per hectare and per hectare and year. In the example given in Figure 3 the Without-project scenario results in a net carbon flux (combining the positive values from GHG emissions and the negative values from carbon sequestration) of up to 4.9 million tco 2-e. This translates as 246 tco 2-e per hectare over the full timescale of the analysis, or as 12.3 tco 2-e per hectare per year. In this example both the With-project and Without-project scenarios are, overall, sources ofof GHG emissions. However as the With-project scenario only has a net carbon flux of tco 2-e, implementation of the project will have considerably more favourable carbon impact than the Withoutproject scenario. Overall carbon-balance: Comparing the gross results of the With- and Without-project scenarios demonstrates the difference that may be achieved through the project. This is referred to as the project s carbon-balance. In the above example the project accounts for a total of tco 2-e of avoided emissions or increased carbon sequestration over the 20 year timescale of the analysis. This is equivalent to -210 tco 2-e per hectare of reduced emissions over the full timescale or tco 2-e per hectare annually. Gross results and carbon-balance by module: These columns in the table allow the gross results and carbonbalance to be broken down by module. Figure 3: Main EX-ACT results Components of the project Gross fluxes Without With Balance All GHG in tco2eq Positive = source / negative = sink Land use changes Deforestation 3,740, ,117-3,259,576 Afforestation -61,922-59,994 1,928 Other LUC 398,762-51, ,639 Agriculture Annual 55,507-27,852-83,359 Perennial -7, , ,467 Rice 44,898 17,973-26,925 Grassland & Livestocks Grassland 121, , ,286 Livestocks 12,563 9,699-2,864 Degradation & Management 499, , ,711 Coastal wetlands Inputs & Investments 162, , ,582 Fishery & Aquaculture Total 4,967, ,859-4,248,317 Per hectare Per hectare per year
 and the rehabilitation of degraded grassland (-113 685 tco 2-e).")
18 This is an essential functionality to identify those practices and activities that are the strongest sources of emissions or the most important carbon sinks. In the example in Figure 3, to the primary sequesters of carbon are the establishment of perennial crop land ( tco 2-e) and the rehabilitation of degraded grassland ( tco 2-e). The leading causes of carbon loss and GHG emissions are the use of fertilizers and other inputs ( tco 2-e) and ongoing deforestation ( tco 2-e). However it should be noted that the greatest contributors of gross emissions are not necessarily the strongest determinants of the carbon-balance. For instance, the most signficicant factor that leads to the overall favourable carbon-balance of the With-project scenario is the considerable reduction in the rate of deforestation ( tco 2-e), which is alone responsible for more than 75 percent of the project s carbon-balance. After deforestation, the most significant activities contributing to the favourable carbon-balance of the project are the non-forest land use change activities ( tco 2-e) and the rehabilitation of degraded land ( tco 2-e). b) A case study from Tanzania EX-ACT allows project designer to prioritize components that hold the greatest climate change mitigation potential, while allowing them to deliver the same development goals. The Accelerated Food Security Project (FAO/World Bank) consists of components that bear antagonistic impacts on GHGs. On the one hand the project introduces greater use of fertilizers which contribute to emissions, whilst on the other hand encouraging and incentivising sustainable land management practices, such as the incorporation of crop residues. An EX-ACT analysis was carried out to clarify the overall dimension of these opposing effects in order to determine whether the project classifies as carbon sink or a carbon source. Figure 4: Exemplary results of an EX-ACT appraisal Figure 4 above shows that increased fertilizer use and the expansion of flooded rice systems ( Irrigated rice ), which are essential components of the project s food security objectives, both lead to substantial increases in GHG emissions. The With-Project scenario (shown in green) shows that with project implementation, the irrigated rice systems emit 3.2 million tco 2-e and agricultural inputs cause 5.3 million tco 2-e. Thus the area remains a net source of carbon emissions. The enhanced land and crop management practices, which were identified as favourable technological investments for intensified systems and are not expected to compromise on yields, are instead carbon sinks of -0.4 million tco 2-e. Thus the carbon emitted from source activities is considerably greater than the carbon sequestered in sink activities. Although certain With-project scenario components result in a significant increase in GHG emissions, this scenario must be compared to the baseline scenario (shown in blue), i.e. the continuation of prevailing agricultural practices, such as burning of crop residues. A comparison of the With- and Without-Project scenarios reveals that implementation of this project would lead to a reduction in GHG emissions as compared to the business-as-usual scenario. Over the full 20 year timescale of the analysis, the project results in a carbon-balance of -5.6 million tco 2-e, equal to million tco 2-e per hectare per year. This project analysis used the EX-ACT modules: Description, Crop Production and Inputs. 6
19 c) Using the results Whilst EX-ACT may be used for analysis of completed project proposals, the tool is also often used at a stage when still several project options are being considered for implementation. To illustrate, consider this example in which the Irrigation and Watershed Development Project in Madagascar was appraised. The two different designs of the watershed component were compared: one smaller watershed component focussing on the diffusion of irrigation infrastructure, and one larger watershed component with a greater focus on natural conservation aspects. Specifically, the smaller watershed option would cover ha, while the up-scaled project would cover ha and support the afforestation, reduced deforestation and agroforestry components. These options are broken down in Table 2. Table 2: break down of the smaller and up-scaled watershed components Areas Small watershed component (ha) Up-scaled watershed component (ha) Afforested areas Avoided deforestation Improved pasture Agroforestry Total area of watershed component The incremental improvements under the up-scaled scenario will require additional funding. These costs are estimated at: US$1500 per ha reforested area, US$300 per ha of deforestation avoided, US$400 per ha of improved pasture, US$1 000 per ha of agroforestry. In total the additional watershed components are estimated to require funding of US$47.9 million. The total project budget for the project would therefore increase to US$83 million (an increase of 103 percent). By doubling the budget of the project, the resultant benefits in terms of GHG mitigation rise from 2.4 million tco 2-e to 12.4 million tco 2-e over the 20 years of analysis (see Table 3 below). Therefore, while the costs are doubled, the benefits are in fact multiplied by a factor of six. Table 3: Budget and carbon-balance of the two scenarios Areas Small watershed component Surface area ha Budget (US$ million) Carbon-balance (million tco 2-e) Carbon-balance per ha (tco 2-e, 20 years) Carbon-balance per ha/yr (tco 2-e) Total area of watershed component Up-scaled watershed component Surface area ha Thus EX-ACT can be used in this way to compare different project scenarios for their mitigation benefits. However this mitigation analysis should only complement other performance indicators, such as socio-economic analyses, and should not replace them. Investment decisions should then be taken in joint consultation of the different development goals. It should be noted that not all agricultural and forestry development projects need necessarily result in a positive carbon-balance. It would be a misapplication of EX-ACT and related tools if the project proposal manipulated arbitrarily to transform it from a carbon source to a carbon. The use of EX-ACT should instead be integrated with the use of other performance indicators. The tool aims to identify mitigation potential where it is most cost-effective and co-beneficial to a wide range of project outcomes. Even for situations in which project emissions are similar to the business-as-usual scenario, EX-ACT helps to 7
20 identify the practices that would reduce emission intensity while respecting the needs of other development goals. Such advantages may include: 1. Allowing project designers to make informed decisions of their project options to better target their mitigation objectives. 2. Providing the ability to prove to third party stakeholders that mitigation objectives have been targeted (in the design stage) and achieved (in the monitoring stage). 3. Allowing the allocation of additional funds for climate change mitigation. Building on this, the following lists the main reasons why EX-ACT is an instrumental and effective tool for conducting a carbon-balance appraisal. Comprehensive appraisal: EX-ACT offers the advantage of an integrated analysis of GHGs, through the inclusion of a wide range of activities from the AFOLU and fishery sectors. It can account for the carbon-balance of activities of deforestation, afforestation and reforestation, land use change and conservation, land degradation, annual crop production, agroforestry, production of perennial crops, irrigated rice, livestock and aquaculture production, management activities within coastal wetlands and fish capture at sea. The tool also comprehensively covers all five carbon pools: above-ground biomass, below-ground biomass, dead wood, litter, and soil carbon. It considers CO 2, CH 4 and N 2O as sources and associated greenhouse gases from (1) biomass growth and removal, (2) site preparation (tillage, burning), (3) use of mechanization and agro-chemicals (fuel, fertilization, liming and irrigation), (4) exported harvested wood products, (5) for peatlands drainage, extraction of peat, rewetting and fires of organic soils, (6) extraction, drainage and rewetting of coastal wetlands, (7) fuel consumption and energy inputs in the fishery sector. It also considers CH 4 from rice and CH 4 and N 2O from livestock and aquaculture production and management. Landscape and scaling up: EX-ACT is well-suited to assessing project activities at a range of scales. While the tool works best at project level, given that only one dominant soil and climate type can be considered at a time, it can nonetheless be easily up-scaled to regional and national scales. In such cases, sensitivity analyses of soil and climate conditions or separate EX-ACT analyses conducted by region may be undertaken to supplement the usual appraisal process and ensure precise results. The tool has already been used in this way to analyze national agricultural programs and policies in Nigeria and Morocco, product carbon footprint studies in Madagascar as well as various ARD projects. Data Flexibility: EX-ACT offers a high level of data flexibility. It allows users to choose between site-specific data and default values from the IPCC that are furnished by EX-ACT, based on data availability and the desired level of precision. The tool also provides a wide range of resources (such as tables, maps and FAOSTAT) which can direct the user to the required information. Default values can be chosen from drop-down menus if no project-specific data is available. Long-term projection: When compared with similar tools EX-ACT can handle greater timescale projections and takes into account the saturation effects concerning soil carbon content and vegetation growth in forests. Cost-efficient planning tool: EX-ACT is a tool that can be used quickly and at low cost. To facilitate cost effective data collection, the project appraisal team should be coordinated with the teams in the target country, or to other country stakeholders. Specifically, a workshop between the EX-ACT team and the national project team in charge of the appraisal, introducing the technical aspects of the tool and covering project-specific data assessment and the scenario building process, will equip the appraisal team with sufficient data to carry out the full appraisal process. Interactive and participatory: The EX-ACT appraisal process is interactive and participatory, capable of strengthening the overall project design process, especially when training and workshops (for project teams, government counterparts, and other stakeholders) are included in the process. This has already proven useful during EX-ACT appraisals in Russia, India, and Niger. The tool also allows factors that hinder the adoption of more carbon-neutral activities (or adjustments to proposed activities) to be identified. This may aid the discussion on how to create incentives and institutional conditions to promote their uptake (such as payments for environmental services). 8
21 Simulation and scenario building tool: EX-ACT encourages stakeholders to actively engage in scenario building exercises that compare different project and development options over time. These could, for instance, involve simulation and modelling. These exercises allow reflection on the long-term goals of the project and help to adjust initial assumptions to suit their feasibility. Section B: Quick guidance for tool users 5. Methodology EX-ACT is a land-based accounting system that relates activity data from the (AFOLU and the fishery sectors to: Estimated values of the five carbon pools: above ground biomass, below ground biomass, dead wood, litter and soil organic carbon; Estimated coefficients of CH 4, N 2O and selected other CO 2 emissions. It is through this that EX-ACT derives values of carbon stocks, stock changes as well as CH 4, N 2O and CO 2 emissions, which are the basis of the overall carbon-balance. EX-ACT was developed using the IPCC 2006 Guidelines for National Greenhouse Gas Inventories (IPCC, 2006) and augmented with the wetlands supplement (IPCC-WS, 2014). These equip EX-ACT with recognized default values for emission factors and carbon values the so-called Tier 1 level of precision. EX-ACT is also based on Chapter 8 of the Fourth Assessment Report from Working Group III of the IPCC (Smith et al., 2007) to account for more specific mitigation options not covered in IPCC Other required coefficients are taken from published reviews or international databases. For instance, GHG emission values for farm operations, transportation of inputs, and irrigation systems implementation are derived from Lal (2004). Electricity emission factors are based on data from the International Energy Agency (2013). In the fishery sector, fuel use intensity (FUI) data from the capture phase of target species at sea are taken from Parker & Tyedmers (2014). Each tier of analysis represents a level of methodological complexity that is used to estimate GHG emissions, according to the definitions in IPCC Tier 1 methods rely on default values and entail less complexity. Tier 2 methods require region-specific carbon stock values and emission coefficients, demanding higher data requirements but offering higher precision. Whilst users may use the Tier 1 default values provided, EX-ACT encourages users to substitute these values for more location-specific Tier 2 data to improve the accuracy of the analysis. The process for procuring and entering Tier 2 data is discussed briefly in this Quick Guidance and in more detail in the User Manual. 6. EX-ACT data requirements a) Identifying the relevant EX-ACT modules for your project In this section we summarise the types of data required by EX-ACT. As discussed previously, users need only to collect data from those topic modules that are altered in some fashion by their project. In any one module, Tier 1 data can be supplemented with Tier 2 data to increase the regional specificity and confidence level of the results. EX-ACT does not require a full inventory of all land-use types and agricultural practices used within the project area, but is instead concerned with all land areas and management activities that would be altered by implementation of the project. Therefore data is required for all areas in which change is observed between initiation of the project and the end of the capitalization phase, as well as for all areas in which such alterations are actively prevented by the project (e.g. reduced deforestation). Table 4 below provides a check-list to help users determine which modules are relevant to their project. 9
22 Table 4: Checklist for identifying project relevant EX-ACT modules Positive (sink) Carbon-Balance Impact EX-ACT modules to fill Project Intervention Main Impact area Yes No A Reduced CO 2 emissions A1 Reduction in rate of deforestation Land Use Change A2 Reduction in forest degradation Management A3 Adoption of improved cropland management Cropland A4 Introduction of renewable energy and energy saving technologies Inputs & Investments A5 Improved management at sea decreasing the FUI Fishery B Reduced emissions of non CO 2 gas and off site CO 2 B1 Improved animal production Livestock B2 Improved management of livestock waste Livestock B3 More efficient management of irrigation water in rice Cropland B4 Improved management of peatland Management (Peatland) B5 Improved nutrient management Crop, Livestock C Carbon sequestration C1 Conservation farming practices Cropland C2 Improved forest management practices Land Use Change C3 Afforestation and reforestation Land Use Change C4 Adoption of agroforestry Cropland C5 Improved grassland and peatland management Grassland, Peatland C6 Restoration of degraded land Management C7 Rewetting of coastal wetlands Coastal Wetlands D Increased emissions of CO 2, non-co 2 and offsite D1 Increased livestock and aquaculture production Livestock, aquaculture Negative (source) D2 Drainage, extraction, rewetting and fire in peatlands Peatland D3 Increased irrigated rice production Cropland D4 Increased fertilizer use and over-fertilization Inputs & Investments D5 Production, transportation, storage and transfer of agricultural chemicals Inputs & Investments D6 Increased electricity and fuel consumptions Inputs & Investments D7 Installation of irrigation systems Inputs & Investments D8 Building and infrastructures Inputs & Investments E Decreased carbon stock E1 Increased deforestation & timber logging Land Use Change E2 Increased land degradation (forest, croplands, grassland, peatland, coastal wetlands) Land Use Change, peatland, coastal wetland E3 Cropland expansion Land use change E4 Residue burning and deep tillage Cropland E5 Extraction and drainage in wetlands (peatlands and coastal) Coastal Wetlands b) Overview of data requirements Once the relevant modules have been identified, users may proceed with data collection. Tier 1 data are often easy to procure for project managers and are part of the standard information available in project appraisal documents. They concern a wide range of land-use change activities and agricultural management practices, but comparatively few geographical, climatic and agro-ecological variables. A comprehensive list of all Tier 1 data requirements is given in Table 5 below. 10
23 Tier 2 data consists of location-specific variables that provide specific carbon content and stock changes for all five carbon pools, as well as the emission factors for selected practices. All Tier 2 data requirements that can be used in EX-ACT are listed in full in the annex of the User Manual. Below are a few key examples: Above and below ground biomass levels and changes for forestland. Soil carbon content. Rates of soil carbon sequestration on various land uses. Amount of biomass burnt during land conversion and crop residue management. N 2O and CH 4 emissions from manure management. N 2O, CH 4, CO and off-site CO 2 emissions from drainage, rewetting, peat extraction and fire in peatlands. CO 2 and CH 4 emissions from coastal wetlands. Emissions from livestock and fish-fed farming systems (enteric fermentation, excretion of ammonia from fish). Emissions associated to the construction of agricultural, fishery, and road and building infrastructure. Collection of Tier 2 data is often difficult and expensive so can never be achieved for all project variables. However collection of Tier 2 data is strongly advised for those core project components that are predicted to be stronger sources or sinks of GHGs. This practice invariably leads to a more harmonious integration of Tier 1 and Tier 2 data. Table 5: Overview of Tier 1 activity data that can be accommodated in EX-ACT (next page) 11
24 obligatory Only if project rela+a5:a44ted Description module Sub-continent Dominant regional soil type Type of climate Project duration Moisture regime I. Deforestation II. III. Land Use Change Module Forest type and size Final land use after conversion Area deforested Burning during conversion? Afforestation & reforestation Type of current land use Burning during conversion? Type of future forest Other land use change Type of current land use Burning during conversion? Type of future land use I. Annual systems II. III. Crop Production Module Current and future planted crop area (by type of crop) Practices of residue burning? Crop management practices Perennial systems Current and future planted crop area (by type of crop) Practices of residue burning? Irrigated rice Specifications of water management practices Type of organic amendment I. Grassland II. Grassland and Livestock Module Current and future grassland area by state of degradation Practices of grassland burning? Livestock Type and number of livestock Feeding and breeding practices I. Forest degradation & management II. Management and degradation Module Dynamic of forest degradation/rehabilitation by forest type and size Occurrence of forest fires? Degradation & management of organic soils (peatland) Vegetation type and size concerned by drainage of organic soils, % of ditches relative to the surface area Area affected by peat extraction, height of the extraction Area affected by rewetting Area affected by fire, occurrence & intensity of fire I. Extraction/excavation & drainage II. Coastal wetlands Module Vegetation type and % of the start surface area affected by extraction % of the start surface area affected by drainage Rewetting Vegetation type and area affected by rewetting % of nominal biomass restored Inputs & Investments module I. Agricultural inputs II. Energy consumption III. Quantity of agricultural inputs by type Quantity of electricity, liquid and gaseous fuel, and wood consumed Irrigation & infrastructures Size of area with newly established irrigation (by type) Size of area with infrastructures and buildings (by type) I. Fishery II. Fishery & Aquaculture module Species categories and associated fishing gear Annual Total catch % of the catch preserved with on board refrigerant % of the catch preserved on ice produced ashore Management practices that will affect the FUI Aquaculture Annual production Quantity of feed use 12

25 7. Building the baseline scenario The term baseline scenario refers to the counterfactual outcome, in terms of input variables and the resulting GHG-balance that would most likely have occurred in the absence of project intervention. EX-ACT determines the carbon-balance of a project by comparing the outcomes of the project with the baseline scenario. Therefore the baseline scenario is as integral to the final results of the EX-ACT analysis as the project itself. To produce a baseline scenario, EX-ACT allows users to choose between three approaches, as depicted in Figure 5 below: Figure 5: Three baseline methodologies for creating a baseline scenario Each method will produce baseline scenarios that differ greatly in complexity. For example, assuming that no changes to the initial situation will occur will produce a simpler baseline scenario than engaging expert opinion, extrapolating past trends based on secondary data or modelling future trends with the help of, say, computable general equilibrium models. Modelling approaches are highly advisable when the project addresses a situation in dynamic change. However, the simpler methodological approaches also have strong advantages due to their low data and resource needs. They may be a viable alternative in cases where land use change and agricultural practices have stagnated or where there are no clear incentives for change. It is important to note that setting a baseline can have political implications as well as technical; the emission levels that a country or project might claim as correct, is not necessarily the most likely emissions growth scenario without the project. This is a highly contentious issue in the UNFCCC and as yet there is no internationally agreed standard for setting agricultural mitigation baselines. 8. Brief guide to entering data a) Where to download and how to start Users can download the Excel file containing EX-ACT for free at b) Navigation bar The navigation bar at the top of the Excel spreadsheet allows users to easily navigate between the eight different topic modules. Each Excel worksheet provides an overview of the topic and activity areas of relevance to EX-ACT. 13
 c) EX-ACT colour codes Every EX-ACT module is subdivided into its different components using boxes.")

26 By clicking on the EX-ACT logo at the top left, users navigate directly to the EX-ACT homepage where they can find additional information. The navigation bar is shown in Figure 6. Figure 6: EX-ACT navigation bar with the eight modules (green boxes) c) EX-ACT colour codes Every EX-ACT module is subdivided into its different components using boxes. EX-ACT thereby uses a repeating colour code throughout all modules (see Figure 7 below). Cells in light blue indicate where users must specify information, while the background colour, shown here in brown, specifies the variables and units that must be provided as well as resulting changes in GHG emissions and carbon stock changes. By clicking on the orange boxes used throughout EX-ACT, users may find additional information and help to assist in filling the relevant module components. The violet boxes indicating Tier 2 data allow users to specify location specific values for carbon pools (e.g. soil carbon content) and GHG emission factors. Figure 7: EX-ACT colour codes Orange (help) Light blue (data entry) Violet boxes (Tier 2) d) Description Module After leaving the start screen, the first module users must complete is the description module. It should be filled with central descriptive information on regional agro-ecological conditions. Every new user should always begin by filling in the description module. If this does not occur, the rest of EX- ACT would not contain the necessary input information to proceed. Specifically, users should fill in the information depicted in Figure 8, by selecting from the drop-down menus. Figure 8: The Description Module 14

27 e) Data entry in the topic modules A detailed step-by-step guide to data entry is provided in the User Manual. To illustrate data entry, we will describe here only the Deforestation sub-section of the Land Use Change Module. Figure 9: Deforestation (Land Use Change Module) When using the Deforestation Sub-Module, the following information will be required: Identifying the current forest type: Based on the climatic information provided in the Description Module, users are provided with up to four different types of agro-ecological forest categories. From the drop-down list users then choose which of the four forest types best describes the area under the project subject to potential deforestation. In the example above this is Forest Zone 1 standing for Tropical rainforest. Identifying the final land use after deforestation: In the next step, users select the subsequent land use after conversion from a drop down menu. In the above example the forest is converted into annual crop land. Surface deforested: Next, users should specify the size of the area that remains forested for the three EX- ACT scenario points: In the example the initial forest size is ha. Without project implementation it will diminish due to deforestation to a final size of ha, while with project implementation ha will remain. Tier 2 specifications: While the previous information is sufficient for EX-ACT to calculate a Tier 1 based carbon-balance, further information can be specified by clicking on the Tier 2 button: As shown in Figure 10 above, users can input Tier 2 specifications for forestland subject to deforestation, the carbon content of above and below-ground biomass, litter, dead wood and soil organic carbon. In the below example, only the forest category Forest Zone 1/ Tropical rainforest was used. This was automatically shaded in blue by EX-ACT. From the Tier 2 data collected by project staff, it is known that the forest subject to deforestation is, per hectare, characterized by 168 tonnes of carbon per hectare in above ground biomass, 65 tc per hectare in below ground biomass and 3.9 tc per hectare in litter, while the soil carbon content is 68.3 tc per hectare. More details on data collection and entry of such Tier 2 data can be found in the User Manual. 2 2 The full reference list of cited literature and further information can be found in the EX-ACT User Manual. 15

28 Figure 10: Tier 2 specifications for deforestation 16