The Water Institute
|
|
|
- Suzanna Anthony
- 5 years ago
- Views:
Transcription
1

2 The Water Institute
3 Assessing Cumulative Watershed Stressors: Using LIDAR to Assess the Amount of Open Lands and Young Forest Associated with In- Channel Erosion for North Shore Tributaries John Jereczek MN DNR Lake Superior Habitat Coordinator, Division of Ecological and Water Resources, Two Harbors, MN Tom Hollenhorst U.S. Environmental Protection Agency Office of Research and Development, Mid Continent Ecology Division, Duluth, MN
4 Assessing Cumulative Watershed Stressors: Using LIDAR to Assess the Amount of Open Lands and Young Forest Associated with In- Channel Erosion for North Shore Tributaries John Jereczek MN DNR Lake Superior Habitat Coordinator, Division of Ecological and Water Resources, Two Harbors, MN Tom Hollenhorst U.S. Environmental Protection Agency Office of Research and Development, Mid Continent Ecology Division, Duluth, MN
5 Assessing Cumulative Watershed Stressors: Using LIDAR to Assess the Amount of Open Lands and Young Forest Associated with In- Channel Erosion for North Shore Tributaries John Jereczek MN DNR Lake Superior Habitat Coordinator, Division of Ecological and Water Resources, Two Harbors, MN Tom Hollenhorst U.S. Environmental Protection Agency Office of Research and Development, Mid Continent Ecology Division, Duluth, MN
6 Assessing Cumulative Watershed Stressors: Using LIDAR to Assess the Amount of Open Lands and Young Forest Associated with In- Channel Erosion for North Shore Tributaries John Jereczek MN DNR Lake Superior Habitat Coordinator, Division of Ecological and Water Resources, Two Harbors, MN Tom Hollenhorst U.S. Environmental Protection Agency Office of Research and Development, Mid Continent Ecology Division, Duluth, MN

7

8

9

10
11 Assessing Cumulative Watershed Stressors Watersheds accumulate precipitation, which accumulates into hydrologic flows (streams) Hydrology moves stressors downstream (i.e. sediment, nutrients, contaminants). Stressors accumulate moving downstream, but can also be diluted by the flow (which is also accumulated) Imperviousness, agriculture, open lands, and young forest effect hydrologic flows (peaks and timing) "What makes a river so restful to people is that it doesn't have any doubt it is sure to get where it is going, and it doesn't want to go anywhere else." Hal Boyle


12 GLEI Great Lakes Environmental Indicators Project Assessing Cumulative Watershed Stessors: Morrice et al. 2008
 for watersheds Composite score")

13 Assessing Cumulative Watershed Stessors: Stressor scores (SumRel) for watersheds Composite score based on cumulative scores for: % agricultural land use Population density Road density Point source density
14 Assessing Cumulative Watershed Stessors: Stressor scores (SumRel) for watersheds Composite score based on cumulative scores for: % agricultural land use Population density Road density Point source density

15 Assessing Cumulative Watershed Stessors: SPARROW (Spatially Referenced Regressions On Watershed attributes)
16 Assessing Cumulative Watershed Stressors Need to understand, or predict the effect of these stressors all along the tributary, not just for discreetly defined watersheds and subcatchments Need the resolution to detect small impacts that cumulatively could have larger impacts Need to detect past (legacy) stressors also Forest clear cuts < 16 years of age Other disturbance (fire, wind throw, disease) Mining (even gravel pits) Ditches
17 Why North Shore? Engaged in the SFRMP 10 year Planning Staff felt that certain streams were over stressed with no good way to quantify Watersheds with healthy forests show greater resiliency to large events Difficult and expensive to repair streams Focus on preventing degradation Streams over limits may not show immediate impacts

18
19
20 Executive Summary Table of Contents Introduction Stand Selection Results New Access Needs Revisions to the Strategic Direction Document Public Comments and Responses Regarding the Strategic Direction Document Glossary Appendix A D 10-Year Stand Examination List by Subsection and Location Stands with a White Pine Component Map 1.1 Stands Identified for Treatment by Generalized Cover Type Map 1.2 Stands Identified for Treatment by Generalized Cover Type Map 1.3 Stands Identified for Treatment by Generalized Cover Type Map 2.1 Stands Identified for Treatment by Preliminary Prescription Map 2.2 Stands Identified for Treatment by Preliminary Prescription Map 2.3 Stands Identified for Treatment by Preliminary Prescription Map 3.1 Patches Greater Than 250 Acres and Stand Prescriptions Map 3.2 Patches Greater Than 250 Acres and Stand Prescriptions Map 3.3 Patches Greater Than 250 Acres and Stand Prescriptions Map 4.1 MCBS Sites of Biodiversity Significance and Stand Prescriptions Map 4.2 MCBS Sites of Biodiversity Significance and Stand Prescriptions Map 4.3 MCBS Sites of Biodiversity Significance and Stand Prescriptions Map 5.1 New Access Needs Map 5.2 New Access Needs Map 5.3 New Access Needs
21 Executive Summary Table of Contents Introduction Stand Selection Results New Access Needs Revisions to the Strategic Direction Document Public Comments and Responses Regarding the Strategic Direction Document Glossary Appendix A D 10-Year Stand Examination List by Subsection and Location Stands with a White Pine Component Map 1.1 Stands Identified for Treatment by Generalized Cover Type Map 1.2 Stands Identified for Treatment by Generalized Cover Type Map 1.3 Stands Identified for Treatment by Generalized Cover Type Map 2.1 Stands Identified for Treatment by Preliminary Prescription Map 2.2 Stands Identified for Treatment by Preliminary Prescription Map 2.3 Stands Identified for Treatment by Preliminary Prescription Map 3.1 Patches Greater Than 250 Acres and Stand Prescriptions Map 3.2 Patches Greater Than 250 Acres and Stand Prescriptions Map 3.3 Patches Greater Than 250 Acres and Stand Prescriptions Map 4.1 MCBS Sites of Biodiversity Significance and Stand Prescriptions Map 4.2 MCBS Sites of Biodiversity Significance and Stand Prescriptions Map 4.3 MCBS Sites of Biodiversity Significance and Stand Prescriptions Map 5.1 New Access Needs Map 5.2 New Access Needs Map 5.3 New Access Needs


22
23 Purpose Provide tools for planning and strategic decision making by forest resource mangers To help inform the planning process and make better decisions Use quality data and recognized methods Bring a watershed context to forest planning efforts Bring a Function-Based Framework for Stream Assessment & Restoration Projects


24 A Function-Based Framework for Stream Assessment & Restoration Projects Within this hierarchical Framework, higher-level functions are supported by lower level functions, like a pyramid. Hydraulic Functions cannot occur without Hydrologic Functions and so on.
25 efforts to restore streams are often ineffective because they fail to address the underlying processes that create and maintain the biological functions. The purpose of this hierarchy is to indicate the complex set of linkages that exists between functions of stream and riparian systems and to indicate which functions are most critical and interrelated to the restoration of stream and riparian functions.
26 Open Land(and young forest) Impacts Changes in vegetation cover from forest land to farmland (or young forests) will cause snow to melt faster and will cause rainfall to reach streams faster. The changes in vegetation cover do not affect the peak flow of large floods; say in the 25- to 100-year flood range. However, they do affect the smaller peak flows. Most importantly, they affect the every year peak flow.* Removal of the forest canopy that changes land use to "open" conditions: agricultural, urban, or rights of way, is sufficient to initiate and prolong in-channel stream erosion and sedimentation for more than a century. * * Verry, E. S. (2000). Society of American Foresters. In Society of American Foresters (Ed.), LAND FRAGMENTATION AND IMPACTS TO STREAMS AND FISH IN THE CENTRAL AND UPPER MIDWEST (pp ). Washington, DC: SAF Publ 01-02
27 Problems caused by excess runoff Fast, quick storm flow peaks Loss of summer/winter base flow Erosion and sedimentation Turbidity Excess nutrients High water temperatures Effects on fish and bugs
28 Mature forest hydrograph With 50% of the upland aspen forest clearcut, snow melt peaks become de-synchronized yielding two smaller peak flows Marcell Experimental Forest, northern Minnesota, watershed no. 4 *Verry Lake Superior Watershed Ditch and Culvert Design Workshop

29 With all of the aspen upland clearcut, snow melt peak flow is synchronized, occurring 4 days earlier than mature forest conditions, and at twice the peak flow rate. Mature forest hydrograph Marcell Experimental Forest, northern Minnesota, watershed no. 4 *Verry Lake Superior Watershed Ditch and Culvert Design Workshop
30 170 Percent change in peak flow VLB83 Management range for peak flows from basins with less than 60% of their area in open or young forests (<16) Reference to change in peak flow from a mature aspen forest V86 VLB VLB83 VLB83 Percent of entire basin in open or young-forests (<16) V86 FKW99 L94 *Verry Lake Superior Watershed Ditch and Culvert Design Workshop

31 Effects Are 1 st Observed For flat out wash or lake bed basins (< 3% slopes) they need to be 10 sq. miles before there is enough power in the flowing water to cause excessive in-channel erosion For steep glacial moraine basins (3-40% hill slopes) they need to be 1 sq. mile


32 A general rule of thumb When the amount of open land and young forests reach 60% of a watershed, stream flows can increase two to three-times Photo: Carmen Wagner and Jeff Martin
33 Assessing and Quantifying Open Lands and Young Forest (<16 yrs) Previous efforts: Comparative watershed study Agency records, timber sales etc. Satellite imagery analysis map clear cuts for each year of a 17 year sequence Vegetation Change Tracker Algorithm (Forest Service, google etc.)

34

35

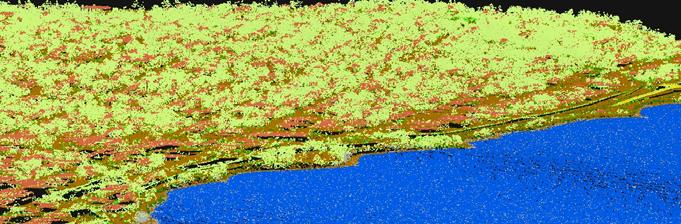
36
37

38 LIDAR Benifits High Accuracy Current Data Repeatable minimum digitizing errors Weather independent Consistent uniform coverage Fast Cost effective Canopy and stand density (biomass etc.) EPA Mid Continent Ecology Division

39 EPA Mid Continent Ecology Division

40 EPA Mid Continent Ecology Division

41

42


43

44 The density of returns, classed as either high vegetation The density of returns classed as ground = Canopy Cover

45 LiDAR Canopy Coverage


46 Canopy cover

47 Percent Open Land


48 DNR 8
")

49 ArcHydro (GLEI)

50 NHD+
51 Dilemma No watershed meets all the requirements for slope and area. Need to aggregate or split. No watershed meets point of interest concerns. Need a watershed for each point along a stream

52 Dilemma No watershed meets all the requirements for slope and area. Need to aggregate or split. No watershed meets point of interest concerns. Need a watershed for each point along a stream Solution: Create a continuous flow accumulation stressor grid


53 Flow Accumulation Weight Raster - optional input raster for applying a weight to each cell. If no weight raster is specified, a default weight of 1 will be applied to each cell. For each cell in the output raster, the result will be the number of cells that flow into it.


54 Sum Total Open Land


55 Flow Accumulation Zoom
56


57 Percent Open Land Polylines zoom

58 Area of Interest


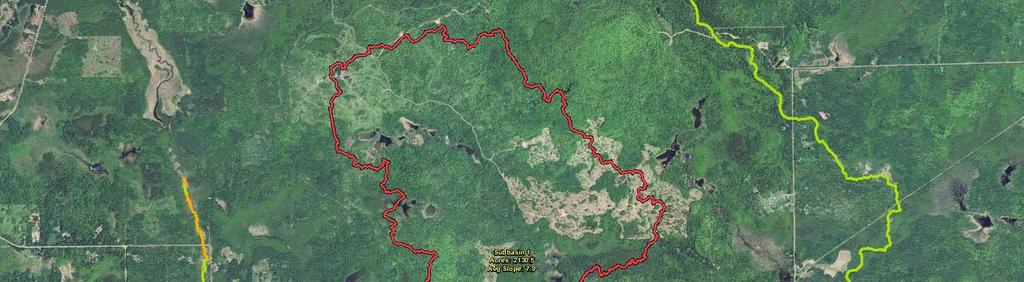

59 Watershed

60
61 Assessing Continous Cumulative Watershed Stressors

62 Assessing Continous Cumulative Watershed Stressors Miller Creek open lands
63 "What makes a river so restful to people is that it doesn't have any doubt it is sure to get where it is going, and it doesn't want to go anywhere else." Hal Boyle
64

65

66

67

68