Carrying capacity estimation in common water bodies. Case studies in the Philippines
|
|
|
- Isabella Campbell
- 5 years ago
- Views:
Transcription
1 Carrying capacity estimation in common water bodies Case studies in the Philippines USSEC Southeast Asia Regional Symposium on Aquaculture Carrying Capacity Modeling for Common Water bodies June 2013 Bangkok, Thailand
2 Scope of the presentation Aquaculture park development Planning sustainable aquaculture Minimising aquaculture impact on the environment Optimising aquaculture production Integrated Multi-Trophic Aquaculture

3 Planning and management of aquaculture parks for sustainable development of cage farms in the Philippines Partners BFAR, NIFTDC, Map and Marine, Akvaplan-niva Funded by Norad, Norway
4 Location of Existing Mariculture Park/Zone Philippine Mariculture (As of February 18, park 2010) locations Region II Sta. Ana, Cagayan Region I Badoc, Ilocos Norte Narvacan, Ilocos Sur (100 Ha.) Rosario, La Union Sto. Tomas, La Union (100 Ha.) Sual, Pangasinan Region IV-A Tagkawayan, Quezon Province (500 Ha.) Padre Burgos, Quezon Province (500 Ha. Region IV-B Calapan City Oriental Mindoro (200 Ha.) Sta. Cruz, Marinduque (500 Ha.) San Jose City, Occ. Mindoro (500 Ha.) Looc, Romblon (435 Ha.) Coron, Palawan San Vicente, Palawan Puerto Princesa, Palawan Quezon, Palawan Narra, Palawan Region X Balingasag, Mis. Oriental ( Ha.) Sultan Naga Dimaporo, Lanao del Norte (500 Ha.) Region IX Murs ilagos Rizal, Zambo. Del Norte (1,000 Ha.) Margosatubig, Zambo. Del Sur (214 Ha.) Tungawan, Zambo. Sibugay (500 Ha.) Zamboanga City, Zamboanga (200 Ha) ARMM Sibutu - Sitangkai, Tawi-Tawi Phase 1 A&B (27T Ha.) # # MZ/MP Established = 49 For Launching = # # Region III Casiguran, Aurora Province (320 Ha.) Region V Raga y, Camarines Sur (105 Ha.) Sagnay, Camarines Sur (500 Ha.) Magallanes, Sorsogon Bacon, Sorsogon City Masbate City, Masbate Matnog, Sorsogon # Region VIII San Jose N. Samar (800 Ha.) Laoang, N. Samar (2,500 Ha.) Calbayog, Samar (300 Ha.) Basey, Samar (400 Ha.) Na val, Biliran (200 Ha.) Biliran, Biliran (100 Ha.) Le yte Le yte, Le yte (100 Ha.) Sta. Rita, Samar (600 Ha.) Babatngon, Le yte (600 Ha.) Tacloban City, Le yte (800 Ha.) Quinapondan, E. Samar (1,000 Ha.) Ormoc, Le yte (600 Ha.) Merida, Le yte (100 Ha.) Liloan, S. Le yte (100 Ha.) Region VII Talibon, Bohol (370 Ha.) Calape, Bohol Maribujoc, Bohol Mabini, Bohol Bais, Negros Orriental Candijay, Bohol Region XIII Dapa, Siargao Is., Sur del Norte (1,000 Ha.) San Jose, Dinagat Pr ovince Surigao City, Surigao del Norte (500 Ha.) Barugo, Surigao del Sur (500 Ha.) Region XI Panabo City, Dava o del Norte (1,075 Ha.) Pantukan, Compostela Valley Mati, Da vao Oriental Samal Is., Da vao del Norte (224 Ha.)

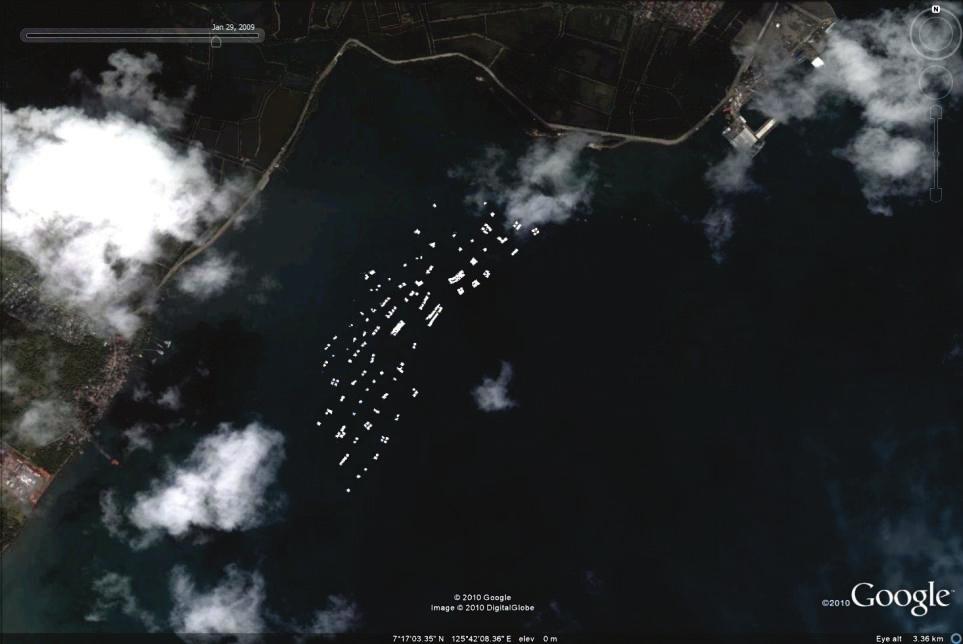
5 Initial Concept of Panabo Mariculture Park

6

7 Actual Park
8 Using modelling for planning for sustainable development Reorganisation of the Mariculture Park to reduce environmental impact Planning for further expansion (modelling for exposure) Integrating fed production with unfed production IMTA (recapture of nutrients and provide further livelihoods)
9 Optimisation Process Data collection Production survey actual tonnes produced Environmental survey actual impact caused Modelling Environmental impact Location of extractive species Optimisation cage layout Inclusion of Integrated Multi-trophic aquaculture (fish, oysters and seaweed) Expansion in deeper area with larger cages
 Culture 117.5 0.04 TOTAL 324,670.")
10 Production survey - Total biomass of species Total biomass of species culture at Panabo City Mariculture Park SPECIES CULTURED BIOMASS (kg) Total Biomass (%) Milkfish monoculture 275, Milkfish-Siganid polyculture 48,470* Grouper culture Pomfret (Pampano) Culture TOTAL 324,670.60


11 Environmental survey Analysis of the bathymetry of the area Profiling of temperature, salinity, and oxygen levels through the water Sediment analysis Survey of current speed and direction Grab CTDO Current meter
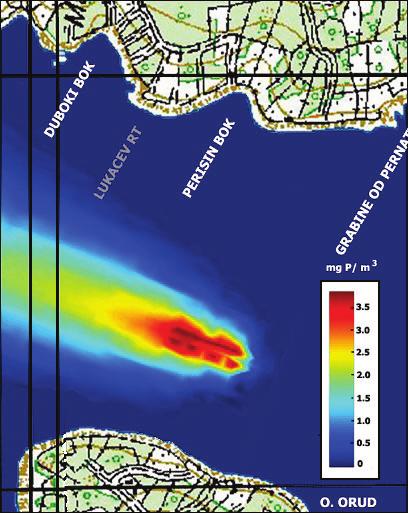
12
 under clusters of cages or under large")
13 Modelling environmental impact - TROPOMOD HIGH impact (orange) close to clusters of cages MODERATE impact (green) away from cages or around small clusters of cages SEVERE impact (grey) under clusters of cages or under large cages
14

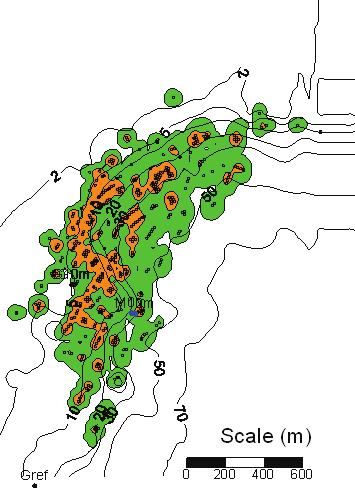
15 Panabo AquaPark Existing and reorganised Spacing between zones results in less impact and also more space for IMTA units

16 Panabo AquaPark Existing and offshore zones added Good feeding scenario improves inshore areas Offshore Milkfish zones in deeper areas results in good dispersion

17 Nutrient budget and fate
18 Suspended solids reaching suspended oyster culture at different depths % of waste feed and faeces intersecting suspended culture 1% 4% 11% 16% 2% 5% 8% 8% 2% 2% 3% 2% 13% 9% 5% 1% 7% 6% 6% 2% 2% 2% 2% 2% 0-3m 3-6m 6-9m 1% 1% 2% 2% 1% 1% 1% 1% 25 m 10 m 5 m 3m 0 m 0 m 3m 5m 10 m 25m Distance from cage edge (m) 1% 1% 1% 1% 1% 1% 1% 1% The majority of the wastes intersect the suspended culture in the top 6 m; these wastes are mostly fine and slow settling Milkfish faeces Net depth is important when considering optimum depth of suspended culture 9-12m 12-15m
19 North Percentage of waste feed and faeces reaching suspended culture For Panabo, residual current to the south means predictions are higher at the IMTA units to the south, and lower to the east
20 Dissolved nutrient plume reaching seaweed culture % of plume intersecting seaweed culture to the SOUTH of the cages 9% 18% 26% 32% 0-3m Plan view N 2% 3% 3% 3% 3-6m <1% <1% <1% <1% 6-9m <1% <1%<1% <1% 9-12m <1% <1% <1% <1% 25 m 10 m 5 m 3m 0 m Distance from cage edge (m) 12-15m More of the plume intersects seaweed culture to the south of the cages as this is the direction of the residual current Net depth is important when considering optimum depth of seaweed culture
21 Nutrient plume from a large polar circle cage reaching seaweed culture % of plume intersecting seaweed culture to the SOUTH of the cages 6% 10% 11% 12% 0-3m Plan view N 6% 10% 12% 12% 3-6m 5% 7% 9% 10% 6-9m 1% 1% 2% 1% 9-12m <1% <1% <1% <1% 25 m 10 m 5 m 3m 0 m Distance from cage edge (m) 12-15m A deeper net means more of the suspended line comes into contact with the plume Seaweed culture at depth will be limited by light rather than nutrients
22 Suspended solid nutrient uptake by benthic structures TROPOMOD predictions of the waste feed and faeces depositing on 8 m by 8 m structures on the sea bed Structures for benthic culture
23 Nutrient uptake by Benthic structures North Percentage of waste feed and faeces reaching bethic structures 4 % For structures on the sea bed, around 20% of wastes deposited within 8 m of the cages Fine, slow settling Milkfish faeces are dispersed away from these structures

24 Optimised Mariculture park with IMTA
25

26 Optimal location of extractive species Seaweed, oysters and sea cucumbers Suspended oyster culture located 10+ m from cage groups along the axis of group Shallow seaweed culture located 10+ m from cage groups along the axis of group Benthic culture optimum location at end of cage groups, but not directly underneath
27 The four dimensions of carrying capacity Fed aquaculture Extractive aquaculture Bathymetry/Pond structure Hydrodynamics Land use/infrastructure etc Physical carrying capacity (primary site selection) Bathymetry Currents Temperature etc Feed FCR/FCE/Wastage Markets etc Production carrying capacity Plankton Detritus Markets etc Mass balance models Hydrographic models Community structure etc Employment Visual impacts Recreation Charismatic species Traditional fisheries etc Guidance/ feedback Ecological carrying capacity Social carrying capacity Mass balance models Hydrographic models Community structure etc Employment Visual impacts Recreation Charismatic species Traditional fisheries etc Ross et al., 2013 in Press
28 The Ecosystem Approach of Aquaculture is a Strategy that has these three objectives at the core Ensuring ecological well being Ensuring human wellbeing Ensuring the ability to achieve both (governance) Takes into consideration, different scales, Carrying capacity, transboundary issues

29 bearable Ross et al., 2013 in Press
30