Introduction of Dinghushan Forest Ecosystem Research Station
|
|
|
- Matthew Banks
- 5 years ago
- Views:
Transcription
1 Introduction of Dinghushan Forest Ecosystem Research Station Dinghushan Station Chinese Academy of Sciences Bayreuth, Germany
2 Outline Location of Dinghushan History of Long-term ecological research


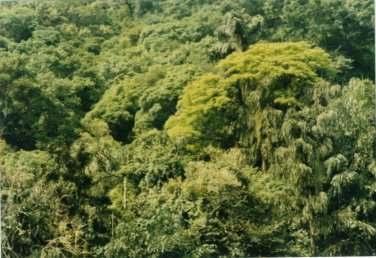
3 Dinghushan-The Green Pearl at Tropic of Cancer Location and representation 23 o 11 N, 112 o 34 E East China Sea South China Sea Global vegetation map (source: NASA)
4 Location and representation Excellent venue for ecosystem research Monsoon climate Qinghai-Tibetan plateau Monsoon evergreen broadleaved forest Ecosystem pattern, processes and services Global climate change Subtropical high Near the Tropic of Cancer Tropical desert
5 Location and representation Area : 1,133 ha Elevation: ranging from 10 to 1,000 m above sea level Climate: typical south subtropical monsoon climate Annual average precipitation: 1,950 mm Annual mean temperature: 20.8 o C Relative humidity: 80% Predominant soil types: lateritic red-earth (in the lower altitude region) and yellow earth (in the higher altitude region


6 Location and representation Typical vegetation types in south China Mountain grassland Elevation gradient Mountain shrubland Forest Succession Processes Mountain evergreen broadleaved forest m Pine forest Mixed forest Monsoon evergreen broadleaved forest Riverbank forest
7 Milestones of Dinghushan station 1956: Dinghushan Natural Reserve was established 1978: was established 1979: DNR became the NO.17 research station in UNESCO s MAB Network 1991: DHS joined in Chinese Ecosystem Research Network (CERN), CAS 1999: DHS joined in National Field Research Station (pilot station) 2002: DHS became a research station in China Fluxnet, CAS 2003: DHS joined in the Regional Atmospheric Observation Network, CAS. 2007: DHS was selected as regional core station in CERN
8 Long-term ecological research Core research themes are: Carbon, nitrogen, and water cycling in successional forests in subtropical region; Biodiversity and ecosystem functions


9 Monitoring and Observation Carbon-related monitoring and observations Monitoring biomass, vegetation composition, soil organic matter since 1950s; Permanent plot Permanent plots were set in the 1970s; Regular field census carried out every 5 years. Investigation plot Soil sampling Litter trap Biomass census Phenological monitoring


10 Monitoring and Observation Carbon-related monitoring and observations C and H 2 O fluxes monitoring since 2002 Eddy tower (OPEC system) Chamber-GC system


")


11 Nutrients-related monitoring and observations Monitoring and Observation Elements (N, P, K, Ca, Na, Mg, Cu, Fe, Zn, Mn, Cr, Al ) dynamics in plant tissues, soil, and water monitoring since 1970s Plant and soil samples Lab analysis Water samples


12 Hydrological monitoring DHS Progress and achievements Regular hydrological observation since 1970s Runoff, throughfall, stem flow, soil water, etc DOC, DON, and elements


13 Monitoring and Observation Meteorological observation Meteorological observation since 1950s Air temperature, soil temperature Precipitation Radiation Humidity Evaporation.


14 Monitoring and Observation Regional atmospheric background monitoring (since 2003) O 3, CO 2, CH 4, NxO, SO 2, aerosol, etc


15 Monitoring and Observation Biodiversity monitoring Regular plant investigations since 1950s Borderline of permanent plot


16 Monitoring and Observation Biodiversity monitoring 20 ha plot Large sample plot for biodiversity monitoring since 2004 Tagged trees Seeds trap Tagged seedlings

17 DHS Progress and achievements Long-term ecological research in DHS is financially supported by projects from Chinese Academy of Sciences, National Natural Science Foundation of China, The Ministry of Science and Technology of the People s Republic of China, Natural Science Foundation of Guangdong Province, etc. Over 1,000 scientific papers presented since 1970s. In recent 5 years, publications are more than 200 papers including Science, Nature, Global Change Biology, etc. Contribution of vegetation restoration to mitigate carbon emission in Guangdong regional scale. 1970s 1990s
18 Team 12 staffs, 20 graduate students, 2 postdoc fellows, 4 guest professors, 8 visiting scientists
19 Natural environmental change Human activities Perspectives Successional subtropical forest ecosystems Change in in ecosystem pattern, processes and services and the underlying mechanisms Forest ecosystem functions, responses and acclimation to global change Ecosystem services C sequestration ability Forest and water resource Forest responses to nitrogen deposition C, N, H 2 O interaction


20 Observation and monitoring Long-term observation and monitoring with updated instruments and equipments Hydrological observation DOC Auto-soil moisture meter ICP 1,000 m 2 experimental catchment Auto rain gauge Water table meter
21 Long-term experiments Layout of experimental plots in the monsoon evergreen broadleaved forest

22 Long-term experiments Canopy ecological processes Biodiversity Physiological processes Micrometeorology
")

23 Long-term experiments Decomposition experiments (1) Effects of incubation start time on litter decomposition (since 2009)


24 South China Botanical Garden, CAS Long-term experiments Decomposition experiments (2) CWD decomposition (since 2003)
25 Perspectives Soil respiration experiments (1) Contribution of substrate amount on soil respiration (since 2009)
")


26 Soil respiration experiments (2) Long-term experiments Partitioning soil CO2 flux (since 2009) with 7 Treatments: No-roots; No-litter; No-inputs; OA-less; Double litter; Mycorrhizal; Control
 Long-term experiments Soil")


27 Influences of precipitation variability (since 2005) Long-term experiments Soil temperature, moisture regime Soil-atmospheric GHG exchange Roots Litter decomposition Microbial composition SOC fraction Understory growth APA (acid phosphomonoesterase activity)


 3.5 4.0 4.")

28 Long-term experiments Simulated acid deposition experiment (since 2008) C C C Automatic leaching sampling system

29 Long-term experiments Simulated nitrogen deposition experiments (since 2003) N, C cycling ; 1860 Litter decomposition ; Soil-atmospheric GHG exchanges; Fine roots; Early 1990s Plant physiology; Microbiology; Carbon sequestration ability 2050 APA Spatial patterns of total nitrogen deposition in 1860, early 1990s, and 2050 Source: Galloway et al., 2004
30 Long-term experiments Simulated nitrogen deposition experiments (since 2003)
 N5 P4 NP5 P5 N4 P3 NP4 P2 N3 NP3 N2 NP2 P1 P5 N5 NP5 N4 NP4")

31 Nitrogen deposition experiments Long-term experiments N, P experiments (since 2007) N5 P4 NP5 P5 N4 P3 NP4 P2 N3 NP3 N2 NP2 P1 P5 N5 NP5 N4 NP4 P4 P3 N3 NP3 NP2 P2 N2 N1 NP1 P1 Pine forest N1 NP1 Monsoon evergreen broadleaved forest P5 N5 NP5 N4 NP4 P4 P3 N3 NP3 NP2 P2 N2 Mixed forest N1 NP1 P1
 Four treatments -High")


32 Long-term experiments C-N interaction (OTC experiments since 2005) Four treatments -High CO 2 concentration, High N deposition -High CO 2 concentration, Ambient N deposition -Ambient CO 2 concentration, High N deposition - Ambient CO 2 concentration, Ambient N deposition
33 Long-term experiments C-N-P interaction (pot experiments since 2009) N:P ratio Ca:Al ratio Physisological measurement


34 Data from field and laboratory DHS station information system Homepage Data pipeline

35 Communication and cooperation C,N mineralization with Dr. B Zeller from NIAR France since 05/08 23 rd New Phytologist Symposium: Carbon Cycling in Tropical Ecosystems, 11/09 Introduction of TERRECO by Professor Tenhunen, 03/10 Transnational Biodiversity Conservation & Management of Tropical/Subtropical Forests, 12/09

36 Anything else?? Log on our website Or send us s

37 Thanks for your attention!