Hardwood Lumber Industry Overview and Impacts on Wood Supply and Demand in the Appalachians
|
|
|
- Julie Butler
- 5 years ago
- Views:
Transcription


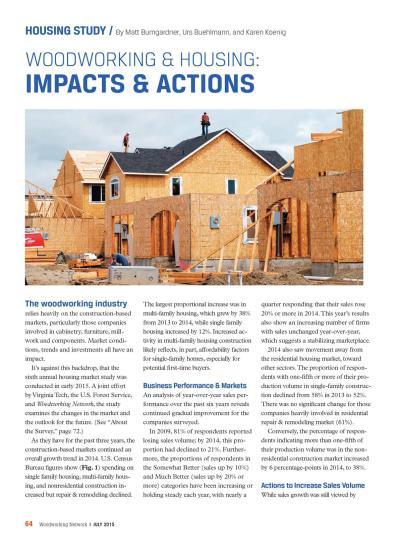
1 Hardwood Lumber Industry Overview and Impacts on Wood Supply and Demand in the Appalachians Matt Bumgardner U.S. Forest Service Northern Research Station FRA 2016 Appalachian Region Fall Meeting Sept. 14, 2016

2 Outline Overview of hardwood industry Impacts of housing on secondary woodworking Global trends Questions/comments
3 Billion Board Feet Eastern U.S. hardwood lumber production Estimate 1 Estimate 2 Estimate 3 Source: Luppold and Bumgardner
4 = 100 Hardwood lumber price index Deflated Price Average 1990 to 2015 Data source: U.S. Dept. of Labor; Luppold and Bumgardner
5 Prices ($/MBF) for green 1C Appalachian hardwood lumber (4/4) Species Price Cherry 700 Yellow-poplar 445 Soft maple (unselected) 860 Red oak 695 Hard maple (unselected) 785 Walnut 1270 White oak 885 Source: Hardwood Market Report 9/9/16


6 The major markets for hardwood lumber Appearance-based: Furniture Cabinets Flooring Millwork Exports Photo: AHMI Industrial: Pallets Railroad ties Photo: 2010 Ohio Hardwood Furniture Market Photo: USDA Forest Service Southern Research Station Archive, USDA Forest Service, SRS, Bugwood.org
7 Exports, 10.6% Cabinets, 11.5% Where the hardwood lumber volume went, 1999 Pallets, 35.4% Millwork, 17.7% Furniture, 19.5% Railway ties, 5.3% Exports, 17.4% Where the hardwood lumber volume went, 2015 Pallets, 34.9% Cabinets, 9.3% Source: Luppold Millwork, 18.6% Furniture, 7.0% Railway ties, 12.8%
8 Percent U.S. hardwood lumber consumption by market segment* Appearance-based Industrial Other * Exports excluded Luppold and Bumgardner Wood & Fiber Science.
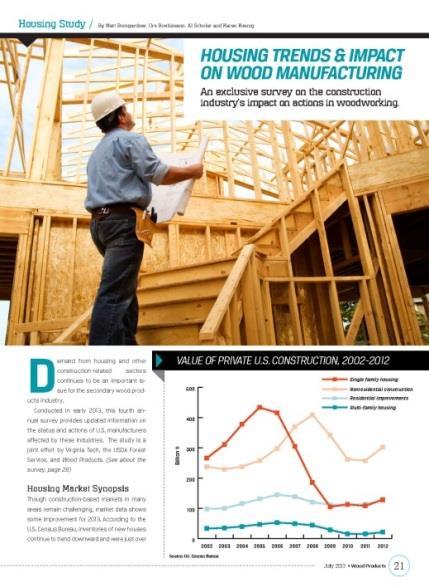
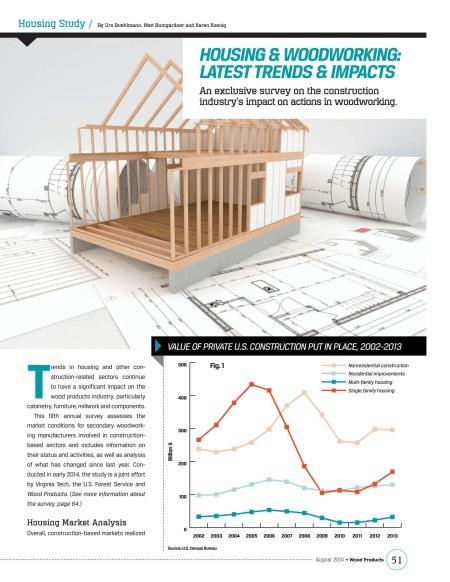
9 U.S. hardwood lumber exports Year Volume (billion bd. ft.) Percentage of total consumption plus exports Percentage of appearance-based consumption plus exports % 16% % 16% % 17% % 21% % 25% % 37% Luppold and Bumgardner Wood & Fiber Science.

10 Market share estimates of imports in the U.S. Consumption = value of shipments + imports exports Import share = imports/consumption Data sources: U.S. Census Bureau; International Trade Admin.
11 Billion $ Data source: International Trade Administration Major U.S. import sources Household & Institutional Furniture & Cabinets (NAICS 3371) % 61% 59% China Vietnam Canada Mexico Total
12 Thousand employees Employment trends wood furniture vs. cabinets Wood Household Furniture Wood Kitchen Cabinets Data source: Bureau of Labor Statistics
13 2000 and 2007 = 100 Employment indexes for last two economic recession periods Millwork Pallets Cabinets WHF Luppold and Bumgardner BioResources.
14 , 2002, and 2009 = 100 Employment indexes for last three economic expansion periods Millwork Pallets Cabinets WHF Luppold and Bumgardner BioResources.
15 Single family starts (000) No. of employees (000) Housing market s importance to woodworking employment Year 0 Single family housing starts No. of employees - Cabinets No. of employees - Millwork Data sources: US Census Bureau; Bureau of Labor Statistics
16 Billion $ Value of private U.S. construction, Single family housing Residential improvements Multi-family housing Nonresidential construction Data source: U.S. Census Bureau
17 Percent Multi-family percentage of total housing market (single family + multi-family) Data source: U.S. Census Bureau Value of construction # of Starts Value per start in 2015: SF = $306,508 MF = $130,883
18 Index 1982 = 100 Price of 1C lumber versus the price of stumpage in Ohio OH Stumpage 1C Lumber Sources: Luppold; HMR; ODNR/OSU
19 Index 1982=100 Price of 1C lumber versus the price of high grade logs in Ohio OH high grade logs 1C Lumber Sources: Luppold; HMR; ODNR/OSU
20 Index 1982=100 Price of HMR 1C lumber versus the price of low grade logs in Ohio OH low grade logs 1C Lumber Sources: Luppold; HMR; ODNR/OSU

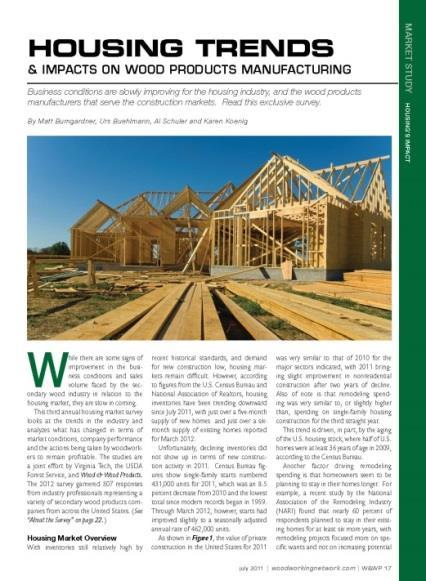
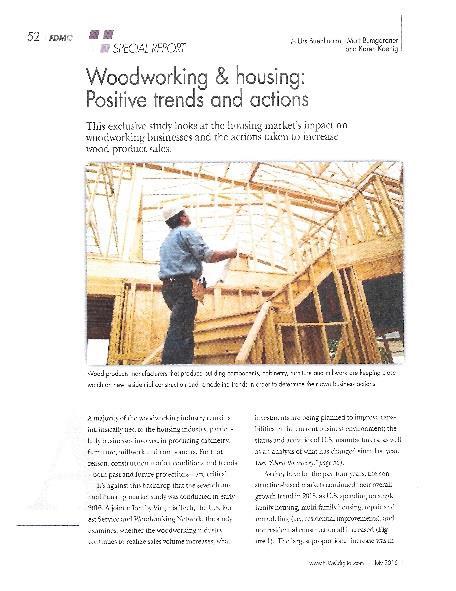
21 Seven years of studies in collaboration with Virginia Tech, the U.S. Forest Service, and Woodworking Network/FDMC
22 Percent Year-over-year changes in sales volume Year % losing sales volume Much worse Somewhat worse Slightly worse Slightly better Somewhat better Much better Unchanged
23 Number of U.S. establishments Cabinets (NAICS 33711) Millwork (NAICS 32191) Year-over-Year Cabinets Millwork % -5.8% % -6.4% % -5.5% % -3.1% % -2.4% % -1.5% % -0.3% 12,000 11,000 10,000 9,000 8,000 8,306 7,000 6,000 5,000 4,000 3,450 3, Data source: Bureau of Labor Statistics
24 Index 2001=100 Index of sawmill employment and number of sawmills in the Appalachian Region Emp. = 23,597 Sawmills = 1, Emp. = 17,231 Sawmills = 1, Employment # of sawmills Data source: Bureau of Labor Statistics
25 Perceived reasons for sales volume declines (for those firms indicating a decline) Downturn in the housing market Downturn in the remodeling expenditures Downturn in nonresidential construction We contracted in proportion with the overall economy Offshore competition More domestic competitors entered the market 2009 Competition from non-wood substitute products =Minor reason to 5=Major reason
26 Percent Proportion of production volume associated with the single family housing construction market % 1-20% 21-60% %
27 Exports / Global Trends
28 Market share (by value) of specific hardwood products exported by the United States Product Percent --- Lumber Logs Veneer Cooperage Flooring Plywood Chips Other Source: Luppold and Bumgardner BioResources.
29 U.S. hardwood product* exports and imports, * Includes hardwood logs, lumber, veneer, cooperage, molding, siding, plywood, and flooring Source: Luppold and Bumgardner BioResources.
30 Top five hardwood lumber-exporting countries* 1990 % 2000 % 2011 % United States 34.3 United States 23.6 United States 22.8 France 12.1 China 13.0 Belgium 8.9 Yugoslavia 11.8 Canada 11.5 Russia 7.2 Canada 7.8 France 5.3 Romania 7.1 Germany 5.8 Romania 5.2 Germany 5.9 Top Top Top * Temperate Region Bumgardner, Johnson, Luppold, Maplesden, and Pepke Markets and Market Forces for Lumber (Ch. 3).
31 Million $ U.S. hardwood lumber exports (Top 5 destinations) % ~ 74% of total Canada China Mexico 1000 Italy Vietnam 500 Total to World Japan and the UK were slightly higher than Italy starting in 2012, dropping Italy to 7 th 106 other trading partners account for the remaining 26% Data: USDA Foreign Agricultural Service
32 thousand cubic meters U.S. hardwood lumber exports by species Red oak White oak Y-poplar Maple Ash Walnut Cherry Yellow-poplar = +112% (from 2000 to 2015) Ash = +150% Walnut = +299% Data: USDA Foreign Agricultural Service
33 Relative export scores* for hardwood lumber (NAICS ) for (OH = +3.6) (TN = +0.7) * Score = Percentage of export volume Percentage of employment
34 Relative export scores* for furniture and cabinets (NAICS 3371) for (OH = +3.4) * Score = Percentage of export volume Percentage of employment
35 Importance of coastal locations to hardwood lumber exporting Port Regions (incl. all port types water, land, air) % of U.S. Hardwood Lumber Exports East Coast* 63 West Coast 20 Great Lakes 12 Gulf of Mexico 5 * 70% of hardwood lumber leaving East Coast ports was destined for East Asia and Southeast Asia USDA Foreign Agricultural Service 2015
36 Top five hardwood lumber-producing countries* 1990 % 2000 % 2011 % United States 33.2 United States 50.8 China 41.5 USSR 17.1 China 5.4 United States 24.9 China 11.2 France 5.0 Russia 4.0 France 5.1 Russia 4.3 Turkey 3.5 Japan 4.4 Turkey 4.1 Romania 2.4 Top Top Top * Temperate Region Bumgardner, Johnson, Luppold, Maplesden, and Pepke Markets and Market Forces for Lumber (Ch. 3).
37 Global hardwood lumber consumption Year % change Country Cubic meters consumed per 1,000 people -- U.S % India % Brazil % China % Indonesia % Malaysia % Russia % Japan % France % Germany % Italy % Vietnam % Luppold and Bumgardner Wood & Fiber Science.
38 Summary Industrial markets have fared better than appearance-based markets through the recession/housing downturn Over half of domestic consumption currently in industrial markets Per capita hardwood lumber consumption declining in many major markets (incl. the U.S.)
39 Summary Secondary employment has started to improve, but the overall number of firms is still declining (but at a much slower rate) Similar trend for sawmills Surviving companies have seen steady improvements in sales volume since 2009 Log and stumpage markets returning to a more normal pattern; stumpage was affected by housing downturn

40 Thank you. Questions? Wood & Wood Products 2010