Monitoring Forest Change with Remote Sensing
|
|
|
- Julie Carpenter
- 5 years ago
- Views:
Transcription
1 Monitoring Forest Change with Remote Sensing Curtis Woodcock Suchi Gopal Scott Macomber Mary Pax Lenney Boston University (Dept of Geography and Center for Remote Sensing) Conghe Song (UNC, Dept of Geography)
2 Supported by the Landsat Science Team Monitoring Forest Change over Large Areas with Landsat Monitoring Forest Succession (stand age) via spectral/temporal patterns in Landsat data Estimating tree size using multiresolution imagery
3 Regional to Continental Monitoring of Change in Temperate Conifer Forests We know less about the rates of forest change in the temperate zones of the world than in the tropics. Large area monitoring at high resolution is necessary in the temperate zone. New methods which are more automated and based on generalization are required.
4 250m The top graph shows the proportion of forest change for each 250m pixel of the forestchange map ( ). Most 250m pixels contain low percentages of forest change.the bottom graphs shows that approximately 50% of all forest change in the map occurs in 250m pixels containing less than 50% change. Percent of all 250m pixels containing change Cummulative percent of forest change 30% 25% 20% 15% 10% 5% 0% Percent of forest change within 250m pixels Percent of forest change pixels within 250m pixels
5 500m The top graph shows the proportion of forest change for each 500m pixel of the forest change map. Most 500m pixels contain low percentages of forest change. The bottom graph shows that approximately 50% of all forest change in the map occurs in 500m pixels containing 30% or less of change. Percent of all 500m pixels containing change Cummulative percent of forest change 50% 40% 30% 20% 10% 0% Percent of forest change within 500m pixels Percent of forest change in 500m pixels
6 The distribution of clearcut cover fraction as a function of resolution.
7 Levels of Generalization Within Image: Trained on examples from within an image, a mapping process is applied to the rest of the image (the way most maps are made now). Within Scene: Training from one time (or image) is used to train a mapping process applied to a different image of the same place (or scene). Within Region: Examples from one geographic area are used to train a mapping process applied to neighboring scenes.
8 Levels of Generalization (cont.) Across Regions: Training from one geographic region is applied to another. Across Continents: Training from one continent is applied to another. Across Sensor: Training from data acquired by one sensor is applied to data acquired from another.
9 Change Mapping Methods Need to do once: Train a Fuzzy ARTMAP, Artificial Neural Network A) Only two classes: 1) Forest to No Longer Forest 2) Everything Else B) Training Sites Benefits of the Fuzzy ARTMAP algorithm Algorithm modeled on the human brain No assumptions regarding the distributional properties of the data Many to one mapping
10 Change Mapping Methods For each pair of Landsat Images: Registration (Must be done well) Cloud and Cloud-shadows must be removed Atmospheric Correction (dark-object subtraction) Change Detection Fuzzy ARTMAP which was previously trained Post Processing (per pixel results are noisy): image segmentation Manual Editing (Create and use an image of the change in band 5 between the two dates)

11 Cloud Screening with Landsat 7 Landsat 5, 1997 Landsat 7, 1999 Legend for Cloud Mask: White = Clouds in either image Red = Cloud shadow in 97 Green = Cloud shadow in 99 Purple, Blue = Snow Area shown is 15km x 15km Cloud Mask

12 1. Per-pixel results 2. Segmentation results 3. Proportion of change in each polygon 4. Erosion of image Combination of images 2 and Edited map (black: original - red: edit)
13 Key Points of Mapping processes USDA FOREST SERVICE MAP: 6 Landsat Scenes were used 4 Time periods were covered Maps for each time period and scene were done separately ely ( i.e. 24 classifications ) Only areas of change greater than 2.5 hectares (clearcuts and fires) were mapped BOSTON UIVERSITY MAP: We tried to match their results & used their images We trained on one pair of images from 1992/1995 We applied the trained neural net to 6 pairs of images from 1991 to 1995

14 Forest change maps made with traditional and generalization methods are very similar. Traditional Generalization

15 Close-up of Traditional & Generalization forest change maps. Change polygons are in yellow.
16 Pacific Northwest Forest Change Accuracy Assessments Boston University Map Truth Map Label Change No Change User s Accuracy Change % No Change % Producer s Accuracy 89.5% 97.7% 95.4% USDA Forest Service Map Truth Map Label Change No Change User s Accuracy Change % No Change % Producer s Accuracy 86.3% 98.7% 95.2%
17 Pacific Northwest Forest Change Accuracy Assessments Overall accuracies similar to those of USDA Forest Service (1998) Commission errors include the effects of: a) Misregistration b) Inclusion of non-forest change in forest change map (solvable) Omission errors due largely to poor polygon definition in post processing procedures (probably solvable)
18 Forest Change in the Rockies, Using Landsat 7 Goal:Test the use of methods based on generalization to monitor forest change in the Rocky Mountain Region of Colorado
19 Forest Change in the Rockies, Using Landsat 7 Approach: Train on one pair of images Path-Row Year1 Year (Landsat 5) 94 (Landsat 5) Then apply to other image pairs: Path-Row Year1 Year (Landsat 5) 94 (Landsat 5) (Landsat 5) 97 (Landsat 5) (Landsat 5) 99 (Landsat 7) (Landsat 5) 99 (Landsat 7) (Landsat 5) 99 (Landsat 7)

20 Forest to Non-Forest Change in the Rocky Mtns, CO Landsat 7 `92 to `94 `94 to `97 `97 to `99 (15km x 15km)
21 Area of Forest Change (Scene 3432) with Common Cloud Mask Across All Time Periods 800 Area (km2) Time Periods
22 Forest Change in the Rockies, Using Landsat 7 Accuracy Assessment: Path-Row Year1 Year2 Accuracy (Landsat 5) 94 (Landsat 5) 95% (Landsat 5) 97 (Landsat 5) 96% (Landsat 5) 99 (Landsat 7) 97% (Landsat 5) 99 (Landsat 7) 96% (Landsat 5) 99 (Landsat 7) 100%
23 Forest Change in the Rockies, Using Landsat 7 Results to date: 1. There is a significant drop in forest clearing between in the Rocky Mountain Region. 2. We are having good success generalizing our neural nets, trained on two dates of Landsat 5 imagery for use on Landsat 5 -Landsat 7 combinations.
24 Why is Landsat 7 so Wonderful? Reduced Cost Improved image availability Combination of increased archiving capacity and Long Term Acquisition Plan Improved Accessibility (couple of days) Improved image quality New Panchromatic band (15meter) Best ever calibration Can share images
25 Conclusions 1. Accuracies for methods based on generalization match conventional methods. 2. For monitoring forest change, generalization in time, within geographic regions and across Landsat sensors is possible. 3. The use of methods based on generalization allows for more efficient or frequent monitoring of large areas.
26 Conclusions 4. Lower image cost and increased availability of Landsat 7 data, combined with methods based on generalization, make it practical to begin regional to continental, and eventually global, monitoring of temperate forest change at high spatial resolutions.

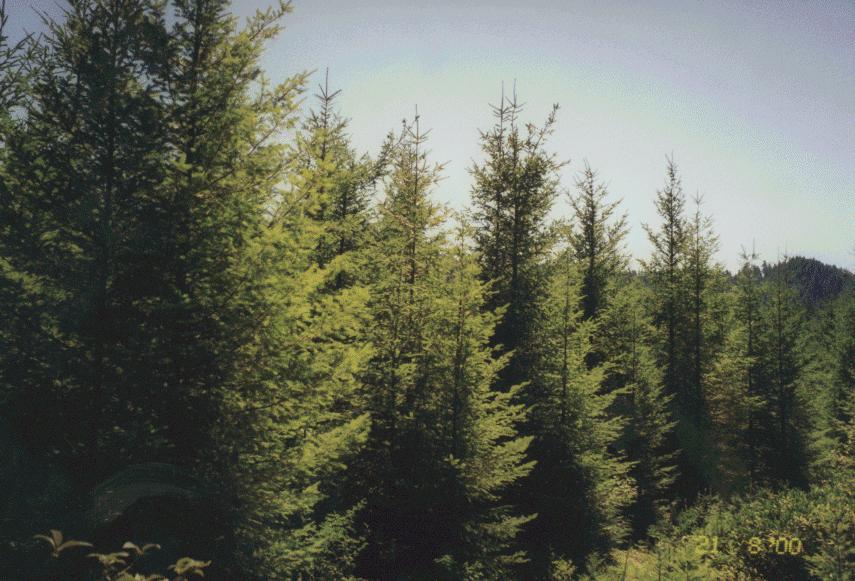
27 Monitoring Succession in Temperate Conifer Forests with Remote Sensing: Implications for Terrestrial Carbon Budgets Conghe Song Department of Geography Boston University Tel: (617) Fax: (617)

28 Cascade Ranges of Oregon (Picture taken Summer 2000)
")
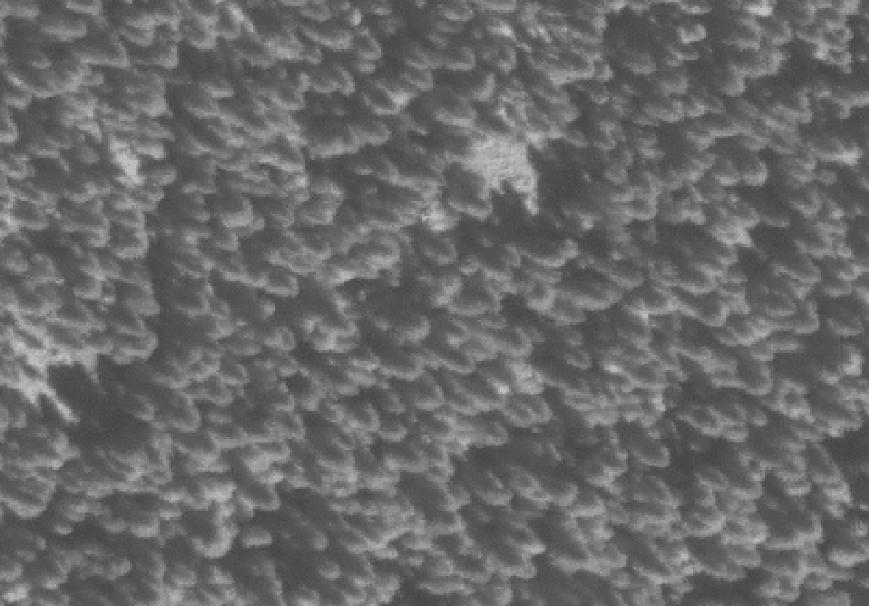
29 Landsat 7 ETM+ Imagery (22 Aug 1999) (RGB=453)


30 An Example of Forest Succession
31 Why Is Forest Succession Important? Sustainable Natural Resource Management Biodiversity Preserve Soil and Water Resources Global Climate Change Forests cover 31% of Earth s land area. They dominate the dynamics of the terrestrial C cycle. Forests contain 86% of the world s above ground C and 73% of the C in the soil.
32 Stand Scale Carbon Fluxes With Forest Succession
33 Mapping Forest Age or Tree Size has proven difficult Substitute Space for Time To characterize succession using stands at varying succession stages from different locations at a single time. Empirical analysis Supervised and unsupervised classification, regression analysis. What have we learned? Reflectance from near-infrared and mid-infrared bands are important in monitoring forest succession. Simple linear approaches using one or more spectral indices generally do not work well in monitoring forest succession with optical imagery.
34 Approach Taken: Follow forest development through time Method Used: Modeling Merged two very different kinds of models: an ecological model of forest succession and a forest canopy reflectance model. Objectives to improve our understanding of the manifestation of forest succession in optical imagery to provide a theoretical basis for improved monitoring forest succession to develop methods more easily transferred to new locations
35 Spectral-Temporal Modeling Platform Canopy BRDF Viewer and Sun Geometry GORT Background Reflectance Canopy Structure (Tree Height, Crown Size, LAI, Tree Density) Species Properties ZELIG Environmental Conditions
36 GORT (Geometric Optical Radiative Transfer) Model Objective: Photon transport through plant Canopies Model Input: Canopy Structure Tree Size Tree Density Leaf Area Canopy Height Crown Shape Background Reflectance Sun and Viewer Geometry Model Output: Canopy BRDF, Scene Component Proportions and Signatures Model Advantages: Integrates the strengths from both the GO and the RT approaches, and is capable of handling the spatial heterogeneity of forest canopies. Li, X., Strahler, A. H. and Woodcock, C. E A Hybrid Geometric Optical-Radiative Transfer approach for Modeling Albedo and directional Reflectance of Discontinuous Canopiies. IEEE Trans. Geosci. Rem. Sens. 33:
37 Results from ZELIG for a Douglas Fir/Hemlock Stand
38 Scene Component Fractions and Signatures Fractions Sunlit Background Shadowed Background Shadowed Canopy Sunlit Canopy Sunlit Canopy Shadowed Canopy Shadowed Background
39 Succession Trajectories of a Natural Douglas Fir/Hemlock Forest Location:H.J. Andrews Nadir View Sun Zen: 30 o Sun Azi: Due South Bands: ~ Landsat TM
40 Topography on Succession Trajectories SZN= 30, SAZ=180 Schaaf et al Topographic effects on bidirectional and hemispherical reflectance calculated with a Geometric-Optical model. IEEE Trans. Geosci. Rem. Sen. 32(6):
41 Validation Efforts 1. Collected sivilcultural histories for stands at different successional stages in the HJA 2. Compiled fourteen Landsat TM and ETM+ images from Analyzed stand spectral histories to see if real stands exhibit the properties of the simulated trajectories
42 Spectral Trajectory For A Successfully Regenerated Stand Stand Age= Path=46, Row=29 Path=45, Row=29 L7 ETM+ (4629) Song et al Classification and change detection using Landsat data: When and how to correct for atmospheric effects? Remote Sensing of Environment. 75:
43 Trajectories After Limiting Dates and Separation of Scenes Stand Age=17
44 More Examples of Succession Trajectories Age=17, Successful Regeneration Age=18, Successful Regeneration Age=16, Successful Regeneration Unsuccessful Regeneration
45 Spectral Trajectories for Young, Mature and Oldgrowth Stands On Slopes Facing Toward the Sun On Slopes Facing Away from the Sun
46 Conclusions for Spectral/Temporal Analysis GORT-ZELIG simulation reveals that the temporal trajectories of forest succession in spectral space are highly nonlinear, including both the rate and the direction of changes. Background conditions strongly influence canopy reflectance during early years of succession. Modeling results provide a theoretical basis for developing new approaches to monitor forest succession using multitemporal images. Multitemporal Landsat TM images show the modeled patterns of spectral/temporal trajectories associated with succession for young stands, but these results are very sensitive to noise from sun and look angles, phenology and topographic effects. Empirical observations indicate a strong effect in older stands due to changes in the composition of the canopy, the effects of which are not currently included in the model.


47 L7 ETM+ 30m IKONOS 4m MS IKONOS 1m Pan IKONOS 1m Pan
48 Spatial Analysis of Forest Succession in Optical Imagery 1 V f ( h) = E{[ f ( x) f ( x + 2 h)] 2 }
49 Disk Scene Model (Jupp et al ) Variograms of Images Component Signatures GORT Disk Size & Density Canopy Structure Tree & Sun Geometry ZELIG Jupp, D.L.B., A.H. Strahler and C.E. Woodcock, 1988,1989. Autocorrelation and Regularization in Digital Images. IEEE Trans. Geo. Rem. Sen. 26(4): and 27(3):
50 Punctual Variogram of Disk Scene Model: V f ( h) Where: D = E{[ f ( x) f ( x + h)] } = σ 2 x+h σ 2 Cov 2 = ( g D g B ) Q1 (1 Q1 ) f ( h) = ( g D g B ) 2 Q 2 1 g D = Disk Color g B = Background Color Q 1 = Background Fraction λ = Stem Density s = h/d 1 T(s)=Overlap Function 2 ( e λat Cov ( s ) f ( h) 1) x
51 Variograms of a Forest in Succession
52 Effects of Disk(tree) Size on Sills with Regularization Punctual 2 σ = 2 ( g D g B ) Q1 (1 Q1 ) Disk(tree) Size Cover=50% g D =100 g B =50
53 Effects of EFOV and Disk(tree) Size on Regularized Sill Cover=50% g D =100 g B =50 D2=EFOV, D1=Disk(tree) Size

54 Validation of Spatial Properties with IKONOS Imagery One meter Pan Image from IKONOS for an Oldgrowth Two Component Equivalent Sunlit Canopy & Background
55 Observed Variograms with Regularization
56 Sills of Observed Variograms with Regularization (250+ yrs) (40 yrs) (20 yrs)
57 Conclusions for Spatial Analysis Spatial properties of remotely sensed imagery are the combined effects of object size, cover and the pixel size. Spatial properties of multiresolution imagery are diagnostic of tree size. This study provides the theoretical basis to map tree size using multiresolution imagery. Tests using IKONOS imagery show the modeled spatial patterns with tree size as regularization.
58 Overall Conclusions Monitoring forest change over large areas using methods based on generalization appear to be feasible. Multitemporal Landsat TM images show the modeled patterns of spectral/temporal trajectories associated with succession and indicate the potential for using multitemporal imagery to map stand age (as long as you control carefully effects from the atmosphere, sun and look angles and phenology). Observed spatial patterns in IKONOS imagery show the modeled effects of changes in pixel and tree size, indicating the potential for mapping tree size from multiresolution imagery.