BOULEVARD TREE FAILURES DURING WIND-LOADING EVENTS O N E S T O R M O N E D A Y - O N E C I T Y
|
|
|
- Alison Neal
- 5 years ago
- Views:
Transcription
1 BOULEVARD TREE FAILURES DURING WIND-LOADING EVENTS O N E S T O R M O N E D A Y - O N E C I T Y
2 TREES AND WINDS COLLIDE EVERYWHERE

3 NORTHERN WALES WEEK OF 2/10/14 Robert Parry Jones photo

4 NORTHERN WALES WEEK OF 2/10/14 Robert Parry Jones photo

5 NORTHERN WALES WEEK OF 2/10/14 Robert Parry Jones photo

6 NORTHERN WALES WEEK OF 2/10/14 Robert Parry Jones photo

7 EAST YORKSHIRE, U.K. WEEK OF 2/10/14 Photo: Hull Daily Mail

8 EAST YORKSHIRE, U.K. WEEK OF 2/10/14 Photo: Hull Daily Mail

9 CANBERRA, AUSTRALIA 2/19/14

10 LONDON TELEGRAPH 2/19/14

11 FEW TREES SURVIVE IN DIRECT PATHS OF DESTRUCTIVE WINDS

12 EXCEPT FOR SMALL ONES Photo: Russell Kennedy

13 MOST SURVIVE OUTSIDE OF DIRECT PATHS OF DESTRUCTIVE WINDS

14 MOST SURVIVE OUTSIDE OF DIRECT PATHS OF DESTRUCTIVE WINDS Photo: Ben Johnson
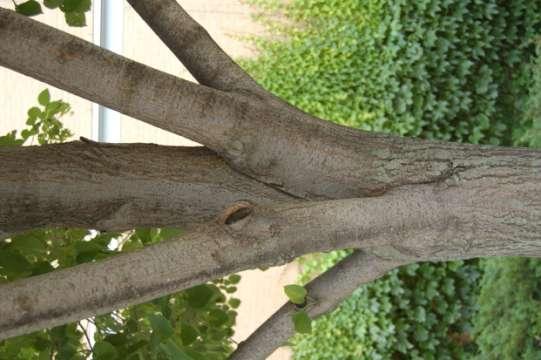
15 WHY DON T ALL TREES FAIL?
16 THE STORM FAILURE TRIANGLE Loading Event Site Characteristics Tree: Species, Condition and Defects Storm Failure Triangle

17 WIND LOADING EVENTS Thunderstorms mph Sustained winds 40 mph or less Gusts 60 mph or less Straight-line winds 55+ mph Tornadoes 40+ mph

18 SITE CHARACTERISTICS Degree of Friction Limited Root Plate High Water Table Shallow Soil Profile Degree of Disturbance

19 ROOT PLATE LIMITATIONS 10 +

20 DEGREE OF DISTURBANCE Photo: J. Sinclair

21 THE TREE Species Architecture Condition Defects


22 SPECIES ARCHITECTURE Canopy Density Size Decurrent vs Excurrent Weight Displacement

23 TREE CONDITION

24 TREE DEFECTS

25 MOST COMMON DEFECTS Weak Branch Attachments Low Codominant Leaders Decay Stem Girdling Roots Severed Root Systems


26 THREE MAIN TYPES OF STORM DAMAGE* Canopy Failures Trunk Failures Complete Failures *University of Minnesota Surveys 1995-Present
27 THREE MAIN TYPES OF DAMAGE Canopy Damage Broken Branches Failed Codominants Failed Attachments Stem Failures Failure Between Lowest Branch and Groundline Total Failures Tips (windthrow) Partial Tips Breaks
* *University of Minnesota")
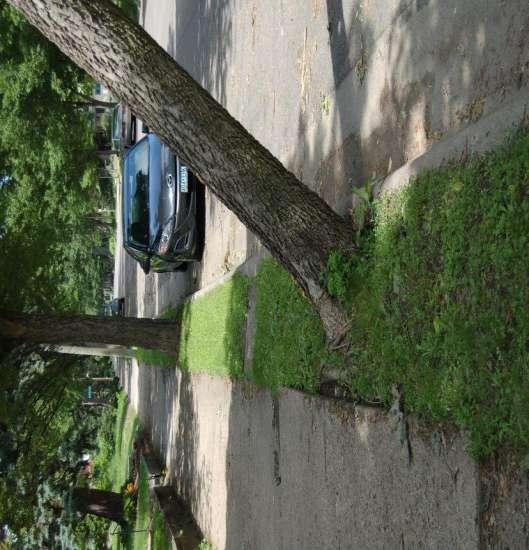
28 MOST COMMON DAMAGE: TOTAL FAILURE (54%)* *University of Minnesota
* *University of Minnesota")
29 SECOND MOST COMMON: CANOPY DAMAGE (30%)* *University of Minnesota
* *University of Minnesota")
30 THIRD MOST COMMON: TRUNK FAILURE (16%)* *University of Minnesota

31 WHO OWNS THE TREES PAYS FOR CLEAN-UP?

32 MINNESOTA - JUNE 21, 2014 Storms Began in Western Minnesota 85 m.p.h. Winds West of Metro Thunderstorm in a.m. 45 m.p.h. Winds in Metro 2.5 Rain in p.m. 2 nd Storm in Early Evening <70 m.p.h. Winds in Metro Photo: S. Stiteler

33 UTILITY DISRUPTION AND REPAIR Photo: J. Wiltgen
34 NORTHERN STATES POWER VM COSTS: FOUR DAYS OF STORMS Most Expenses in Metro Area Vegetation Management Spent: $1.5M 285 Contracted Tree Workers to Respond Trees Worked: 3,000 for Outages 2,000 for Non-outage Restoration

35 NOT AN APPROVED XCEL SUB- CONTRACTOR
36 MINNEAPOLIS BOULEVARD TREE FAILURE STUDY Limited to Boulevard Trees Damage Limited to Tip-overs or Partial Tips Only Trees in Path of Storm


37 Winds and Damage Followed a Path from Northwest Minneapolis to Southeast Minneapolis
38 VARIABLES STUDIED Species DBH Boulevard Width Sidewalk Replacement w/in 5 Years Curb Replacement w/in 5 Years Damage to Curb and/or Sidewalk Stem Girdling Roots and Extent Soil Texture Soil ph Soil 6 and 12 Depths

39 TIPS/PARTIAL TIPS


40 SIDEWALK OR CURB REPLACEMENT


41 SIDEWALK OR CURB REPLACEMENT

42 DAMAGE TO CURB OR SIDEWALK

43 DAMAGE TO CURBS OR SIDEWALKS
44 RESEARCH DESIGN Research Design by University of Minnesota Department of Statistics, Statistical Consulting Center (UMN/SCC) Sampling Units were North/South Block Street Segments (BSS) A BSS Had Two (2) or More Tipped or Partially Tipped Trees All Trees on All BSS Were Assessed All Statistical Analyses Conducted by UMN/SCC
 AS SAMPLING")
45 BLOCK STREET SEGMENTS (BSS) AS SAMPLING UNITS

46 FULL AND PARTIAL TIP FAILURES


47 RESULTS: SPECIES 1. Littleleaf Linden Most Likely to Fail 2. Green Ash 3. Maples 4. Elms 5. Others
48 RESULT: SPECIES Tree species, when combined with replacement work, was also significant, with Tilia most likely to fail, followed by Fraxinus (ash), Acer (maple) and Ulmus (elm) in order. Essentially, when replacement work was done near any one of these trees, the rate of failures more than doubled (p=.0001)


49 RESULTS: D.B.H. 1. Correlated to Tree Species 2. Probability that the Relationship was Coincidental= <0.10%
50 RESULTS: D.B.H. Tree size, measured as trunk diameter (DBH), was significantly related to failure rates, with larger tree diameters more likely to fail (p=.008) independent of whether sidewalk replacement work was conducted.

51 RESULTS: BOULEVARD WIDTH
52 RESULTS: BOULEVARD WIDTH Boulevard width was significantly related to tree failures (p=.011) only when sidewalk replacement work was conducted. For example, a Tilia in a boulevard four (4) feet wide that had experienced sidewalk replacement damage to its root system had a failure rate of 29.4%. The same tree in an eight (8) foot wide boulevard had a failure rate of 14.6%.
53 RESULTS: SOIL PROPERTIES Soil ph: no correlation Soil % Sand: no correlation Soil % Silt: no correlation Soil % Clay: no correlation Soil Organic Matter: no correlation Soil Compaction: Compaction at 6 Correlated with Tree Failure Only When Sidewalk Replacement was Done p=.019
. For illustration, when no replacement work was done, the average Tilia had a 10.6% chance of root failure; this increased to 21.")
54 RESULTS: SIDEWALK REPLACEMENT The major finding is that having replacement work done increased the odds of root failure by 2.24 times (95% CI: 1.77, 2.83; p<0.0001). For illustration, when no replacement work was done, the average Tilia had a 10.6% chance of root failure; this increased to 21.0% when replacement work was done.

55 RESULTS: SIDEWALK REPLACEMENT
56 TAKE-HOME RECOMMENDATIONS 1. Consult with Foresters/Horticulturists/Arborists. 2. Wider is Better for Boulevards. 3. Larger Trees Need Larger Boulevards. 4. Cutting Roots Jeaporadizes Stability. 5. Curve Sidewalks Around Trees. 6. Ramp Sidewalks Instead of Cutting Roots.

57 NARROW BOULEVARDS + BIG TREES = INSTABILITY
")

58 WIDE (8+ FEET) BOULEVARDS

59 CUTTING ROOTS = INSTABILITY

60 CURVE SIDEWALKS AROUND TREES

61 RAMPING TO REDUCE ROOT LOSS