Yield-SAFE. A parameter-sparse process model for growth and resource use in agro-forestry systems
|
|
|
- Cuthbert Marshall
- 5 years ago
- Views:
Transcription
1 Yield-SAFE A parameter-sparse process model for growth and resource use in agro-forestry systems Wopke van der Werf, Karel Keesman, Klaas Metselaar, Martina Mayus, Roel Stappers, Paul Burgess, Anil Graves, Lynton Incoll, David Pilbeam, Christian Dupraz & Herman van Keulen
2 Purpose Predict tree and crop growth and yield over life span of tree stand Based on robust eco-physiological principles & processes: light interception, water use efficiency Simple and parameter-sparse, to enable calibration with limited data To be used in up-scaling for farm economic and land use studies

3 Part of: SAFE project: Silvo-Arable Agroforestry for Europe Anti-pole of Hi-SAFE: Detailed and complex model for agroforestry systems Building block in: Farm-SAFE and Econ-SAFE: Models for management evaluation at the farm, landscape and higher decision levels European Union Contract n QLK5-CT ; August 2001-January 2005


4 ak wheat - Spain Poplar Barley - UK
5 Model components Tree Number of shoots Leaf area per shoot Light interception Potential growth Water extraction Water-limited growth Crop Crop leaf area index Light interception Potential growth Water extraction Water-limited growth Soil Soil water balance
6 Tree species Poplar: Populus sp. Wild cherry: Prunus avium Walnut: Juglans sp. Pine: Pinus pinea Mediterranean oak: Quercus ilex Crop species Winter wheat Durum wheat Maize Sunflower Alfalfa Simple descriptions of crop & tree biology are essential
7 Only 7 state variables 1. biomass of crop 2. biomass of tree 3. leaf area of crop 4. leaf area of tree 5. number of shoots of tree 6. heat sum 7. available soil water
8 3 outside influences 1. Temperature -> phenology 2. Radiation -> potential growth 3. Rainfall -> water-limited growth
9 50 years 365 days Crop phenology & Tree branching Crop Tree Resource capture & use Radiation interception; Radiation use Water extraction; Water use Soil water balance Radiation Temperature Rain
10 Parameters for the crop Light extinction coefficient of the crop - Radiation use efficiency of the crop g DM / MJ Transpiration coefficient of the crop g water / g DM Specific leaf area of crop m 2 / g leaf DM Heat sum [S h ] at crop harvest Cd Lower threshold for crop development C Initial partitioning P 0 to leaves - S 1, at which P starts to decline Cd S 2, at which P = 0 Cd
11 P: Partitioning to leaves (-) P 0 S h : harvest S 1 S 2 S: Heat sum (ºCd)
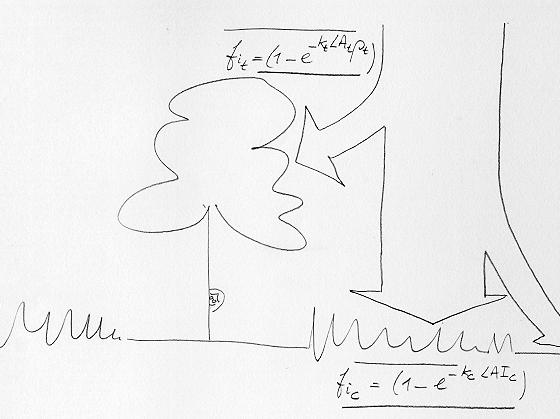
12 Growth of trees: db dt t = ε t ( 1 kl ) t t e I Growth of crop: db dt c c kl t t I e I c = = ε ( kl 1 ) c c e I c Biomass (B) Radiation use efficiency (ε) Radiation extinction coefficient (k) Leaf area index (L) Incoming radiation (I)
13
14 arameters for the trees ight extinction coefficient of the trees - adiation use efficiency of the trees g DM / MJ ranspiration coefficient of the trees g water / g DM pecific leaf area of tree leaves m 2 / g leaf DM aximum leaf area of a single tree shoot m 2 leaf ime constant of leaf area growth of a tree shoot d elative rate of attrition of standing tree biomass d -1
15 For crop & trees: parameters describing water extraction and water use efficiency 1 w f c pf Relationship between the reduction factor for the rate of crop/tree growth (y-axis) and the pf of the soil (pf c = 2.2 and PWP = 4.2).
16 Parameters for the soil pf relationship (4 parameters) Depth of profile Parameter affecting drainage
17 Overall 7 state variables & differential equations 11 crop parameters 9 tree parameters 6 soil parameters 3 external inputs (radiation, temperature, rain) Starting conditions: Emergence dates for crops, planting date for trees
18 Calibration approach (1) With sufficient data: Set-membership approach (virtual example) (2) Currently (while scrambling for data): Parameter optimization using yield tables Validation where possible (Poplar-wheat example)
19
20 Set-membership approach is presently hampered by lack of yield data from real agroforestry experiments in Europe Therefore alternative approach: Parameter optimization using yield tables from forestry Distinguishing broad eco-regions, e.g. Atlantic, Mediterranean, etc.
21 Example: Calibration of poplar tree growth, using forestry yield tables Source: Christie, J.M. (1994) Provisional yield tables for poplar in Britain. Forestry Commission Technical Paper 6. Forestry Commission, Edinburgh.
22 50 Calibrated height of poplar in the UK Height (m) Fit Yield class 1 Yield class 1 Yield class Year since planting
23 6 Calibrated volume of poplar in the UK 5 4 Volume per tree (m3) 3 2 Fit Yield Class 1 Yield class 1 Yield class Year since planting
 since 1992, and still")
24 Validation with 2 long term data sets being collected at Cranfield University & The University of Leeds (UK) since 1992, and still running
25 18 Predicted and observed height of poplar in Leeds Height (m) 10 8 Measured heigh Simulated heigh Years since planting
26 Predicted and observed volume of poplar in Cranfield Volume per tree (m3) Estimated volume per tree Simulated volume per tree Year since planting
27 Predicted and observed (smoothed) crop growth (Leeds) Growth rate crop under tree canopy (kg.ha-1.day-1) Theoretical growth rate Estimated growth rate Year since planting
28 Wrap-up New parsimonious model for competitive resource capture and resource use in agroforestry Simple innovative model concept with only 7 state variables Suitable for yield predictions and uncertainty analysis First simulation results encouraging
29 Challenge to collect data for calibration Challenge to aggregate to eco-regions, and test the model for specific sites in those eco-regions Model further used in economic evaluations and land-use studies See other presentations from SAFE project Visit our website: Or: Google SAFE agroforestry