Urban Ecosystem Restoration
|
|
|
- Byron Perkins
- 5 years ago
- Views:
Transcription
1 Urban Ecosystem Restoration Scott Courtright Coastal and Natural Resources Manager URS Assessing and Managing the Urban Forest and Calculating the Benefits 1

2 2 Natural Ecology Native soils Primarily-Native flora Primarily-Native fauna Natural features and characteristics Natural biotics, hydrology Natural established Balance

3 3 Altered Ecology Removal of the Vegetation Exposure of the soils Altered hydrology Disturbance of the naturally occurring systems Often, not balanced Disturbance leads to invasive species

4 4 July 31, 2014 Urban Systems: Issues and Challenges Impervious surfaces Lack of planning Lack of understanding Lack of education Change not desired Budget constraints Urban Sprawl Employ the wrong expert
5 5 Sprawling Facts Over a 20-year period, the 100 largest Urbanized Areas sprawled out over an additional 14,545 square miles. That was more than 9 million acres of natural habitats, farmland and other rural space that were covered over by the asphalt, buildings and sub-divisions of suburbia. And that was just for the half of Americans who live in those 100 cities. (


6 Impacts from Urban Sprawl Direct Excavating of sensitive ecology, such as wetlands Filling and reshaping streams Destruction of Critical Habitat Loss of natural areas Altering of the Hydrology Indirect Non-point Source Pollution Sedimentation Erosion Altering of the Historical Ecology Diversity shift, altering ecology 6
7 7 Urban Ecosystem Ecosystem- a natural unit consisting of all plants, animals and micro-organisms (biotic factors) in an area functioning together with all of the physical (abiotic) factors of the environment. An ecosystem is a unit of interdependent organisms which share the same habitat.

8 8 The Urban Ecosystem

9 9 Restoring the Urban Ecology Grass roots-citizens Ecologists Environmental Scientist Geologist Urban Planners Arborists Architects Construction/Landscape Government-Federal, State and Local Archeologists Aligned Groups

10 10 Building Green Cities Desire and attitude Learn from the past mistakes Multi-disciplined applied scientific approach Willing politics Education Tougher standards Smart planning Smart developments Smart growth Right Tree Right Place Restoration of altered system

11 11 Assessing the Urban Forest What are some tools to help Arborist/Planners manage trees in the landscape and quantify the value of trees emperically?

12 12 ArborPro-Tree Assessment and Management

13 13 July 31, 2014 ArborPro Software
14 14 Tree Management- New Orleans City Park Inventory- nearly 10,000, Trees Greater than 4 DBH GPS Located each, and mapped in GIS Each Tree Evaluated Each Tree diagnosed and given a prescription At Project Completion: Approximately 2,500 Trees Pruned Approximately 500 Palm Trees Pruned Approximately 400 Trees Removed and Stumps Ground Approximately 200 Trees with all vines removed

15 15 The Benefits of Trees Trees combat the greenhouse effect Trees clean the air Trees provide oxygen Trees cool the streets and the city Trees conserve energy Trees save water Trees help prevent water pollution Trees help prevent soil erosion Trees shield children from ultra-violet rays Trees provide food Trees heal Trees reduce violence Trees mark the seasons Trees create economic opportunities Trees are teachers and playmates Trees bring diverse groups of people together Trees add unity Trees provide a canopy and habitat for wildlife Trees screen Trees provide wood/paper Trees increase property values Trees increase business traffic Project Challenge Can we calculate the ecological/environmental benefits of the Greenbelt area? *according to
16 16 i-tree- USDA Forest Service i-tree is a state-of-the-art, peer-reviewed software suite from the USDA Forest Service that provides urban forestry analysis and benefits assessment tools. i-tree can quantify the structure of a community of trees and the environmental services that those trees provide. An Arborist equipped with i-tree can run the analysis, and also interpret the findings. With i-tree, the Arborist can more effectively plan to maximize the benefit objectives of the target site.

17 17 Study Area Logistics The Greenbelt was randomly sampled with 25 1/10 th acre plots Roughly, 200 acres, in a previously highly urbanized area, that has been converted to a park-like setting, for buffer and wildlife enhancement One field crew to collect plot data, GPS Handheld device Mapping services provided in the field as well as desk top assistance

18 18 July 31, 2014 Data Analysis by i-tree URS Field Team collected data, performed QA/QC Data electronically uploaded to USDA for processing Draft report returned from USDA with data analysis report

19 19 July 31, 2014 Urban Forest Age Distribution at the Greenbelt Roughly 40% of the study area is treed 78% of the trees are Native 22% are Exotic, and should be controlled The Greenbelt has a diverse age distribution, regular plantings should occur to maintain the age distribution and diversity


20 20 Species Diversity at The Greenbelt Estimated 1,680 trees An estimated tree cover of 40% Greater than 12 species inventoried Site has a mixture of Native and Exotic species The two exotic tree species can become problematic if not controlled, Camphor Tree and Tallow Tree


21 21 Tree/Groundcover With trees covering roughly 40% of the green space at the Greenbelt, what is the other 60%? Grass vegetated areas comprise the vast majority of the groundcover at the Greenbelt Certainly, grass cover is more beneficial than impervious surfaces, also, indicates the amount of available tree planting spaces The wildflower areas are not called out in this report, and it is assumed that the wildflower area is counted in the Herb and Grasses
, scores the highest Importance Value.")
22 22 Tree Importance Value The environmental benefit of a tree is directly correlated to the Leaf Area of the tree, and the quantity of those trees. For the Greenbelt, the Live Oak (Quecus virginiana), scores the highest Importance Value. The Live Oak is a high performer, because it does not go dormant, rather it has leaves all year giving benefit to the Environment. Note, the top three species are Oak species.
23 23 Trees Reduce Air Pollution General Trees and other plants make their own food from carbon dioxide (CO 2 ) in the atmosphere, water, sunlight and a small amount of soil elements. In the process, they release oxygen (O 2 ) for us to breathe. Trees: Help to settle out, trap and hold particle pollutants (dust, ash, pollen and smoke) that can damage human lungs. Absorb CO 2 and other dangerous gasses and, in turn, replenish the atmosphere with oxygen. Produce enough oxygen on each acre for 18 people every day. Absorb enough CO 2 on each acre, over a year's time, to equal the amount you produce when you drive your car 26,000 miles. Trees remove gaseous pollutants by absorbing them through the pores in the leaf surface. Particulates are trapped and filtered by leaves, stems and twigs, and washed to the ground by rainfall. Greenbelt Project
 The larger the tree gets the more carbon it holds The healthier the tree is, the longer the tree grows, the longer the carbon is held by the tree.")
24 24 Carbon Sequestration at the Greenbelt As the discussion of global warming heats up, so does the term Carbon Sequestration Trees help in the global warming battle by sequestering atmospheric carbon (C2O) The larger the tree gets the more carbon it holds The healthier the tree is, the longer the tree grows, the longer the carbon is held by the tree. Trees can also reduce the energy used by communities by shading the buildings, thus reducing emissions In an urban setting, right tree right place, care and maintenance is the key to success

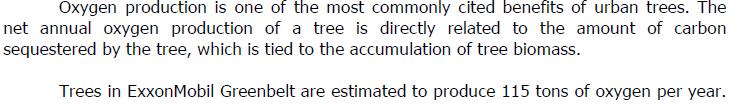
25 25 Estimated Oxygen Production

26 26 Structural Values The structural value of a tree impacts the property value if trees are healthy, then the value of the tree is added to the property In an urban setting, it is an attempt to value to tree in terms of benefit to that specific tract i.e. shade, aesthetics, enjoyment, etc. Live Oaks are ranked as having the highest value i-tree calculated the structural value at $ 1.67 Million for the Greenbelt

27 27 Estimated Rainfall Interception
28 28 Project-Summary of Findings Number of trees: 1,680 Tree cover: 40% Most common species: Live Oak (Quercus virginiana), Shumard Oak (Quercus shumardii), Crape Myrtle (Lagerstroemia indica) Percentage of trees less than 6" (15.2 cm) diameter: 10% Pollution removal: 2 tons/year ($17.2 thousand/year) Nitrogen dioxide removal is equivalent to annual nitrogen dioxide emissions form 9 automobiles Nitrogen dioxide removal is equivalent to annual nitrogen dioxide emissions from 6 single-family houses Carbon monoxide removal is equivalent to annual carbon monoxide emissions from 1 single-family house Sulfur dioxide removal is equivalent to annual sulfur dioxide emissions from 148 automobiles Sulfur dioxide removal is equivalent to annual sulfur dioxide emissions from 2 single-family houses Particulate matter less than 10 micron (PM10) removal is equivalent to annual PM10 emissions from 1,790 automobiles Particulate matter less than 10 micron (PM10) removal is equivalent to annual PM10 emissions from 173 single-family houses Carbon storage: 1,930 tons ($137 thousand) Annual carbon storage is equivalent to the annual carbon emissions from 1,160 automobiles Annual carbon storage is equivalent to annual emissions from 581 single-family houses Annual carbon storage is equivalent to amount of carbon emitted in the ExxonMobil Greenbelt in 116,028 days Carbon sequestration: 45 tons/year ($3.21 thousand/year) Annual carbon sequestration is equivalent to amount of carbon emitted in ExxonMobil Greenbelt in 2,700 days Oxygen production: 115 tons/year Rainfall interception: (ft3/yr), $ 4,457/year Structural values: $1.67 million Total Calculated Ecological/Environmental Benefit: over $2 Million annually

29 29 Urban Forest Assessment, Evaluation and Benefit Calculation Assessment of Greenspace components (Trees, Shrubs, etc.) Capture assessment into a tool for management of the system itree to perform Benefits Assessment

30 30 Conclusion and Questions Scott Courtright URS