Environmental Benefits Analysis for Trees in Clifton, Ohio
|
|
|
- Coral Miller
- 5 years ago
- Views:
Transcription


1 Environmental Benefits Analysis for Trees in Clifton, Ohio T. Davis Sydnor and Sakthi Subburayalu School of Environment and Natural Resources as well as Greene County Master Gardeners Ohio State University Extension March 16, 2011
2 An Analysis of Tree Benefits for Clifton, Ohio EXECUTIVE SUMMARY An inventory of public trees on the streets and in the parks of the Village of Clifton, Ohio was conducted by Ohio State Extension and its Greene County Master Gardeners in A total of 165 trees were inventoried during this period. A common bid price for this service is $4.00 per tree and thus the inventory represents a value of $660. Most importantly, however, is that the community now has a tree inventory in a form that can be used to better manage the tree resource of Clifton. Benefits mentioned above do not include the value of the subsequent analysis and report by The Ohio State University s School of Environment and Natural Resources which would conservatively add another $11,500. Analysis of the inventory data was done using itree, a software suite distributed by the USDA Forest Service. The specific program in the itree suite used to identify benefits was istreets. This program allows community leaders interested in making informed decisions about Clifton s green infrastructure or to explore many aspects including biodiversity and values of environmental services such that environmental benefits can be enhanced to reduce costs and the carbon footprint of Clifton. A long standing rule of thumb for taxonomic biodiversity is the guideline which suggests that no more than 10 percent of trees should be from the same species, no more than 20 March percent 27, should 2008 be from the same genera, and no more than 30 percent should be from the same family. In Clifton, maple, ash and perhaps oak exceed one or more guidelines (Table 1). We would recommend against any further plantings of maple until guidelines are met. No more ash should be planted because of emerald ash borer (EAB) and represents 52 individuals or 30 the public trees and 29 the canopy (Table 3). This will represent a noticeable loss of canopy if EAB should destroy all American ash as predicted. Ash removal and/or treatment costs will need to be addressed by informed community leaders. Ohio State Extension can assist in developing considered plans including costs and probabilities of treatment vs. no treatment. There is no single answer for communities facing this problem. Based on the inventory and an earlier study, ash removal costs in Clifton would cost nearly $28,000 dollars with replacement costs adding another $15,000 for total costs over $43,000. Larger growing deciduous trees constituting 2% or less of Clifton s canopy cover that could be used to replace the ash include the Kentucky coffeetree; Shumard, swamp white, and chinquapin oaks; American sycamore, buckeye, basswood, zelkova, and honeylocust. Under ideal conditions tree numbers among various size classes should be stable and then decline as trees reach their mature size and older trees die..clifton generally has smaller sized (less than 12-inch DBH) trees even for larger growing trees such as oaks (Tables 2 and 3). Only maple and oak are found in larger sizes in any numbers. Table 4 shows that fewer maples and oak produce a larger percentage of canopy cover than smaller growing crabapples and plums. This reinforces the need for planting larger statured trees such as preferred in a Toledo, OH resident preference survey whenever possible although maples should be avoided for biodiversity. The importance value is a measure of the overall contribution of the species to the sum of environmental benefits delivered. A major benefit of urban trees is their ability to intercept rainfall and reduce storm water runoff (Table 5). Storm water runoff is a major cost for Ohio communities. Columbus, OH is embarking on a multi-billion dollar sewer and 2
3 storm water upgrade for the community. Public trees, alone, in Clifton intercept nearly 213,000 gallons of storm water annually at a savings to the community of nearly $5,500 dollars per year. This could be could be increased with strategic plantings of larger growing trees and time for them to reach maturity. Carbon sequestration, as reported here, represents the carbon removed from the air and stored in the trees (Table 6). Nearly 566,000 pounds or 283 tons of carbon have been stored by the 165 trees over time. Clifton s trees currently sequester and avoided 82,000 lbs of CO 2 yearly (Table 8) and would represent carbon credits worth $618 per year if a carbon trading system were in place and if a system for accounting for them were available for community trees. These are net gain figures and include deductions for tree losses and maintenance. Annual CO 2 benefits vary by species and size but average $3.74 per tree per year while larger honeylocusts average $8.87 per tree per year or twice as much. Strategic plantings could increase this substantially and be a significant tool in reducing Clifton s carbon footprint. Energy savings by trees are particularly important in view of the citizenry s increasing concern over the nation s energy dependency. Energy is saved by shading structures, evaporating water (evapotranspiration) and reducing wind speed around structures (Table 7). Clifton trees save the community nearly $1,900 in electricity and nearly $3,500 in natural gas for a total savings of $5,324 or an average of $32 per tree per year. Strategic plantings of larger statured trees to enhance energy savings has real potential especially in Clifton as trees mature. Annual air quality savings (reduced ozone, nitrous and sulfur oxides as well as particulate matter) for the public trees is $884 (Table 9). This includes both direct savings ($176) from Clifton s trees and avoided pollution which is much greater at $740. Avoided pollution is pollution not generated at power source because energy was not required (avoided) by the community. The total annual air quality benefits are discounted by $32 for the volatile emissions (BVOC) from the trees themselves. While these savings are small the impact depends on whether or not individuals have a condition such as asthma which renders them sensitive to air pollutants such as dust (PM 10 ). Aesthetic and miscellaneous benefits from trees contribute nearly $5,200 annually to Clifton in the form of increased property values and enhanced community identity among other things (Table 10). Research in public housing has shown that areas with trees facilitate interaction among residents and lead to reduced domestic violence and more sociable environments. Customer surveys suggest that customers prefer to spend their money and time in commercial streetscapes with trees and are willing to spend up to 11% more in such an environment. When all benefits are included the 165 trees contribute an average of nearly $106 per tree annually to the Clifton community (Table 11). vary in their annual benefits but mature size, longevity, and maintenance costs are but some of the factors determining annual benefits. This would be well in excess of their maintenance and planting costs for Clifton s trees. The Clifton budget for trees maintenance was estimated to be $360 based on the budget of $2 per capita required for Tree City USA status by the National Arbor Day Foundation and Clifton s population of 179. Thus while the 165 trees on the grounds require relatively little care per year they deliver $17,500 in annual benefits from storm water abatement, carbon sequestration, energy savings, air quality, aesthetic benefits, and the like. This is more than a 5000% return on investment. Returns are likely high but Ohio communities studied routinely discover returns on their tree maintenance dollars of 2-300% and Toledo had a 436% annual return with one of the larger tree maintenance budgets in Ohio. Further, unlike most community infrastructure, annual tree benefits per tree continue to increase over a tree s lifetime especially as trees are allowed to mature. 3


4 Table 1. Distribution of the Most Common Trees in Clifton, Ohio Arranged from Most to Least Commonly Seen Percent Ash Maple Oak Black walnut 8.48 Elm 7.88 Hackberry 4.24 Boxelder 1.82 Honeylocust 1.21 Flowering crabapple 1.21 Cherry plum 1.21 OTHER SPECIES
 of each Tree by Common Names Diameter")

5 Table 2. Relative Age Distribution of the 10 Most Commonly Planted Trees in Clifton as a Percentage (%) of each Tree by Common Names Diameter 4.5 feet (DBH) class (in) Ash Maple Oak Black walnut Elm Hackberry Boxelder Honeylocust Flowering crabapple Cherry plum Clifton total
6 Table 3. Population of Clifton Trees by Common Name, Tree Type and Size (DBH) Class. DBH Class (in) Broadleaf Deciduous Large (BDL) Maple Oak Black walnut Hackberry Hickory Poplar Broadleaf Deciduous Medium (BDM) Ash Elm Boxelder Honeylocust UNKNOWN Broadleaf Deciduous Small (BDS) Flowering crabapple Cherry plum Eastern redbud Dogwood Conifer Evergreen Large (CEL) Pine Conifer Evergreen Small (CES) Arborvitae Clifton


7 Table 3A Estimated Expenses for Ash Removal and/or Replacement for Clifton Street Trees SIZE NUMBER REMOVAL COSTS REMOVAL REMOVAL W/ REPLACEMENT COST PER TREE TOTALS REPLACEMENT $375 $750 $290 $1, $375 $4,125 $290 $7, $375 $7,125 $290 $12, $675 $8,100 $290 $11, $675 $2,700 $290 $3, $1,290 $5,160 $290 $6, $1,625 $0 $290 $ $2,150 $0 $290 $0 >42 0 $2,150 $0 $290 $0 REMOVAL ONLY TOTALS $27,960 REMOVE + REPLACE TOTALS $43,040 7
 Leaf Area Canopy Cover (ft2) Canopy Cover Importance Value Maple 41 24.")


8 Table 4. Clifton, Ohio Trees Listed by Common Name from Greatest to Least Importance Value. Number of Trees Trees Leaf Area (ft2) Leaf Area Canopy Cover (ft2) Canopy Cover Importance Value Maple Ash Oak Black walnut Elm Hackberry Boxelder Honeylocust Cherry plum Flowering crabapple OTHER TREES Clifton


9 Table 5. Annual Storm Water Benefits of Clifton, Ohio Trees by Ordered by Decreasing Benefits/Tree Rainfall Interception (Gal) Tree Numbers $ Avg. $/tree Honeylocust 4462 $ $60.46 Black walnut $ $50.66 Oak $1, $49.40 Boxelder 5347 $ $48.31 Maple $1, $39.23 Ash $1, $28.58 Hackberry 2850 $ $11.03 Elm 3930 $ $8.19 Cherry plum 272 $ $3.68 Flowering crabapple 137 $ $1.86 OTHER STREET TREES 5311 $ $20.56 VILLAGEWIDE TOTAL $5, $


10 Table 6. Stored CO 2 Benefits in the Trees in Clifton, Ohio by Ordered by Decreasing Benefits per Tree stored CO2 (lbs) Tree Numbers $ Avg. $/tree Boxelder $ $55.61 Oak $1, $46.96 Honeylocust 9780 $ $36.67 Black walnut $ $33.92 Maple $1, $28.38 Ash $1, $22.46 Elm 6848 $ $3.95 Cherry plum 922 $ $3.46 Hackberry 1845 $ $1.98 Flowering crabapple 356 $ $1.33 OTHER STREET TREES 5465 $ $12.91 VILLAGEWIDE TOTAL 56,5979 $4, $

11 Table 7. Annual Energy Benefits of Clifton, Ohio Trees by Common Name and Decreasing Dollars/Tree Electricity (MWh) Electricity Natural Gas (Therms) Natural Gas Tree Numbers $ Avg. $/tree Honeylocust 0.6 $44 76 $74 $ $59.28 Black walnut 3.0 $ $409 $ $45.47 Oak 4.2 $ $569 $ $40.51 Maple 6.8 $ $929 $1, $35.18 Boxelder 0.5 $37 68 $67 $ $34.58 Ash 7.6 $ $1,070 $1, $31.64 Hackberry 0.6 $43 91 $89 $ $18.81 Elm 0.8 $ $121 $ $13.73 Cherry plum 0.1 $6 13 $13 $ $9.53 Flowering crabapple 0.0 $3 8 $7 $ $5.40 OTHER STREET TREES 0.6 $ $98 $ $20.93 CLIFTON TOTAL 24.8 $1, $3,446 $5, $
 Sequestered Decomposition")


12 Table 8. Annual Carbon Dioxide Benefits of Clifton, Ohio Trees by Common Name and Ordered by Decreasing Benefits per Tree Sequestered (lb) Sequestered Decomposition Release(lb) Maintenance Release (lb) Release Avoided (lb) Avoided Net (lb) % Tree Numbers Honeylocust 1411 $ $0 981 $ $ $8.78 Boxelder 1748 $ $1 812 $ $ $6.12 Oak 9966 $ $ $ $ $5.58 Black walnut 3504 $ $ $ $ $4.40 Maple $ $ $ $ $3.81 Ash $ $ $ $ $3.63 Elm 1704 $ $ $ $ $1.70 Hackberry 367 $3 9 6 $0 944 $ $ $1.39 Cherry plum 123 $1 4 1 $0 130 $1 246 $ $0.92 Flowering crabapple 76 $1 2 1 $0 74 $1 147 $ $0.55 OTHER STREET TREES 1307 $ $ $ $ $2.49 VILLAGEWIDE TOTAL $ $ $ $ $3.74 $ Avg. $/tree
 Deposition NO2 (lb) Deposition PM10 (lb) Deposition SO2")

13 Table 9. Annual Air Quality Benefits of Clifton, Ohio Trees by Common Names and Ordered by Decreasing Air Pollution Benefits per Tree Deposition O3 (lb) Deposition NO2 (lb) Deposition PM10 (lb) Deposition SO2 (lb) Deposition Avoided NO2 (lb) Avoided PM10 (lb) Honeylocust $ $ $ $9.76 Black walnut $ $ $ $7.29 Oak $ $ $ $6.77 Maple $ $ $ $6.33 Boxelder $ $ $ $5.70 Ash $ $ $ $5.18 Hackberry $ $ $ $2.59 Elm $ $ $ $1.91 Cherry plum $ $ $3 1.2 $1.33 Flowering crabapple $ $ $1 1.2 $0.71 OTHER STREET TREES $ $ $ $2.94 VILLAGEWIDE TOTAL Avoided VOC (lb) Avoided SO2 (lb) Avoided BVOC Emission (lb) BVOC Emission $ $ $ $5.36 (lb) % Tree Number Avg. $/tre e 13


14 Table 10. Annual Aesthetic or Other Benefits of Trees by in Clifton, Ohio Tree Numbers $ Avg. $/tree Honeylocust $ $ Boxelder $ $44.17 Oak $ $42.88 Black walnut $ $38.81 Maple $1, $33.20 Ash $1, $27.18 Hackberry $ $17.51 Elm $ $16.45 Cherry plum $ $3.22 Flowering crabapple $ $2.06 OTHER STREET TREES $ $22.24 VILLAGEWIDE TOTAL $5, $31.48

15 Table 11. Annual Benefits and Annual Benefits per Tree by Common Name for Clifton Street Trees Energy CO2 Air Quality Stormwater Aesthetic/ Other $ Ash $1,645 $189 $269 $1,486 $1,413 $5, Maple $1,442 $156 $260 $1,608 $1,361 $4, Oak $891 $123 $149 $1,087 $943 $3, Black walnut $637 $62 $102 $709 $543 $2, Honeylocust $119 $18 $20 $121 $297 $ Elm $178 $22 $25 $107 $214 $ Boxelder $104 $18 $17 $145 $133 $ Hackberry $132 $10 $18 $77 $123 $ Cherry plum $19 $2 $3 $7 $6 $ Flowering crabapple $11 $1 $1 $4 $4 $ OTHER STREET TREES $147 $17 $21 $144 $156 $ VILLAGEWIDE TOTAL $5,324 $618 $884 $5,495 $5,194 $17,


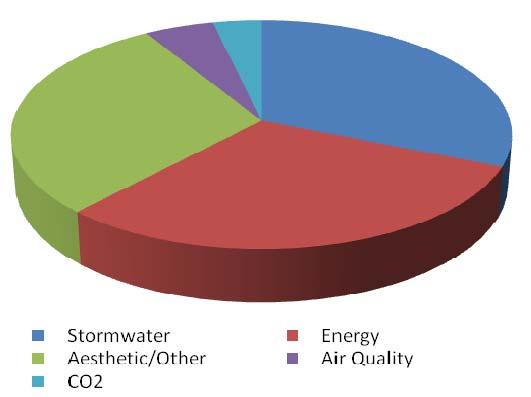
16 Table 12 Environmental Benefits from Five Benefit Categories for Clifton Street Trees Benefits $/tree Stormwater $5,495 $33.30 Energy $5,324 $32.27 Aesthetic/Other $5,194 $31.48 Air Quality $884 $5.36 CO2 $618 $3.75 Benefits $17,515 $