Monitoring Condition of Savanna Riparian Zones in North Australia
|
|
|
- Maximillian O’Brien’
- 5 years ago
- Views:
Transcription


1 Monitoring Condition of Savanna Riparian Zones in North Australia Centre for Remote Sensing and Spatial Information Science Kasper Johansen Centre for Remote Sensing and Spatial Information Science School of Geography, Planning and Architecture The University of Queensland Brisbane, 4072, QLD, Australia 1
2 Outline 1. Tropical Savanna Riparian Zones 2. Objectives 3. Study Area 4. Methods 5. Riparian Mapping and Monitoring Results 6. Conclusions and Future Work 7. Acknowledgements 2


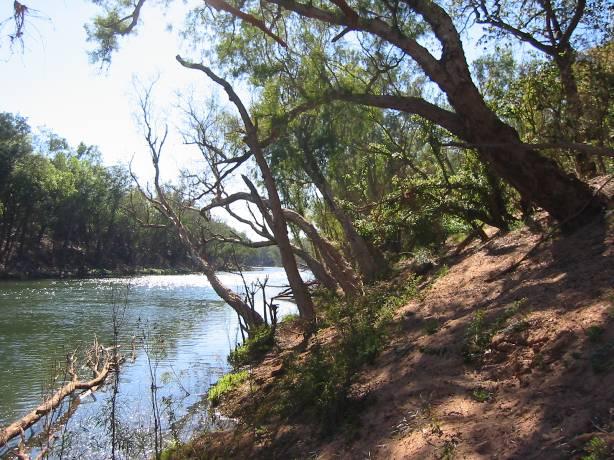
3 1. Tropical Savanna Riparian Zones Australian tropical savannas Riparian zones Source: Tropical Savannas CRC, 2003 Source: Begg et al.,


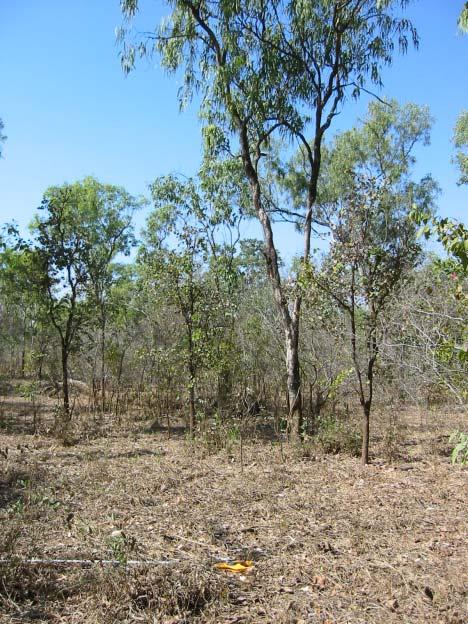
4 1. Importance of Riparian Zones Provision of stream shade Prevention of erosion Nutrient source from litter fall Natural filtering of pollutants Wildlife habitat 4
5 2. Objectives (1) to develop a method for mapping riparian condition indicators related to water quality using remote sensing; and (2) to compare the image based method with a field based method in terms of: - Representativeness of sample size - Cost-effectiveness - Suitability for multi-temporal temporal assessment 5


6 3. Study Area Daly River Darwin 2.4m pixels 0.6m pixels Katherine 2km I I Northern Territory QuickBird image 6


7 3. Study Area Daly River 7
8 4. Methods - Field Survey Data Field measurements of 5m x 5m quadrats - 10m wide transects Parameters: 1. Riparian zone width 2. River channel width 3. Percentage canopy cover 4. Ground cover 5. Tree clearing 6. Bank stability 7. Flood damage 8. Vegetation overhang 8


9 4. Methods Image Processing Image processing Corrections Vegetation indices Image texture Development of biophysical models Object-oriented classification Extraction of riparian indicators Change detection Field survey data Classification % Canopy cover % Organic litter Canopy continuity Bank stability River width Tree overhang 9
10 5. Results Biophysical Models Percentage Canopy Cover Bank Daly River stability Daly 2005River = x -9.33y 1 y = Ln(x) R MDD 2 = 0.74, n = 32 = 8.43% R 2 = , n = organic litter MDD 0.7= 4.98% canopy 0.6 cover Percentage Organic Litter y = 1.855Ln(x) R 2 = , n = SAVI SAVI


11 5. Results Riparian Zone Mapping Pan-sharpened Percentage Stream Canopy Classified Organic Flood Bank Continuity Damage Canopy litter QuickBird Stability Map Cover Map Map Image Map R R 2 2 = = n n = = Overall accuracy = 90% n = 350 Approximate scale Approximate scale 100m I I 100m I I 11
12 5. Results Image Classification 100 River width of the Daly River -- August River width (m) Average river width = = 54.41m 46.51m Distance (m) (m) 12


13 5. Results Vegetation Overhang Map Multi-spectral Vegetation Overhang QuickBird Map image Approximate scale 100m I I 13
14 5. Results Monitoring Accuracies Biophysical and landform attributes % canopy cover / Canopy continuity 6.02% Total minimum detectable change Organic litter 10.73% Bank stability index Flood damage index Sufficiently large sample size Accurate field survey data to improve models Field survey to match image spatial resolution 14


15 5. TRARC Approach Tropical Rapid Appraisal of Riparian Condition (TRARC) Qualitative rapid approach Three 100m x 20m transects 25 riparian indicators A total of 16 sites canopy cover organic litter Fragmentation Tree clearing Bank stability Stream bank Riparian zone Transitional zone 15


16 5. TRARC Image Analysis Image conversion to TRARC format to match TRARC scores Scores % canopy cover Organic litter Canopy continuity TRARC = 0 <1% <5% <50% TRARC = % 5-30% TRARC = % 30-60% 50-90% TRARC = % 60-80% TRARC = % % % 16

17 5. Results - Representativeness % of sample mean = true mean 100 Representativeness Location of 3% image sampling study sites Lower bank Middle bank Upper bank 0 % canopy cover Organic litter Canopy continuity Tree clearing 1km I I Bank stability Riparian health indicators Flood damage Complex river systems may require larger sample size 17
18 5. Results Cost-effectiveness Image based approach: : Mapping results with MDD < 3% at a 95% confidence Costs - 21km level of river Costs with Costs - 95% 21km - 200km of power. river of river Costs - 200km of river TRARC Image based approach: method - : 100% Covering spatial 3% of the study area. TRARC method coverage 3% spatial coverage Costs (AUS$) Costs (AUS$) Imagery 0Processing / Field survey Total Data analysis Field survey Data analysis Total 18
19 5. Results Multi-temporal temporal Assessment TRARC = 0 <1% TRARC = % TRARC = % TRARC = % TRARC = % Change from along the Daly River Range of change in % canopy cover TRARC = 0 <1% 40 TRARC = % 30 TRARC = % 20 TRARC = % 10 TRARC = % TRARC change scores Example: Date1= 61%, Date2= 59% -> > 2% change, 1 TRARC change score Date1= 84%, Date2= 31% -> > 53% change, 1 TRARC change score 19
20 6. Conclusions Indicators of riparian condition that can be mapped from image data with accuracies feasible for change detection: Percentage canopy cover Organic litter Canopy continuity Bank stability Flood damage Riparian zone width River width Vegetation overhang 20
21 6. Conclusions TRARC most appropriate at small scales (<200km) Image based approach appropriate at regional scales ( km) TRARC method most cost-effective when used for 1-200km 1 stretch of river depending of spatial variation of condition Image based method most cost-effective when used for > 200km stretch of river Only image based approach suitable for multi- temporal assessment 21


22 6. Future Work Laser IKONOS scanning image Height 1m - information 4m pixels Apply image approach for Victoria in km of streams 22
23 Thanks to: 7. Acknowledgements My advisors: Stuart Phinn,, Michael Douglas, and John Lowry Tropical Savannas CRC and The University of Queensland s s School of Geography, Planning & Architecture for funding Ian Dixon for assistance with fieldwork and help using TRARC 23


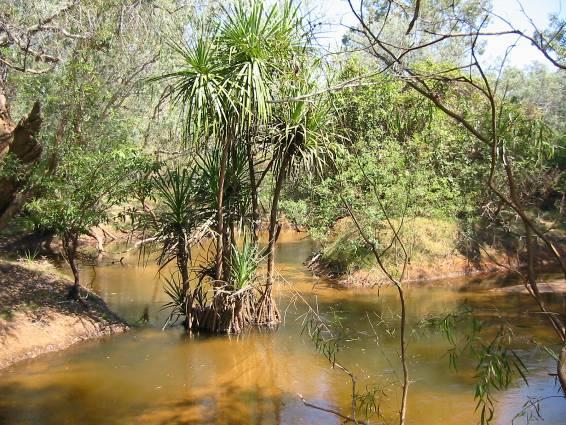


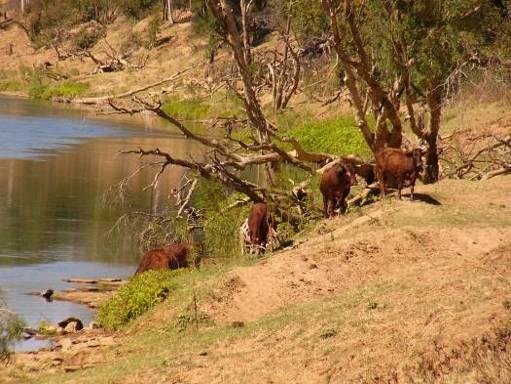

24 Photos by K. Johansen,