May 10, 2018 Q EARNINGS CALL
|
|
|
- Peregrine Cooper
- 5 years ago
- Views:
Transcription
1 May 10, 2018 Q EARNINGS CALL
2 DISCLAIMER The following information is preliminary financial information only. None of the information has been reviewed or audited by our independent certified public accountants. Finalization of the 2016 and 2017 financial statement audit of multi-element revenue accounting could result in a non-cash shift between reported Print and Digital Net Revenue and between reporting periods. The information is subject to adjustment for normal period-end items as well as for other adjustments that may be required when quarterly or annual information is reported. The adjustments could be material. The Company's results can fluctuate from month to month depending on a variety of factors, some of which are beyond the Company's control or are difficult to predict, so no inference as to future results should be drawn from this information. The following information does not necessarily include all material information about the Company or its securities that an investor would consider in making a decision to purchase or sell securities, and, therefore, no person should place undue reliance on this information. The Company disclaims any duty to update the information disclosed below or to provide any information in the future. The financial, or non-financial information, is presented as if the acquisition of YP Holdings had occurred on January 1, 2016 and excludes the impact of acquisition accounting, as required by U.S. GAAP. Adjusted pro forma EBITDA represents earnings before interest, taxes, depreciation and amortization and other non-recurring items, including acquisition transaction fees and integration costs, pension, long-term incentive compensation, capital restructuring, business transformation, and adjustments for reorganization (emergence), fresh start and acquisition accounting. Adjusted pro forma EBITDA margin is calculated by dividing adjusted pro forma EBITDA by pro forma net revenue. Adjusted pro forma results do not necessarily reflect what the underlying operational or financial performance of the Company would have been, had the Dex Media and YP transaction been consummated prior to January 1,

3 Joe Walsh CEO 3


4 THRYV Sales Estimates and Invoices, Online Payments and Mobile QuickPay Contact Management Appointment Scheduling, Text, and Engagement Tools Social Media Facebook and Twitter Video Worth 1,000 Words Online Listings Management Put your business on the map. All of them. Website Adaptive and Responsive SEO Money Back Guarantee Increase Website Visibility Gross Revenue 293% CAGR $121m $77m $2m $35m (F) *Over 40,000 live units as of March 31, 2018 Encouraging Thryv results continue. 4


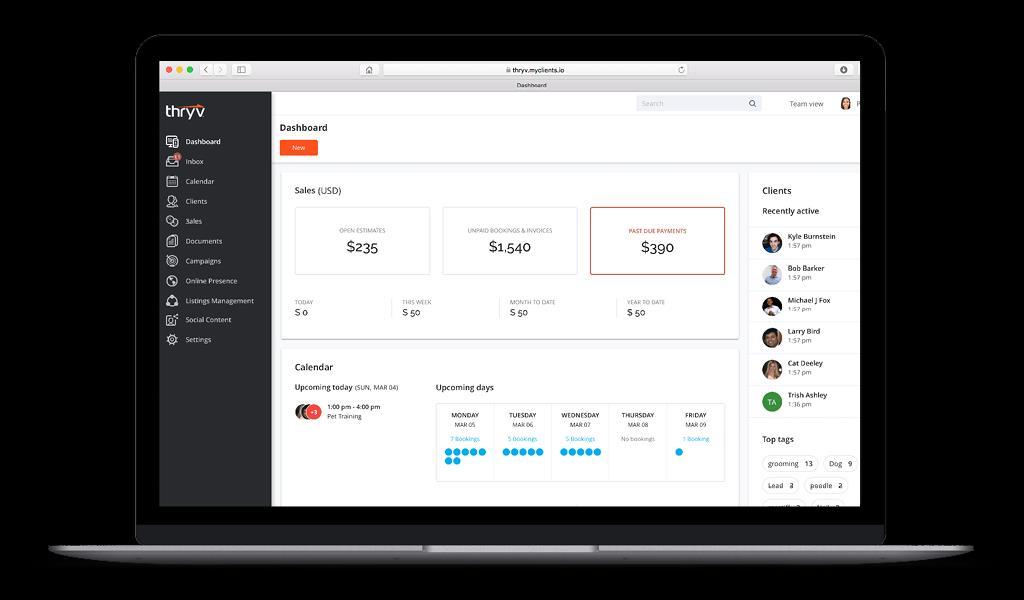


5 THRYV 3.0 Over 200 Improvements Clients Inbox Calendar Sales Presence Campaigns Social Documents Integrations Thryv Leads 5


6 DEXYP INTEGRATION Integration and cost reductions are ahead of plan Combination Playbook Digital Portfolio + Simplification Manage Print Directories Rationalization + Utilization of Salesforce Removal of Duplicate Overhead On-going, ahead of plan Complete with lower costs than planned On-going, on plan On-going, on plan 6

7 Paul Rouse CFO 7
8 DEXYP NON-GAAP FINANCIAL MEASURES $mm Pro Forma Net Revenue ($mm) (a), (b) Q1 Variance Fav (Unfav) Variance % Print $242.9 $318.8 $(75.9) -23.8% Digital (43.2) -14.6% Other (0.1) -4.6% Total Pro Forma Net Revenue $497.7 $616.9 $ (119.3) -19.3% Adjusted Pro Forma EBITDA ($mm) (a), (c) $146.1 $136.9 $(9.3) 6.8% Adjusted Pro Forma EBITDA Margin % 29.4% 22.2% 7.2% Free Cash Flow ($mm) (a), (d), (e) $53.5 $111.1 $(57.6) -51.8% Debt ($mm) (a) Term Note $610.0 $528.7 $(81.3) -15.4% ABL % Total Outstanding Debt $762.8 $737.4 $(25.4) -3.4% Cash $(4.2) $(7.6) $(3.4) 45.0% Net Debt (e) $758.7 $729.9 $(28.8) -3.9% Footnotes: (a) All figures presented are preliminary, subject to change, and unaudited. Material changes may result from audit procedures. (b) (c) (d) (e) Pro Forma Net Revenue for 2018 and 2017 is presented on a consolidated pro forma basis as a result of acquisition accounting and fresh start accounting. DexYP's net revenue has been adjusted to reflect proper recognition of contracts with both print and digital advertising components. Adjusted Pro Forma EBITDA excludes interest, taxes, depreciation and amortization, and other non-cash/non-recurring expenses, including pension, long-term incentive compensation, costs to achieve, business transformation, and other pro forma adjustments. Free Cash Flow reflects cash generated from operating activities, less capital expenditures and interest payments. Free cash flow in 2018 includes the payment of income taxes of $25.1 million and other costs to achieve of $28.9 million. Net debt excludes capital lease financing obligations. Total capital lease financing obligations as of March 31, 2018 and March 31, 2017 were $60.0 million and $65.8 million, respectively. Total capital lease financing obligation payments in Q were $2.2 million and in Q were $0.4 million. 8
9 APPENDIX 9
10 Q EARNINGS CALL
11 DISCLAIMER The following information is preliminary financial information only. None of the information has been reviewed or audited by our independent certified public accountants. Finalization of the 2016 and 2017 financial statement audit of multi-element revenue accounting could result in a non-cash shift between reported Print and Digital Net Revenue and between reporting periods. The information is subject to adjustment for normal period-end items as well as for other adjustments that may be required when quarterly or annual information is reported. The adjustments could be material. The Company's results can fluctuate from month to month depending on a variety of factors, some of which are beyond the Company's control or are difficult to predict, so no inference as to future results should be drawn from this information. The following information does not necessarily include all material information about the Company or its securities that an investor would consider in making a decision to purchase or sell securities, and, therefore, no person should place undue reliance on this information. The Company disclaims any duty to update the information disclosed below or to provide any information in the future. The financial, or non-financial information, is presented as if the acquisition of YP Holdings had occurred on January 1, 2016 and excludes the impact of acquisition accounting, as required by U.S. GAAP. Adjusted pro forma EBITDA represents earnings before interest, taxes, depreciation and amortization and other non-recurring items, including acquisition transaction fees and integration costs, pension, long-term incentive compensation, capital restructuring, business transformation, and adjustments for reorganization (emergence), fresh start and acquisition accounting. Adjusted pro forma EBITDA margin is calculated by dividing adjusted pro forma EBITDA by pro forma net revenue. Adjusted pro forma results do not necessarily reflect what the underlying operational or financial performance of the Company would have been, had the Dex Media and YP transaction been consummated prior to January 1,
12 Client Count, Period End (000) DexYP NON-GAAP KPI (a), (b) Q1 Variance Fav (Unfav) % Multi-Product (33) -14.7% Digital % Print (85) -24.5% Total Clients (118) -17.1% Pro Forma Net Revenue ($mm) (b), (c) Print $ $ $ (75.9) -23.8% Digital (43.2) -14.6% Other (0.1) -4.6% Total Pro Forma Net Revenue $ $ $ (119.3) -19.3% Adjusted Pro Forma EBITDA ($mm) (b), (d) $ $ $ % Adjusted Pro Forma EBITDA Margin % 29.4% 22.2% 7.2% Free Cash Flow ($mm) (b), (e), (f) $ 53.5 $ $ (57.6) -51.8% Debt ($mm) (b) Term Note $ $ $ (81.3) -15.4% ABL % Total Outstanding Debt $ $ $ (25.4) -3.4% Cash $ (4.2) $ (7.6) $ (3.4) 45.0% Net Debt (f) $ $ $ (28.8) -3.9% Footnotes: (a) (b) (c) (d) (e) Duplicative Local clients were removed from 2018 but not All figures presented are preliminary, subject to change, and unaudited. Material changes may result from audit procedures. Pro Forma Net Revenue for 2018 and 2017 is presented on a consolidated pro forma basis as a result of acquisition accounting and fresh start accounting. DexYP's net revenue has been adjusted to reflect proper recognition of contracts with both print and digital advertising components. Adjusted Pro Forma EBITDA excludes interest, taxes, depreciation and amortization, and other non-cash/non-recurring expenses, including pension, longterm incentive compensation, costs to achieve, business transformation, and other pro forma adjustments. Free Cash Flow reflects cash generated from operating activities, less capital expenditures and interest payments. Free cash flow in 2018 includes the payment of income taxes of $25.1 million and other costs to achieve of $28.9 million. (f) Net debt excludes capital lease financing obligations. Total capital lease financing obligations as of March 31, 2018 and March 31, 2017 were $60.0 million and $65.8 million, respectively. Total capital lease financing obligation payments in Q were $2.2 million and in Q were $0.4 million. 12
13 ADDITIONAL MATERIAL 13
14 DexYP ADJUSTED PRO FORMA EBITDA RECONCILIATION Q1 Variance $mm Fav (Unfav) % Net income (loss) - GAAP $ 0.9 $ (67.7) $ % Add/(subtract) non-operating items: Provision for income taxes (37.1) -97.3% Interest expense, net % Gains on early extinguishment of debt - (0.3) % Operating income (loss) $ 23.5 $ (8.7) $ % Depreciation and amortization (9.7) -12.7% EBITDA $ 90.4 $ 67.9 $ % Adjustments: Adjustments for acquisition and fresh start accounting (a) $ 25.6 $ 60.7 $ (35.1) -57.9% Costs to achieve/business transformation (b) % Long-term incentive compensation (c) % Accounting conformity and other adjustments (4.1) % Late fees (0.2) -8.7% Pension expense 0.9 (0.2) % Adjusted Pro Forma EBITDA (non-gaap) $ $ $ % Operating Revenue - GAAP $ $ $ (75.0) -14.0% Pro forma revenue excluded from GAAP revenue (44.2) -53.3% Total Pro Forma Net Revenue (non-gaap) $ $ $ (119.3) -19.3% Net Cash Provided by Operating Activities - GAAP $ 57.4 $ $ (62.1) -51.9% Less: Additions to fixed assets and capitalized software (4.0) (8.5) % Free Cash Flow (d) $ 53.5 $ $ (57.6) -51.8% Footnotes: (a) (b) (c) (d) Acquisition and fresh start accounting requires that deferred revenue and deferred costs be written off. This adjustment adds back revenue, net of expenses, for what would have been recognized in EBITDA, absent acquisition and fresh start accounting. Costs to achieve represents exit and disposal costs associated primarily with closing YP office facilities and the reduction of YP workforce for the purpose of business integration and operational efficiencies. Business transformation represent expenses incurred by Dex Media in connection with their organizational restructuring program, which included the launch of virtual sales offices, enabling the Company to eliminate field sales offices, plus the automation of the sales process, integration of systems to eliminate duplicative systems and workforce reductions. Long-term incentive compensation represents stock-based compensation expense associated with stock option awards. Free Cash Flow reflects cash generated from operating activities, less capital expenditures and interest payments. Free cash flow in 2017 includes the payment of income taxes of $25.1 million and other costs to achieve of $28.9 million. 14
15 DexYP FREE CASH FLOW RECONCILIATION Q1 Variance $mm Fav (Unfav) % Adjusted Pro Forma EBITDA $ $ $ % Tax refunds/(payments) (25.1) (1.4) (23.7) NM Costs to achieve/business tranformation (a) (28.9) (4.6) (24.3) NM Other cash costs (b) - (5.0) % Pension funding - (1.4) % Working capital/other (12.3) 16.7 (29.0) % Cash from Operating Activities $ 79.8 $ $ (61.3) -43.5% Capital expenditures (4.0) (8.5) % Free Cash Flow (before Debt Service) $ 75.8 $ $ (56.8) -42.8% Interest payments (22.3) (21.6) (0.7) -3.5% Free Cash Flow $ 53.5 $ $ (57.6) -51.8% Footnotes: (a) (b) Costs to achieve represents exit and disposal costs associated primarily with closing YP office facilities and the reduction of YP workforce for the purpose of business integration and operational efficiencies. Business transformation represent amounts paid by Dex Media in connection with their organizational restructuring program, which included the launch of virtual sales offices, enabling the Company to eliminate field sales offices, plus the automation of the sales process, integration of systems to eliminate duplicative systems and workforce reductions. Other cash costs in 2017 primarily represents YP severance (not related to the YP acquisition) and YP other project costs. 15