SANTA BARBARA COUNTY Community Choice Aggregation Technical Study: Preliminary Rate, Portfolio Composition, and Pro Forma Results (revised)
|
|
|
- Cameron Sutton
- 5 years ago
- Views:
Transcription
")
1 SANTA BARBARA COUNTY Community Choice Aggregation Technical Study: Preliminary Rate, Portfolio Composition, and Pro Forma Results (revised) May 25, 2018
2 2 Introduction Pacific Energy Advisors (PEA) evaluated the operating feasibility of the following Community Choice Aggregation (CCA) membership configurations: All Santa Barbara County (SBC) Unincorporated SBC; and City of Santa Barbara Under each membership configuration, PEA was tasked to deliver the following items: Rate comparisons for Southern California Edison (SCE) and Pacific Gas and Electric (PG&E), under 3 different supply scenarios (Renewable Portfolio Standard (RPS) compliant, 50% renewable energy supply, and 75% renewable energy supply); Portfolio composition comparisons for SCE and PG&E under the 3 different supply scenarios; and Pro forma cash flow reports for SCE and PG&E under the 3 different supply scenarios that include administrative and overhead cost projections (including reserve policies and start up costs).
3 3 Introduction (continued) PEA was also requested to complete the following additional analyses: Typical residential bill impacts by membership scenario under the 3 aforementioned supply scenarios; and Stress analyses on whether the Minimum (Accumulated Reserves) and Maximum (Accumulated Reserves plus Other Surplus) levels of reserves could withstand changes in higher market prices and Power Charge Indifference Adjustment (PCIA) costs.
4 4 Executive Summary Rates Based on the analyses conducted during this Study, PEA concludes that SBC has several electric supply options that would yield competitive customer rates compared to the incumbent investor-owned utilities (IOUs). The All-SBC membership configuration offers the greatest potential for the increased use of GHG-free energy with competitive rates, while the City-only membership configuration would be the most challenging.
5 5 Executive Summary (continued) Pro Formas The pro forma financial results indicates net surpluses in most of the membership scenarios, with varying surplus dates depending on the renewable energy supply scenario (the Net Surplus/Deficit during each year of the study period reflects the projected net revenues (or deficits) that would be realized by SBC in the event that the program decided to offer customer electric rates that were equivalent to similar rates charged by SCE and PG&E). All of the membership configurations show the possibility for Net Surpluses in the first year of operation depending on the renewable energy supply scenario, but the All-SBC membership scenario offers the highest potential.


6 6 Executive Summary (continued) Rate Impact on Residential Bills On average, residential bill impacts throughout the Study period showed potential decreases in costs across all three membership configurations.

 as")
7 7 Executive Summary (continued) Stress Analyses on Reserves The combined stress of a 50% increase in power prices and 25% increase in PCIA costs could be fully absorbed by the Maximum Reserve Balance (Accumulated Reserves plus Other Surplus) as early as 2021.
 City (MWh) Residential 686,487 307,524 155,232 Small Commercial 258,972 69,307 73,772 Medium Commercial 352,369 63,286 118,168 Large Commercial 226,942 65,314 34,117 Industrial 787,587")
8 8 All Prospective Electricity Customers Summary reflects bundled customer electricity usage in CY 2015 Direct Access (DA) customers are excluded from totals Customer Class All County (MWh) Unincorp. County (MWh) City (MWh) Residential 686, , ,232 Small Commercial 258,972 69,307 73,772 Medium Commercial 352,369 63, ,168 Large Commercial 226,942 65,314 34,117 Industrial 787, ,560 19,186 Ag and Pumping 258, ,259 6,007 Street Lighting 9,987 2,717 2,999 Traffic Control 1, Total 2,581,604 1,330, ,929
9 9 Key Assumptions Customer opt-out rate of 10% for all scenarios. Start-up costs of approximately $7-10 million, sourced from an 10 year interest-free loan for the City of Santa Barbara only scenario, and a 3% interest-only bank loan with a 1 year principal balloon payment for All Santa Barbara County and Unincorporated Santa Barbara membership scenarios. Annual staffing costs were derived by benchmarking to currently operating CCAs of similar size that range from approximately $558,000 to $3,500,000 depending on membership scenario, with corresponding staffing levels ranging from 3 to approximately 20, respectively. All scenarios consider a single phase of customer enrollments.
10 All Santa Barbara County Rate Comparison 10

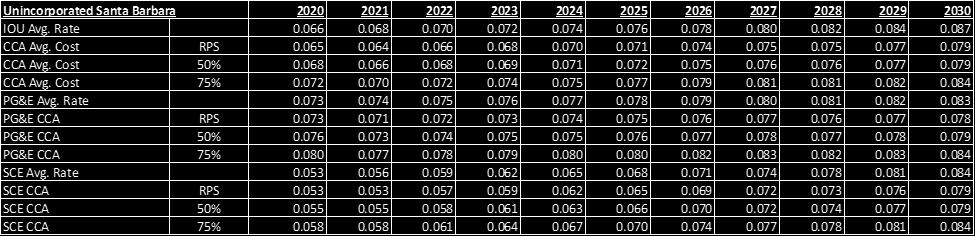
11 Unincorporated Santa Barbara County Rate Comparison 11
12 City of Santa Barbara Rate Comparison 12
 Supply Scenario 1 (RPS Tracking Year 1) 25% 5% 3% 66% 99% 1% 9 Supply Scenario 1 (RPS Tracking Year 11) 38% 8% 5% 50% 100% 0% - Supply Scenario 2 (50% Renewable Year 1) 42% 5% 3% 49% 99% 1%")
13 13 All Santa Barbara County Portfolio Composition PG&E Territory Emissions Factor PG&E (All Santa Barbara County) Bucket 1 Bucket 2 Bucket 3 Additional GHG-free Total GHG-free Conventional (lbs. CO2e/MWh) Supply Scenario 1 (RPS Tracking Year 1) 25% 5% 3% 66% 99% 1% 9 Supply Scenario 1 (RPS Tracking Year 11) 38% 8% 5% 50% 100% 0% - Supply Scenario 2 (50% Renewable Year 1) 42% 5% 3% 49% 99% 1% 12 Supply Scenario 2 (50% Renewable Year 11) 38% 8% 5% 50% 100% 0% - Supply Scenario 3 (75% Renewable Year 1) 67% 5% 3% 24% 99% 1% 12 Supply Scenario 3 (75% Renewable Year 11) 63% 8% 5% 25% 100% 0% -
14 14 All Santa Barbara County Portfolio Composition SCE Territory Emissions Factor SCE (All Santa Barbara County) Bucket 1 Bucket 2 Bucket 3 Additional GHG-free Total GHG-free Conventional (lbs. CO2e/MWh) Supply Scenario 1 (RPS Tracking Year 1) 25% 5% 3% 31% 64% 36% 340 Supply Scenario 1 (RPS Tracking Year 11) 38% 8% 5% 22% 72% 28% 264 Supply Scenario 2 (50% Renewable Year 1) 42% 5% 3% 14% 64% 36% 342 Supply Scenario 2 (50% Renewable Year 11) 38% 8% 5% 22% 72% 28% 264 Supply Scenario 3 (75% Renewable Year 1) 67% 5% 3% 0% 75% 25% 238 Supply Scenario 3 (75% Renewable Year 11) 63% 8% 5% 0% 75% 25% 236
15 15 Identification of Risks & Uncertainties Pro Forma analyses are based on variables that may or may not turn out as expected. Some important uncertainties to note are: Market price risk (i.e., open positions may be higher cost if market prices rise) PG&E/SCE generation rates and exit fees (e.g., PCIA) may be more or less than projected impacting the CCA s rates and revenues Customer load risk (i.e., opt out rates may be higher than expected, growth of distributed energy resources is much higher than anticipated, etc.) Regulatory/legislative risk; uncertainty on how new legislation may impede the future growth of CCAs (i.e., the California Public Utilities Commission recently published a Green Book that poses the risks of customer choice)
16 All Santa Barbara County RPS Tracking Pro Forma 16
17 All Santa Barbara County 50% Renewable Energy Supply Pro Forma 17
18 All Santa Barbara County 75% Renewable Energy Supply Pro Forma 18
19 Unincorporated Santa Barbara County RPS Tracking Pro Forma 19
20 Unincorporated Santa Barbara County 50% Renewable Energy Supply Pro Forma 20
21 Unincorporated Santa Barbara County 75% Renewable Energy Supply Pro Forma 21
22 City of Santa Barbara RPS Tracking Pro Forma 22
23 City of Santa Barbara 50% Renewable Energy Supply Tracking Pro Forma 23
24 City of Santa Barbara 75% Renewable Energy Supply Tracking Pro Forma 24