UN E-GOV Survey 2018 GEARING E-GOVERNMENT TO SUPPORT TRANSFORMATION TOWARDS SUSTAINABLE AND RESILIENT SOCIETIES. Montevideo, 3 August 2018
|
|
|
- Chester Patrick
- 5 years ago
- Views:
Transcription
1 Division for Public Institutions & Digital Government, United Nations Department of Economic and Social Affairs UN E-GOV Survey 2018 GEARING E-GOVERNMENT TO SUPPORT TRANSFORMATION TOWARDS SUSTAINABLE AND RESILIENT SOCIETIES Vincenzo Aquaro Chief, Digital Government Branch DPIDG, UN DESA Montevideo, 3 August 2018
2 Division for Public Institutions and Digital Government United Nations Department of Economic and Social Affairs PART ONE ABOUT THE SURVEY


3 Division for Public Institutions and Digital Government United Nations Department of Economic and Social Affairs E-Government Survey: The Mandates The Survey is mandated by the General Assembly through resolutions 69/327; 58/231 and 59/55 on Public Administration and Development Relevant ECOSOC resolutions for the United Nations E- Government Survey include: E/RES/2005/3 E/RES/2006/47 E/RES/2007/38 E/RES/2008/32 E/RES/2009/18 E/RES/2011/2 E/RES/2011/22 E/RES/2012/28 E/RES/2013/2 E/RES/2014/38 E/RES/2015/28 3

4 Division for Public Institutions and Digital Government United Nations Department of Economic and Social Affairs What is the UN E-Government Survey It is the only E-Government Survey that assesses the e- government development status of all 193 UN Member States It is used as a benchmark tool to measure e-government development, build governments capacity, provide policy recommendations and share good practices from around the World It is a UNDESA flagship publication issued every two years since 2003 Governments Intergovernmental institutions International and regional organizations Academia, research centers and schools of public administration Private sector Civil society organizations Citizens 4


5 Division for Public Institutions and Digital Government United Nations Department of Economic and Social Affairs Just Some Numbers and References Outstanding International and National Media Coverage In 2017 >75,000 ref. Citation analysis of scholarly references to the UN e-government Survey reveals a rapidly expanding level of attention and inherent credibility of the product. *** *** UN E-Gov External Evaluation Results 2017 Timeframe Total downloads Downloads > 5 ML 2016* 1,271, * 1,172, ** 1,072,760 *Second most downloaded publication of DESA **Most downloaded publication of DESA 5


6 E-Government Survey: A Continuous Improvement The E-Gov Survey presents a systematic assessment of the use of ICT to transform and reform the public sector by enhancing efficiency, effectiveness, transparency, accountability, access to public services and citizen participation in 193 Countries


7 Division for Public Institutions and Digital Government United Nations Department of Economic and Social Affairs Two External Independent Evaluations 2011 The evaluation results showed that DPADM has, in particular, successfully promoted e-government as a tool to deliver government services more efficiently. DPADM s 2010 United Nations E-Government Survey publication, as well as earlier versions, were recognized by stakeholders for their impact in raising general awareness of the benefits that governments can achieve by adapting e-government strategies for service provision. Additionally, DPADM s e- Government survey is credited with raising awareness of specific national rankings intended to measure the relative success of governments implementation of such approaches. The influence of DPADM s egovernment work spanned multiple continents, was well integrated with e- Government work being undertaken by peer organizations, and, was serving as a credible benchmark in the development arena The e-government Survey has been a remarkable success and has become one of the flagship publications of the United Nations. Although there are uncertainties in the precise measurement of the national rankings, the readiness index has served as an invaluable tool for governments and policymakers. The Index has been continually updated over the years, and now is in the process of being readjusted to make it supportive of the Sustainable Development Goals (SDG) program. There is no reason to imagine that going forward, the Index will not remain a crucial element in how governments will formulate their ICT strategies as regards citizen-facing public services. 7
 2 Expert Group Meetings 1 Informal Advisory Working Group A) egovernment Survey Ex-Post Evaluation E-government Survey B) Internal Review C) External")
8 Preparatory process of the 2018 E-Gov Survey 20 Months of Work A Taskforce of 308 Researchers 206 UN-Volunteers Partnership with UNU-EGOV, ITU, ESCAP Contribution from ECLAC, UNECA, UNECE, ESCWA, UNOOSA 1 External Evaluation Report( ) 2 Expert Group Meetings 1 Informal Advisory Working Group A) egovernment Survey Ex-Post Evaluation E-government Survey B) Internal Review C) External Review D) On-line consultation F) Advisory E-Gov Task Force E) Expert Group Meeting Open Consultation with 193 MS (MSQ) 100 MSQ Returned 3x193 MS Assessments in 66 lanuguages 57 New Case Studies


9 Division for Public Institutions and Digital Government United Nations Department of Economic and Social Affairs What was changed in the 2018 edition compared to 2016 Core principles and linkages with 2030 Agenda and 2018 HLPF themes GEARING E-GOVERNMENT TO SUPPORT TRANSFORMATION TOWARDS SUSTAINABLE AND RESILIENT SOCIETIES Five Dimensions of SDG16 Local Component Cities 2018 Theme: Transformation Forward Resilience Society Fast evolving technologies and Artificial Intelligence
10 Division for Public Institutions and Digital Government United Nations Department of Economic and Social Affairs What was changed in the 2018 edition compared to /3 ONLINE SERVICE QUESTIONNAIRE Online Service Questionnaire (OSQ), was expanded to include the main principles of the Sustainable Development Goals (SDGs) and Leaving No One Behind, with a particular focus on Goal 16 MEMBER STATES QUESTIONNAIRE An updated and detailed Member States Questionnaire (MSQ) was launched in 2017 to gather further detailed information about the efforts of governments in e-government development The MSQ and the list of 100 responding Member States were added in the Annexes. For the first time, the list of the OSQ areas assessed in this edition of the UN E-Government Survey was added in the Annexes.


11 Division for Public Institutions and Digital Government United Nations Department of Economic and Social Affairs What was changed in the 2018 edition compared to /3 A pilot Local Online Service Index (LOSI) has been created and a pilot analysis and ranking, covering 40 cities worldwide, was added (Chapter 7) Participation Engagement Technology LOSI Content Provision The list of the LOSI indicators assessed in this edition was added in the Annexes. Service Provision


12 Fast-Evolving Technologies in E-Government The new technologies has expanded policy options that literally did not exist as recently as few decades Data, intelligent apps and analytics Blockchain and distributed ledger technologies Artificial intelligence and robotic systems High performance and quantum computing Intelligent things, cyber-physical integration and edge computing Virtual and augmented reality
13 Division for Public Institutions and Digital Government United Nations Department of Economic and Social Affairs PART TWO E-GOV METHODOLOGY

14 Division for Public Institutions and Digital Government United Nations Department of Economic and Social Affairs E-Government Survey Methodology: EGDI, OSI, TII, HCI A country s ranking in the survey is determined by the EGDI - E-Government Development Index, which is a weighted average of three normalized scores on 1. Scope and quality of online services Online Service Index, OSI 2. Development status of telecommunication infrastructure Telecommunication Infrastructure Index, TII 3. Inherent human capital Human Capital Index, HCI
15 How does the Survey measure TII Telecommunication Infrastructure Index (TII) 2016 Subcomponents Estimated internet users per 100 inhabitants Number of main fixed telephone lines per 100 inhabitants Number of mobile subscribers per 100 inhabitants Number of fixed broadband facilities per 100 inhabitants Number of wireless broadband subscriptions per 100 inhabitants 2018 Subcomponents Estimated internet users per 100 inhabitants Number of main fixed telephone lines per 100 inhabitants Number of mobile subscribers per 100 inhabitants Number of fixed broadband facilities per 100 inhabitants Number active mobile broadband subscriptions per 100 inhabitants Primary source: based on the ITU data 15
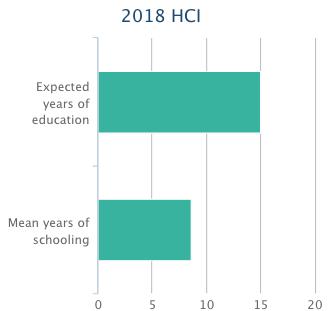
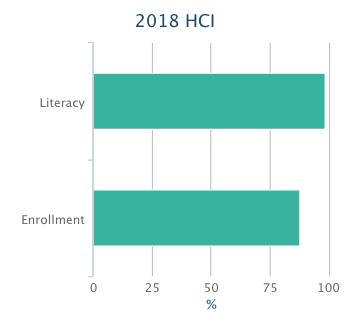
16 Division for Public Institutions and Digital Government United Nations Department of Economic and Social Affairs How does the Survey measure HCI Human Capacity Index (HCI) It is measured through the average of the following indicators the educational base of citizens that will allow them to access the government services online Adult literacy Mean years of schooling Gross enrolment ratio (Primary, Secondary, Tertiary) Estimated years of schooling Primary source: based on the UNESCO data 16


 Pilots")

 External MSQ")
17 2018: Digital Government Framework WOG INTEGRATION PEOPLE-CENTRIC Data Framework Internal Pilots 2018 (new) Pilots OSQ Data Collected UNDESA 2017 (researchers + automated) External MSQ Member States (new) UNESCO 3 rd Parties (new) ITU


18 Questions cover these DOMAINS HEALTH EDUCATION SOCIAL PROTECTION ECONOMIC GROWTH EMPLOYMENT & DECENT WORK ENVIRONMENTAL PROTECTION PUBLIC SECURITY


19 2018 Online Service Index MEMBER STATES QUESTIONNAIRE 3 RD PARTY INDICATORS ONLINE SERVICE QUESTIONNAIRE
20 Division for Public Institutions and Digital Government United Nations Department of Economic and Social Affairs How does the Survey Measure EPI E-Participation Index (EPI) Based on an independent online assessment and a questionnaire conducted by DGB/DPIDG It emphasizes citizen s participation in public decision-making Enabling Participation Engaging People E-information: provision of information E-consultation: interaction with stakeholders in contributions to and deliberation on public policies and services Empowering People E-decision making: engagement in decision making processes; co-creation of service components and delivery modalities Customer Satisfaction Surveys Discussion Forums Opinion Poll Social Networking Websites


21 2018: Local Online Service Index National Component Technology Participation Engagement LOSI Content Provision Service Provision Local Component
22 Division for Public Institutions and Digital Government United Nations Department of Economic and Social Affairs PART THREE TRENDS AND INSIGHTS
 16 L-EGDI 66 M-EGDI H-EGDI 71 VH-EGDI 40 32 67 65")
23 E-Government Development Index (EGDI) LOW MIDDLE HIGH VERY HIGH TRENDS (IN NUMBER OF COUNTRIES) 16 L-EGDI 66 M-EGDI H-EGDI 71 VH-EGDI
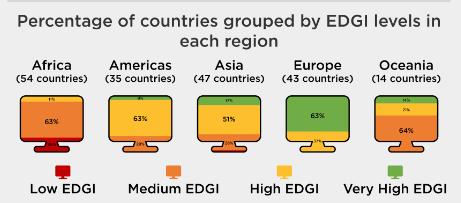
24 Division for Public Institutions and Digital Government United Nations Department of Economic and Social Affairs EGDI: Regional and Global Averages World Average (2016) Africa Americas Asia Europe Oceania (2016) (2016) (2016) (2016) (2016)
25 Division for Public Institutions and Digital Government United Nations Department of Economic and Social Affairs EGDI: Digital Divide Despite some development gains and investments in technology in several countries, e-government divide and digital divide continue to persist. Only 4 countries out of 54 in Africa score higher than the world average EGDI of 0.55, whereas 14 LDCs countries have very low EGDI scores below 0.25.

26 2018 E-Government Survey: Regional Trends

27 Division for Public Institutions and Digital Government United Nations Department of Economic and Social Affairs 2018 Global Ranking: World Leaders

28 Division for Public Institutions and Digital Government United Nations Department of Economic and Social Affairs Regional Trends: Americas Countries with the Highest EDGI Country EGDI 2018 Rank United States of America Canada Uruguay Chile Argentina Brazil Barbados Costa Rica Colombia Mexico Countries with the Lowest EDGI Country EGDI 2018 Rank Guatemala Suriname Jamaica Saint Lucia Honduras Guyana Nicaragua Belize Cuba Haiti Case Study on Agenda Uruguay Digital 2020 In addition to developing Digital Government Plan 2020, the Government of Uruguay has created Agenda Uruguay Digital 2020, a plan built on four key pillars: Social Policy and Inclusion Sustainable Economic Development Government Management Governance for the Information Society The Americas is continuing its improvement in e-government development into The region is no longer represented in the low-egdi and low-osi levels. The average regional EGDI improvement of represents the largest regional improvement in 2018.
29 Very High OSI: Top Leaders (57 MSs) # Country Region OSI Score 2018 OSI Rank 2018 EGDI Rank Denmark Europe Singapore Asia United States of America Americas France Europe Republic of Korea Asia United Kingoom of Great Britain and Northern Ireland Europe Australia Oceania Finland Europe India Asia Italy Europe Japan Asia New Zealand Oceania Norway Europe Sweden Europe United Arab Emirates Asia Spain Europe Canada Americas Germany Europe Netherlands Europe Poland Europe Portugal Europe
30 Very High OSI: Top Leaders (57 MSs) 2/3 # Country Region OSI Score 2018 OSI Rank 2018 EGDI Rank Brazil Americas Luxembourg Europe Mexico Americas Russian Federation Europe Estonia Europe Malaysia Asia Turkey Asia Uruguay Americas Colombia Americas Philippines Asia Austria Europe Kazakhistan Asia China Asia Switzterland Europe Malta Europe Chile Americas South Africa Africa Ireland Europe Israel Asia
31 Very High OSI: Top Leaders (57 MSs) 3/3 # Country Region OSI Score 2018 OSI Rank 2018 EGDI Rank Greece Europe Peru Americas Oman Asia Tunisia Africa Bahrain Asia Liechtenstein Europe Lithuania Europe Slovenia Europe Kuwait Asia Qatar Asia Saudi Arabia Asia Uzbekistan Asia Bangladesh Asia Cyprus Asia Republic of Moldova Europe Bulgaria Europe Belgium Europe


32 LOW MIDDLE HIGH VERY HIGH


33 LOW MIDDLE HIGH 0.75 VERY HIGH
34 LOW MIDDLE HIGH 0.75 VERY HIGH


35 LOW MIDDLE HIGH 0.75 VERY HIGH
36

37 0.00 LOW 0.25 MIDDLE VERY HIGH 1.00 HIGH


38 LOW MIDDLE HIGH 0.75 VERY HIGH

39 URUGUAY The Government of Uruguay committed to the digitalization of all services by 2020 (presidential goal): All services should be started online by the last quarter of E-forms, e-notifications, e-payments are being digitized, making them more user-friendly. The single-sign-in allows citizens to log in to all government services with a single user ID and password or by using the digital signature integrated into the Uruguayan ID card. All these are being coordinated by the Agency for e-government and Information and Knowledge Society (Agesic) from the Office of the President, as part of the Uruguayan digital policy of transforming with equity.

40 URUGUAY: Digital Government Plan Objective VI of the Agenda Proximity government Improve transparency, accountability, citizen participation and services through increased focus on citizens interaction with the Government. Goals: Establishment of Citizen Response Centers and portals, which will allow citizens to complete all transactions related to select services online.
41 Division for Public Institutions & Digital Government, United Nations Department of Economic and Social Affairs 2018 UN e-government Survey: Insights and regional prespecive Thank you for your attention Vincenzo Aquaro