The Power of Information
|
|
|
- Oscar Patterson
- 5 years ago
- Views:
Transcription

1 The Power of Information I N V E S T O R P R E S E N T A T I O N FY14-Q1 October 30, 2013* *Slide 6 has been updated as of December 2, 2013
2 Safe Harbor Statement Certain statements in this presentation, including statements about the focus of Open Text Corporation ( OpenText or the Company ) in Fiscal 2014 on growth in earnings and cash flows, creating value through investments in broader EIM capabilities, distribution, the Company s presence in the cloud and in growth markets, its financial conditions, results of operations and earnings; declaration of quarterly dividends; and other matters, are considered forward-looking statements or information under applicable securities laws. Such forward-looking statements involve known and unknown risks, uncertainties and other factors and assumptions that may cause the actual results, performance or achievements to differ materially. Such factors include, but are not limited to, (i) the future performance, financial and otherwise, of OpenText; (ii) the ability of OpenText to bring new products to market and to increase sales; (iii) the strength of the Company's product development pipeline; (iv) the Company's growth and profitability prospects; (v) the estimated size and growth prospects of the EIM market; (vi) the Company's competitive position in the EIM market and its ability to take advantage of future opportunities in this market; (vii) the benefits of the Company's products to be realized by customers; (viii) the demand for the Company's product and the extent of deployment of the company's products in the EIM marketplace; and (ix) the Company's financial condition and capital requirements. The risks and uncertainties that may affect forward-looking statements include, but are not limited to: (i) integration of acquisitions and related restructuring efforts, including the quantum of restructuring charges and the timing thereof; (ii) the possibility that the Company may be unable to meet its future reporting requirements under the Securities Exchange Act of 1934, as amended, and the rules promulgated there under; (iii) the risks associated with bringing new products to market; (iv) fluctuations in currency exchange rates; (v) delays in the purchasing decisions of the Company's customers; (vi) the competition the Company faces in its industry and/or marketplace; (vii) the possibility of technical, logistical or planning issues in connection with the deployment of the Company's products or services; (viii) the continuous commitment of the Company's customers; and (ix) demand for the Company's products. For additional information with respect to risks and other factors which could occur, see the Company's Annual Report on Form 10-K, Quarterly Reports on Form 10-Q and other securities filings with the SEC and other securities regulators. Readers are cautioned not to place undue reliance upon any such forward-looking statements, which speak only as of the date made. Unless otherwise required by applicable securities laws, the Company disclaims any intention or obligation to update or revise any forward-looking statements, whether as a result of new information, future events or otherwise. COPYRIGHT 2013 OPEN TEXT CORPORATION. ALL RIGHTS RESERVED. 2


3 Scale and Momentum (NASDAQ: OTEX, TSX: OTC) $1.3B+ global revenue EIM $13B market* (ECM, BPM, CEM, ix, Discovery) 20 years of proven innovation 31 country offices, 141 countries supported *as per notes on slide 6 3
4 Investment Highlights Intelligent growth - earnings power and operational discipline Customers are anticipating Red Oxygen - the biggest product release in the Company s history Non-cumulative quarterly dividend of US$0.30 per Common Share* *As of June 30, 2012 *The Board of Directors is under no obligation to declare dividends in the future and the declaration of future dividends is wholly within its discretion 4

5 Information Transformation Information-Based Strategies Cloud EIM Today Mobile SAAS / Social Media 2 Years 1 Year Web 2.0 Enterprise Resource Planning Internet / World-wide Web Client / Server Technologies Mainframe Computing 20 Years 40 Years 15 Years 10 Years 5 Years 3 Years

, Customer Experience Management ( CEM ), Information Exchange ( ix ) and Discovery Discovery BPM ECM CEM")

6 EIM is a Large and Growing Market(1) OpenText believes, based on Gartner information, that EIM represents a $20.9 billion industry expected to grow at a 11.4% CAGR from 2012 to 2017 EIM is comprised of five pillars which include: Enterprise Content Management ( ECM ), Business Process Management ( BPM ), Customer Experience Management ( CEM ), Information Exchange ( ix ) and Discovery Discovery BPM ECM CEM Information Exchange 2013 $3.0b Market 13.6% Growth 2013 $2.9b Market 4.4% Growth 2013 $5.4b Market 8.7% Growth 2013 $5.5b Market 9.3% Growth 2013 $4.1b Market 16.0% Growth % CAGR % CAGR % CAGR % CAGR % CAGR Source: Gartner Forecast: Enterprise Software, 3Q 2013 Update. (1) This slide has been updated as of December 2,
7 Why OpenText Will Lead the EIM Market 1. Market Evolution The market evolving from ECM to Enterprise Information Management (EIM) 2. Well Positioned OpenText is well positioned in EIM with market leading product offerings and industry expertise 3. Trusted Vendor A world class customer base and strong history of partner relationships with SAP and global SI influencers establish OpenText as a trusted, dependable vendor 4. Packaged Apps A clear focus on delivering packaged applications that are EIM information-centric (not transaction-centric) 5. Cloud Services Services and applications offered in a cloud deployment to effectively manage EIM assets and optimize business processes COPYRIGHT 2012 OPEN TEXT CORPORATION. ALL RIGHTS RESERVED. 7


8 Enterprise Information Information Management Management Unleashing the Power of Information 8


9 Growth and Opportunity Distribution Model Direct Sales Force AE, ISR, Specialists Strategic Alliances System Integrators SI / FSI VARs Distributors OEM Technology Alliances 9
10 Red Oxygen New Large EIM Functional Blocks Deep Integration Information Flows Compelling and Consistent User Experience Tools for the Developer Synchronized Releases Simple Package Installation


11 Red Oxygen Expected Release Schedule MAR 2014 FY14 Q2 FY14 Q3 Information Exchange Suite Content Suite Process Suite Experience Suite AppWorks Tempo Discovery Suite


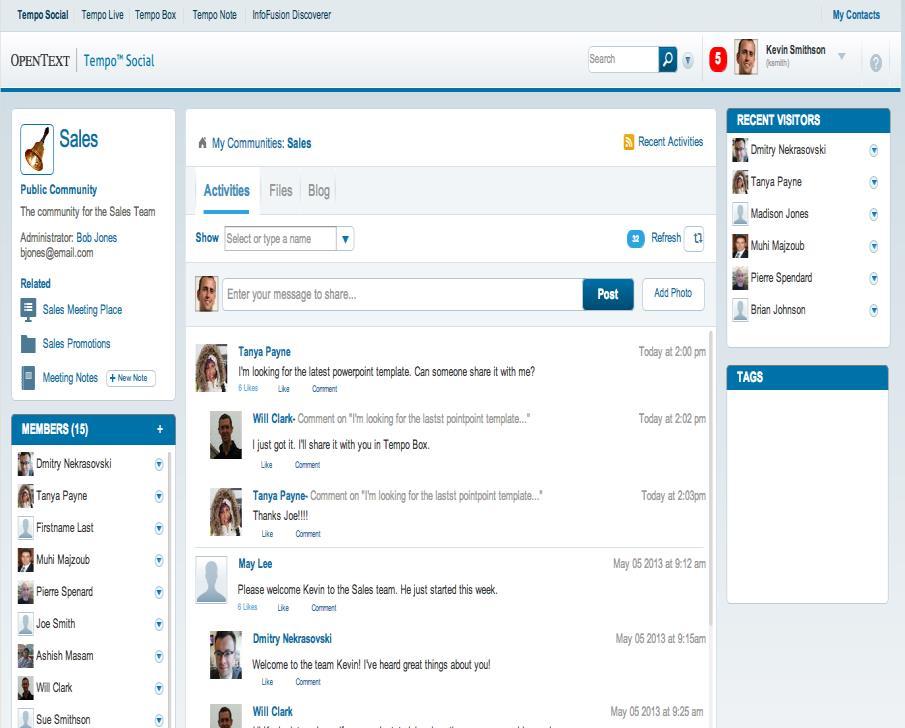

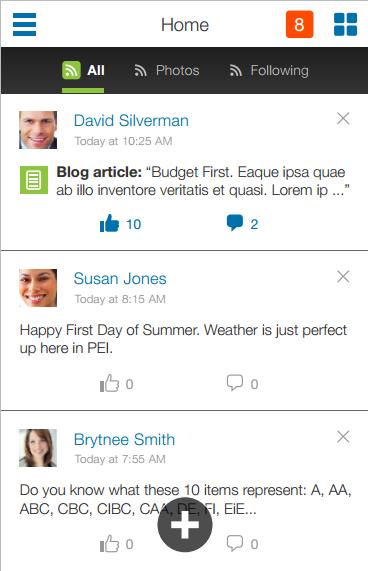

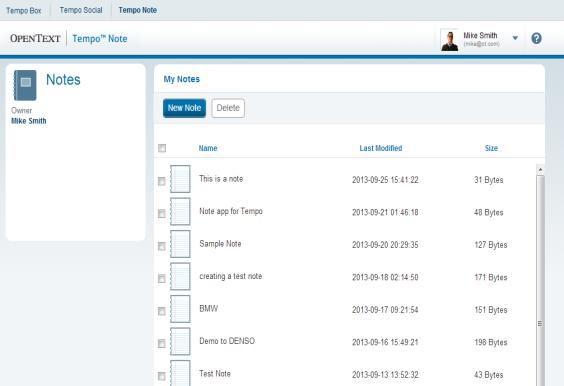

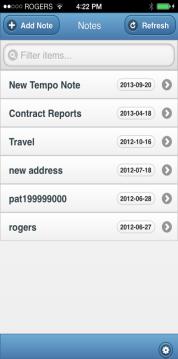


12 Tempo Tempo Social Tempo Box Tempo Note
13 OpenText Cloud Services 2 Billion Transactions a year 1.5 Million Users 25,000 Customers Enterprise, Social, Secure COPYRIGHT 2012 OPEN TEXT CORPORATION. ALL RIGHTS RESERVED. 13


14 From on Premises to the Cloud TempoBox TempoSocial Capture & OCR EIM Cloud Services ECM, BPM, CEM, ix, Discovery 14
15 Diverse Customer Base GOVERNMENT ENERGY PHARMACEUTICAL FINANCIAL TRANSPORTATION MANUFACTURING LEGAL MEDIA FOOD INSURANCE 15

16 Customer Win Bank of Hawaii Bank of Hawaii has invested in the OpenText ECM Suite of technologies. Bank of Hawaii plans to migrate its legacy solution to the OpenText ECM platform and leverage the platform for business process improvements, increases to productivity and future growth. 16

17 Customer Win National Security Technologies LLC National Security Technologies LLC (NSTec), the management and operating contractor at the Nevada National Security Site (Department of Energy), invested in the OpenText ECM Suite. OpenText ECM will provide NSTec with a certified system to store official records as digital media. Employees will be better able to search and find documents, and re-use relevant content. Other project goals include more streamlined and transparent workflow and business processes. 17


18 Customer Win Transport for London Transport for London (TfL) is the government body responsible for the transport system in London. Back in August last year TfL, asked OpenText to explain how Social Media could work in their organisation and together, we embarked on a journey including a PoC to help them collaborate internally during the Olympics; and we all know what a great job they did getting us around London during the games all helped by OpenText Tempo Social. 18
19 History of Growing Revenue Y/Y in $M: 7 Fiscal Years 1600 Service Customer Support Cloud License Year CAGR 18.7% * FY07 $595.7 FY08 $725.5 FY09 $785.7 FY10 $912.0 FY11 $ FY12 $ FY13 $ *FY06 Revenue $409.6 million COPYRIGHT 2012 OPEN TEXT CORPORATION. ALL RIGHTS RESERVED. 19
20 History of Growing Non-GAAP EPS Y/Y: 7 Fiscal Years $6.00 $ Year CAGR 27.6% * $4.00 $3.00 $2.00 $1.00 $- FY07 $1.46 FY08 $2.03 FY09 $2.51 FY10 $3.12 FY11 $4.07 FY12 $4.60 FY13 $5.57 COPYRIGHT *FY06 non-gaap 2012 OPEN TEXT EPS CORPORATION. $1.01 ALL RIGHTS RESERVED. 20
21 History of Growing Cash Flow: 7 Fiscal Years Year CAGR 27.8% * FY07 $111M FY08 $166M FY09 $186M FY10 $214M FY11 $244M FY12 $287M FY13 $339M *FY06 cash flow $61M B**Before the impact of special charges 21
22 Q1 FY14 Overview (Y/Y) OpenText delivered: $1.37 Non-GAAP-based Earnings Per Share Diluted* Up 4.6 percent $1.31 Q1 FY13 4.6% $1.37 Q1 FY14 $324.5 million Revenue Essentially Flat $81.5 million Non-GAAP-based Net Income* Up 6.0 percent $55.3 million License Essentially Flat $79.9 million Operating Cash Flow Up 29.4 percent * See reconciliation of Non-GAAP measures to GAAP measures at the end of this presentation 22
23 FY14 Q1 Financial Highlights Total Revenue Essentially Flat Y/Y Non-GAAP EPS Up 5% Y/Y Total revenue $324.5 million essentially flat Y/Y Revenue by Geography: North America 54% EMEA 37% Asia Pacific 9% 5 deals over $1 million, compared to 5 Y/Y 8 deals between $500K and $1 million, compared to 6 Y/Y Non-GAAP-based EPS was $1.37 compared to $1.31 Y/Y(1) GAAP based EPS was $0.52 compared to $0.33 Y/Y Non-GAAP-based operating margin 31% GAAP-based operating margin 16% Non-GAAP tax rate: 14% Total Revenue Up 7% License Revenue Essentially Flat Y/Y Operating Cash Flow Up 29% Y/Y $55.3 million down essentially flat Y/Y License revenue from new accounts: 34% Partners contributed 42% Average deal size > $75K: $268K $79.9 million in operating cash flow, compared to $61.8 million Y/Y Cash and cash equivalents $491.1 million Total debt $558.0 million as of September 30, 2013 (1) See reconciliation of Non-GAAP measures to GAAP measures at the end of this presentation 23


24 FY14 Q1 Revenue Breakdown Q1 F14 - License Revenue by Industry Total Revenue by Geography 9% 4% 4% 5% 7% 17% Services Financial Healthcare Technology 37% 54% Americas EMEA APJ 12% 12% 12% 13% 14% Basic Materials Public Sector Conglomerates Utilities Industrial Goods Consumer Goods Total Revenue Mix 18% 17% 13% License Cloud Services Customer Support Service 52% COPYRIGHT 2012 OPEN TEXT CORPORATION. ALL RIGHTS RESERVED. 24

25 Global Business Fiscal 2013 Stockholm, SE EMEA HQ Grasbrunn, DE Bellevue, WA San Francisco, CA Tucson, AZ Austin, TX WW HQ Waterloo, ON Richmond Hill, ON New York, NY Washington, DC Atlanta, GA Ottawa, ON Reading, UK Paris, FR Hong Kong Tokyo, JN Mumbai IN Hyderabad, IN Singapore Sao Paulo, SP APJ HQ Sydney, AU Johannesburg, SA Americas EMEA APJ Melbourne, AU F13 Revenue $734.6m FY13 Revenue $492.9m FY13 Revenue $135.8m Y/Y Growth 16% Y/Y Growth 4% Y/Y Growth 39% % of Business 53.89% % of Business 36.15% % of Business 9.96% 25
26 Business Highlights Services, financial and healthcare industries saw the most demand 5 license transactions over $1 million and 8 license transactions between $500K and $1 million Customer successes in the quarter include Bank of Hawaii, National Security Technologies LLC, Volkswagen India, NRI in Japan, and the Dangote Group Completed the acquisition of Cordys to expand BPM and case management solutions Positioned as a leader in the Gartner 2013 Magic Quadrant for Enterprise Content Management OpenText positioned as an ECM Leader by leading industry analyst firm (Forrester Research, Inc.) Radicati Group Names OpenText a "Top Player" in ECM Market OpenText leads the messaging services market (Davidson Consulting) Introduced integrated transmittal management and secure managed file transfer solution Announced new strategic partnership with ExactTarget Named one of Canada's Top 100 Employers 26
27 Dividend Program Highlights To reward stockholders investments OpenText has adopted a policy to declare non-cumulative quarterly dividends The Board of Directors has declared a dividend of US$0.30 per Common Share* Payable to shareholders of record on November 29, 2013 Dividend to be paid on December 20, 2013 OpenText has declared the dividend in U.S. dollars Registered holders may elect to receive dividends in U.S. dollars or Canadian dollars OpenText does not currently have a dividend reinvestment program (DRIP) *The Board of Directors is under no obligation to declare dividends in the future and the declaration of future dividends is wholly within its discretion 27
28 FY14 External Target Model* Revenue Type Fiscal 2013 Target Model F13 Actual Fiscal 2014 Target Model As a % of revenue Product License 20-25% 20.5% 20-25% Cloud Services 10-15% 12.7% 10-15% Product Maintenance 44-49% 48.3% 44-49% Professional Services 17-22% 18.5% 17-22% Non-GAAP Gross Margin Product License 92-94% 94.2% 93-95% Cloud Services 58-60% 58.4% 58-60% Product Maintenance 83-85% 83.8% 83-85% Professional Services 20-22% 22.2% % Non-GAAP Gross Margin 71-74% 71.3% 71-74% Non-GAAP Operating Expenses Development 13-15% 11.9% 12-14% Sales & Marketing 21-23% 20.6% 21-23% General & Admin 8-9% 7.7% 7-8% Depreciation 2% 1.8% 2% Non-GAAP Ops Margin 26-30% 29.3% 27-31% *This target model is not guidance. 28
29 Summary A leader in Enterprise Information Management (EIM) a large, growing and relevant market Enhanced innovation and exciting product portfolio Compelling operating margins, cash flow and quarterly dividend program 7 years consistent growth: o 27.6% CAGR: non-gaap EPS o 27.8% CAGR: Cash Flow from Operations* o 18.7% CAGR: Revenue B*Before the impact of special charges 29


30 The Power of Information
31 References ECM, BPM: Gartner Forecast Enterprise Software Markets, Q12 Update InfoExchange: Research and Markets, Computer-based Fax Markets, Gartner Enterprise Software Markets, Q12 Update, Davidson Consulting, Fax Server Industry Forecast, CEM: Gartner Magic Quadrant for Web Content Management, 10 Nov Discovery: Gartner Market Trends: Expect Disruption and Divergence in the E-Discovery Software Market, 16 Dec
32 Summary of Quarterly Results Q1 FY14 Q4 FY13 Q1 FY13 % Change (Q/Q) % Change (Y/Y) Revenue (million) $324.5 $347.3 $326.2 (6.6)% (0.5)% GAAP-based gross margin 67.2% 66.0% 62.7% 120 bps 450 bps GAAP-based operating margin 16.0% 14.2% 12.3% 180 bps 370 bps GAAP-based EPS, diluted $0.52 $0.71 $0.33 (26.8)% 57.6% Non-GAAP-based gross margin * 73.9% 72.9% 70.0% 100 bps 390 bps Non-GAAP-based operating margin** 30.6% 29.5% 28.7% 110 bps 190 bps Non-GAAP-based EPS, diluted* $1.37 $1.43 $1.31 (4.2)% 4.6% * See reconciliation of Non-GAAP measures to GAAP measures at the end of this presentation **before taxes and interest expense 32 Copyright OpenText Corporation. All rights reserved.
33 Summary of Quarterly Revenue Results* In millions Q1 FY14 Q4 FY13 Q1 FY13 % Change (Q/Q) % Change (Y/Y) License $55.3 $78.8 $55.7 (29.8)% (0.6)% Cloud services (0.7)% (5.1)% Customer support % 3.9% Professional service and other (4.1)% (8.5)% Total $324.5 $347.3 $326.2 (6.6)% (0.5)% * Individual line items may be adjusted by non-material amounts to enable totals to align to published financial statements. 33 Copyright OpenText Corporation. All rights reserved.
34 Appendix A Use of Non-GAAP Financial Measures In addition to reporting financial results in accordance with U.S. GAAP, the Company provides certain financial measures that are not in accordance with U.S. GAAP (non-gaap).these non-gaap financial measures have certain limitations in that they do not have a standardized meaning and thus the Company's definition may be different from similar non-gaap financial measures used by other companies and/or analysts and may differ from period to period. Thus it may be more difficult to compare the Company's financial performance to that of other companies. However, the Company's management compensates for these limitations by providing the relevant disclosure of the items excluded in the calculation of these non-gaap financial measures both in its reconciliation to the U.S. GAAP financial measures and its consolidated financial statements, all of which should be considered when evaluating the Company's results. The Company uses these non-gaap financial measures to supplement the information provided in its consolidated financial statements, which are presented in accordance with U.S. GAAP. The presentation of non-gaap financial measures are not meant to be a substitute for financial measures presented in accordance with U.S. GAAP, but rather should be evaluated in conjunction with and as a supplement to such U.S. GAAP measures. OpenText strongly encourages investors to review its financial information in its entirety and not to rely on a single financial measure. The Company therefore believes that despite these limitations, it is appropriate to supplement the disclosure of the U.S. GAAP measures with certain non-gaap measures defined below. Non-GAAP-based net income and non-gaap-based EPS are calculated as net income or net income per share on a diluted basis, excluding, the amortization of acquired intangible assets, other income (expense), share-based compensation, and special charges, all net of tax. Non-GAAP-based gross profit is the arithmetical sum of GAAP-based gross profit and the amortization of acquired technology-based intangible assets. Non-GAAP-based gross margin is calculated as non-gaapbased gross profit expressed as a percentage of revenue. Non-GAAP-based income from operations is calculated as income from operations, excluding, the amortization of acquired intangible assets, special charges, and share-based compensation. Non-GAAP-based operating margin is calculated as non-gaap-based income from operations expressed as a percentage of revenue. The Company's management believes that the presentation, of the above defined non-gaap financial measures, provides useful information to investors because they portray the financial results of the Company before the impact of certain non-operational charges. The use of the term non-operational charge is defined for this purpose as an expense that does not impact the ongoing operating decisions taken by the Company's management and is based upon the way the Company's management evaluates the performance of the Company's business for use in the Company's internal reports. In the course of such evaluation and for the purpose of making operating decisions, the Company's management excludes certain items from its analysis, including amortization of acquired intangible assets, special charges, share-based compensation, other income (expense), and the taxation impact of these items. These items are excluded based upon the manner in which management evaluates the business of the Company and are not excluded in the sense that they may be used under U.S. GAAP. The Company believes the provision of supplemental non-gaap measures allow investors to evaluate the operational and financial performance of the Company's core business using the same evaluation measures that management uses, and is therefore a useful indication of OpenText's performance or expected performance of future operations and facilitates period-to-period comparison of operating performance (although prior performance is not necessarily indicative of future performance). As a result, the Company considers it appropriate and reasonable to provide, in addition to U.S. GAAP measures, supplementary non-gaap financial measures that exclude certain items from the presentation of its financial results in this presentation. The following charts provide (unaudited) reconciliations of U.S. GAAP-based financial measures to non-u.s. GAAP-based financial measures for the following periods presented: 34
35 Reconciliation of Selected Non-GAAP Measures Q1 FY14 (in 000s USD) Three months ended September 30, 2013 GAAP GAAP % of Rev Adjustments FN Non- GAAP Non-GAAP % of Rev COST OF REVENUES Cloud Services $14,265 $(38) 1 $14,227 Customer Support 22,170 (97) 1 22,073 Professional Service and Other 45,435 (170) 1 45,265 Amortization of acquired technology-based intangibles 21,530 (21,530) 2 _ GAAP-based gross profit and gross margin (%) / Non-GAAP-based gross profit and gross margin (%) OPERATING EXPENSES 218, % 21, , % Research and development 40,216 (728) 1 39,488 Sales and marketing 69,413 (2,353) 1 67,060 General and administrative 28,886 (1,226) 1 27,660 Amortization customer based intangibles 17,277 (17,277) 2 _ Special charges 3,731 (3,731) 4 _ GAAP-based income from operations and operating margin (%) / Non-GAAP based income from operations and operating margin (%) 52, % 47, , % Other income (expenses), net 1,926 (1,926) 6 _ Provision for (recovery of) income taxes 18,954 (5,681) 7 13,273 GAAP-based net income / Non-GAAP-based net income $30,630 $50,905 8 $81,535 GAAP-based EPS / Non-GAAP-based EPS - diluted $0.52 $ $ Copyright OpenText Corporation. All rights reserved.
36 Reconciliation of Selected Non-GAAP Measures Q1 FY14 FOOTNOTES 1 2 Adjustment relates to the exclusion of share based compensation expense from our Non-GAAP-based operating expenses as this expense is excluded from our internal analysis of operating results Adjustment relates to the exclusion of amortization expense from our Non-GAAP-based operating expenses as the timing and frequency of amortization expense is dependent on our acquisitions and is hence excluded from our internal analysis of operating results. 3 GAAP-based and Non-GAAP-based gross profit stated in dollars, and gross margin stated as a percentage of revenue. 4 Adjustment relates to the exclusion of Special charges from our Non-GAAP-based operating expenses as Special charges are generally incurred in the aftermath of acquisitions and are not indicative or related to continuing operations and are hence excluded from our internal analysis of operating results. 5 GAAP-based and Non-GAAP-based income from operations stated in dollars, and operating margin stated as a percentage of revenue. 6 7 Adjustment relates to the exclusion of Other income (expense) from our Non-GAAP-based operating expenses as Other income (expense) relates primarily to the transactional impact of foreign exchange and are generally not indicative or related to continuing operations and are hence excluded from our internal analysis of operating results. Adjustment relates to differences between the GAAP-based tax provision of approximately 38% and a Non-GAAP-based tax rate of 14%; these rate differences are due to the income tax effects of expenses that are excluded for the purpose of calculating Non-GAAP-based adjusted net income. 8 Reconciliation of Non-GAAP-based adjusted net income to GAAP-based net income: Three Months Ended September 30, 2013 Per Share Diluted Non-GAAP-based net income $81,535 $1.37 Less: Amortization 38, Share-based compensation 4, Special charges 3, Other (Income) expenses, net (1,926) (0.03) GAAP based provision for (recovery of) income taxes 18, Non-GAAP-based provision for income taxes (13,273) (0.23) GAAP-based net income $30,630 $ Copyright OpenText Corporation. All rights reserved.
37 Reconciliation of Selected Non-GAAP Measures Q4 FY13 (in 000s USD) Three months ended June 30, 2013 GAAP GAAP % of Rev Adjustments FN Non- GAAP Non-GAAP % of Rev COST OF REVENUES Cloud Services $17,696 $(48) 1 $17,648 Customer Support 25,351 (159) 1 25,192 Professional Service and Other 47,879 (255) 1 47,624 Amortization of acquired technology-based intangibles 23,579 (23,579) 2 _ GAAP-based gross profit and gross margin (%) / Non-GAAP-based gross profit and gross margin (%) OPERATING EXPENSES 229, % 24, , % Research and development 42,383 (526) 1 41,857 Sales and marketing 79,338 (2,476) 1 76,862 General and administrative 27,857 (1,958) 1 25,899 Amortization customer based intangibles 17,197 (17,197) 2 _ Special charges 6,767 (6,767) 4 _ GAAP-based income from operations and operating margin (%) / Non-GAAP based income from operations and operating margin (%) 49, % 52, , % Other income (expenses), net (4,180) 4,180 6 _ Provision for (recovery of) income taxes (869) 14, ,783 GAAP-based net income / Non-GAAP-based net income $42,172 $42,493 8 $84,665 GAAP-based EPS / Non-GAAP-based EPS - diluted $0.71 $ $ Copyright OpenText Corporation. All rights reserved.
38 Reconciliation of Selected Non-GAAP Measures Q4 FY13 FOOTNOTES 1 2 Adjustment relates to the exclusion of share based compensation expense from our Non-GAAP-based operating expenses as this expense is excluded from our internal analysis of operating results Adjustment relates to the exclusion of amortization expense from our Non-GAAP-based operating expenses as the timing and frequency of amortization expense is dependent on our acquisitions and is hence excluded from our internal analysis of operating results. 3 GAAP-based and Non-GAAP-based gross profit stated in dollars, and gross margin stated as a percentage of revenue. 4 Adjustment relates to the exclusion of Special charges from our Non-GAAP-based operating expenses as Special charges are generally incurred in the aftermath of acquisitions and are not indicative or related to continuing operations and are hence excluded from our internal analysis of operating results. 5 GAAP-based and Non-GAAP-based income from operations stated in dollars, and operating margin stated as a percentage of revenue. 6 7 Adjustment relates to the exclusion of Other income (expense) from our Non-GAAP-based operating expenses as Other income (expense) relates primarily to the transactional impact of foreign exchange and are generally not indicative or related to continuing operations and are hence excluded from our internal analysis of operating results. Adjustment relates to differences between the GAAP-based tax recovery of approximately 2% and a Non-GAAP-based tax rate of 14%; these rate differences are due to the income tax effects of expenses that are excluded for the purpose of calculating Non-GAAP-based adjusted net income. 8 Reconciliation of Non-GAAP-based adjusted net income to GAAP-based net income: Three Months Ended June 30, 2013 Per Share Diluted Non-GAAP-based net income $84,665 $1.43 Less: Amortization 40, Share-based compensation 5, Special charges 6, Other (Income) expenses, net 4, GAAP based provision for (recovery of) income taxes (869) (0.01) Non-GAAP-based provision for income taxes (13,783) (0.23) GAAP-based net income $42,172 $ Copyright OpenText Corporation. All rights reserved.
39 Reconciliation of Selected Non-GAAP Measures Q1 FY13 (in 000s USD) Three months ended September 30, 2012 GAAP GAAP % of Rev Adjustments FN Non- GAAP Non-GAAP % of Rev COST OF REVENUES Customer Support $25,823 $(38) 1 $25,785 Professional Service and Other 50,052 (177) 1 49,875 Amortization of acquired technology-based intangibles 23,782 (23,782) 2 _ GAAP-based gross profit and gross margin (%) / Non-GAAP-based gross profit and gross margin (%) OPERATING EXPENSES 204, % 23, , % Research and development 39,906 (338) 1 39,568 Sales and marketing 64,515 (1,666) 1 62,849 General and administrative 26,964 (883) 1 26,081 Amortization customer based intangibles 17,252 (17,252) 2 _ Special charges 9,554 (9,554) 4 _ GAAP-based income from operations and operating margin (%) / Non-GAAP based income from operations and operating margin (%) 40, % 53, , % Other income (expenses), net (71) 71 6 _ Provision for (recovery of) income taxes 16,219 (3,702) 7 12,517 GAAP-based net income / Non-GAAP-based net income $19,429 $57,463 8 $76,892 GAAP-based EPS / Non-GAAP-based EPS - diluted $0.33 $ $ Copyright OpenText Corporation. All rights reserved.
40 Reconciliation of Selected Non-GAAP Measures Q1 FY13 FOOTNOTES 1 2 Adjustment relates to the exclusion of share based compensation expense from our Non-GAAP-based operating expenses as this expense is excluded from our internal analysis of operating results Adjustment relates to the exclusion of amortization expense from our Non-GAAP-based operating expenses as the timing and frequency of amortization expense is dependent on our acquisitions and is hence excluded from our internal analysis of operating results. 3 GAAP-based and Non-GAAP-based gross profit stated in dollars, and gross margin stated as a percentage of revenue. 4 Adjustment relates to the exclusion of Special charges from our Non-GAAP-based operating expenses as Special charges are generally incurred in the aftermath of acquisitions and are not indicative or related to continuing operations and are hence excluded from our internal analysis of operating results. 5 GAAP-based and Non-GAAP-based income from operations stated in dollars, and operating margin stated as a percentage of revenue. 6 7 Adjustment relates to the exclusion of Other income (expense) from our Non-GAAP-based operating expenses as Other income (expense) relates primarily to the transactional impact of foreign exchange and are generally not indicative or related to continuing operations and are hence excluded from our internal analysis of operating results. Adjustment relates to differences between the GAAP-based tax provision of approximately 45% and a Non-GAAP-based tax rate of 14%; these rate differences are due to the income tax effects of expenses that are excluded for the purpose of calculating Non-GAAP-based adjusted net income. 8 Reconciliation of Non-GAAP-based adjusted net income to GAAP-based net income: Three Months Ended September 30, 2012 Per Share Diluted Non GAAP net income $76,892 $1.31 Less: Amortization 41, Share-based compensation 3, Special charges 9, Other (income) expenses 71 - GAAP based provision for (recovery of) income taxes 16, Tax on Non-GAAP based provision (12,517) (0.21) GAAP net income $19,429 $ Copyright OpenText Corporation. All rights reserved.