Water Infrastructure Resiliency Planning for the City of Norfolk. Cherryl Barnett, P.E., Engineering Manager, Department of Utilities
|
|
|
- Sharleen Blankenship
- 5 years ago
- Views:
Transcription
1 Water Infrastructure Resiliency Planning for the City of Norfolk Cherryl Barnett, P.E., Engineering Manager, Department of Utilities
2 Agenda 1. City of Norfolk Resiliency Efforts 2. Norfolk s Water System 3. Resilience of Norfolk s Water System 4. Next Steps 5. Conclusions

3 City of Norfolk Resiliency Efforts

4 Current Challenge - 90% developed area - 12 feet above MSL Highest Relative SLR on East Coast Approx. SLR = 14 inches since 1930
5 Resiliency Efforts 2015 Dutch Dialogues 100 Resilient Cities (Rockefeller Foundation) Resilience Strategy Vision 2100 Flood Risk Study (with USACOE) Ohio Creek Project Water Infrastructure Resiliency Planning

6 Ohio Creek Conceptual Design
7 Norfolk s Water System


8 Norfolk s Water System the Early Days Moores Bridges mid-1870s Lake Prince construction


9 Norfolk s Water System Today Norfolk s raw water sources are located throughout southeast Virginia 5 Reservoirs in Norfolk and Virginia Beach 3 Reservoirs in Suffolk and Isle of Wight 2 River Sources on Nottoway and Blackwater Rivers 4 Deep Wells in Suffolk Norfolk operates two water treatment plants: 37 th Street and Moores Bridges with a combined capacity of 136 MGD 3
10 Resilience of Norfolk s Water System
11 How Can We Improve Resilience of Norfolk s Water System? For over 140 years, the City of Norfolk has consistently treated and delivered drinking water to our customers. Recent events with widespread flooding: 2009: Tropical Depression Ida and a Nor easter 2011: Hurricane Irene 2012: Hurricane Sandy 2016: Hurricane Matthew
12 Flood and Wind Vulnerability Assessment and Hazard Mitigation Plan Evaluate vulnerabilities to the City s water production infrastructure and develop adaptation measures to improve resiliency Moores Bridges Water Treatment Plant 37 th Street Water Treatment Plant

13 Risk Based Evaluation Phase 1 Climate Analysis should Norfolk prepare for? Phase 2 Vulnerability Analysis Phase 3 Adaptation Analysis
14 Benefits of Risk Management Approach Provides transparent, accountable and defensible business case for resiliency implementation Quantifies potential risks and impacts Facilitates analyses of tradeoffs Streamlines evaluation of multiple alternatives

15 Phase 1: Climate Analysis should we prepare for? Critical Flood Elevation Established to evaluate what is at risk The elevation to which assets must be protected may vary depending on funding agency requirements

16 Storm Levels Considered 100 Year Storm Recurrence: El 7.6 ft City of Norfolk Building Code Ordinance: El 10.6 ft Hurricane Storm Surge Category 3: El 13.7 ft

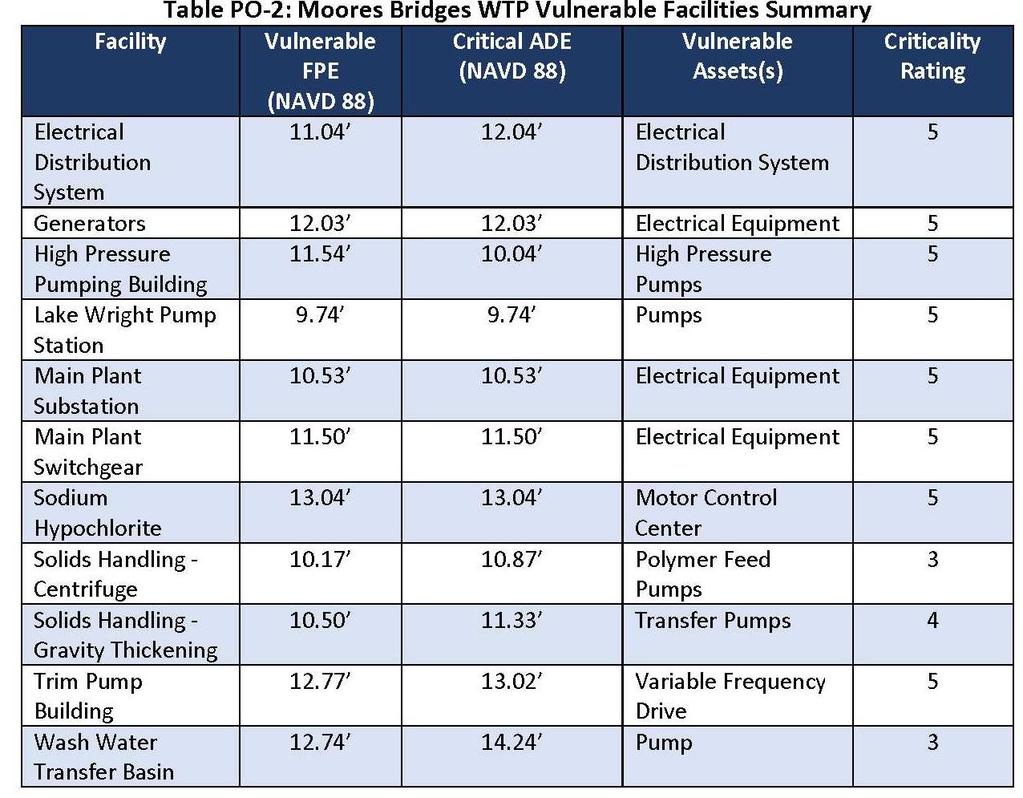
17 Moores Bridges WTP

18 37 th Street WTP

19 Phase 2: Vulnerability Analysis Holistic understanding of magnitude of impact Field Survey, Facility Database, Asset Database, and Storm Surge Placards


20 Investigate Flood Pathways and Establish Threshold Flood Elevations Rollup Doors Doorways & Windows Areaways Tunnels Grates Electrical Conduits and Manholes Other flood pathways: open process tanks, outfalls, storm drains and plant drains, wet wells, and interconnected buildings.


21 Facility Analysis Flood Pathway Assessment

22 Critical Flood Elevation
23 Facility Analysis Field Survey

24 Phase 3: Adaptation Analysis Prioritize processes/assets for adaptation Discuss stakeholder objectives Evaluate alternative adaptation strategies, including feasibility, costs and levels of protection provided
25 Asset Criticality Assessment Must be Protected High Criticality Impact conveyance, disinfection, or power generation E.g.: Influent Motors, Effluent Pumps, Emergency Generators, Main Plant Feed and Transformers, Chlorination or UV Equipment Moderate Criticality Reduce level of service E.g.: Collectors for Settling Tanks, Sludge Pumps, Aeration Blowers Cost-Benefit Driven Decision Low Criticality Minor or no impact to process E.g.: Odor Control Blowers and Scrubbers, Maintenance Equipment
26

27 Asset Level Adaptation Strategies Individual Asset Multiple Assets Generator

28 Adaptation Recommendations

29

30

31 Implementation High pressure pump station with flood wall

32 Implementation Overall cost of implementation of protective measures at Moores Bridges: $520K

33 Storm Surge Placards Emergency Preparedness: These charts allow plant staff to quickly determine vulnerability to flood from approaching storms and begin implementing temporary adaptation strategies, such as sandbags.
34 Next Steps


35 New Moores Bridges WTP Emergency Entrance
36 Integrating Asset Management and Resiliency Planning An Asset Management Plan was completed for Moores Bridges in 2017 Asset Management and Resiliency Planning include similar evaluations of the same assets Combining AM and Resiliency together reduces redundancy and improves capital planning City of Norfolk will incorporate Resiliency Planning into Asset Management Program for City sewer and water infrastructure

37 Resiliency Planning Dashboard
38 Conclusions
39 . Resiliency Adaptation Requires Balance Meet permits and regulations Protect infrastructure Protect the environment Protect public health Ease of Implementation Ease of Maintenance Schedule Constraints Budget Constraints
40 Conclusions Increases water production reliability during extreme storm events for Norfolk citizens and customers Reduces risk of flood damage and costly repair / replacement of infrastructure Provides a cost effective solution to improve resilience to many potential storm events Provides a framework for Department of Utility infrastructure moving forward
41 Acknowledgements: Dwayne Amos, Associate Vice President, Hazen and Sawyer Chris Harbin, Water Production Manager, Norfolk Utilities Questions?
42 Webinar Contacts: Clint Shealy, PE Assistant City Manager - Columbia Water ceshealy@columbiasc.net; (803) Nicolle Boulay, PE VA-AWWA Education Committee Chair nboulay@loudounwater.org; (571) Cherryl Barnett, PE Engineering Manager Norfolk Utilities cherryl.barnett@norfolk.gov; (757)