Green Urban Design: Lessons from around the globe. Claire Bonham-Carter, Director of Sustainable Development, EDAW
|
|
|
- Hugo Thornton
- 5 years ago
- Views:
Transcription

1 Green Urban Design: Lessons from around the globe Claire Bonham-Carter, Director of Sustainable Development, EDAW
2 Policy Drivers in the United Kingdom Drivers for change
3 Drivers for Change Investors We would fund environmentally efficient buildings, but there is no demand for them. CSR / BRANDING Occupiers HIGHER FUEL BILLS; MARKETING/IMAGE We would like to have environmentally efficient buildings, but there are very few available. Developers We would ask for environmentally efficient buildings, but the investors won t pay for them. PLANNING POLICY Constructors We can build environmentally BUILDING efficient buildings, CODES but the developers don t ask for them.
4 UK Government position The evidence that climate change is happening, and that man-made emissions are its main cause, is strong and indisputable The Government believes that climate change is the greatest long-term challenge facing the world today. Addressing climate change is therefore the Government s principal concern for sustainable development.


5 UK: Suite of policy tools: Zero carbon by 2016 / 2019

6 Code for Sustainable Homes

7 The path to zero carbon homes
8 Planning and Climate Change: Supplement to Planning Policy Statement 1 Spatial distribution, location and design of new development should be planned to limit carbon dioxide emissions expect proposed development to connect to an identified decentralised energy system, or be designed to be able to connect in future co-locating potential heat customers and heat supplier

9 District Energy Systems: what are they


10 Planning and Climate Change: Supplement to Planning Policy Statement 1 Percentage low carbon/renewable energy in new development Specific areas should expect significant proportions of renewables


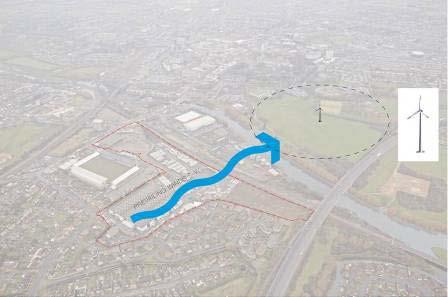
11 Example - Barrier Park, East London homes, hotels, retail, new aquarium 3500 homes Our site 1000 homes

12 The Carbon Challenge English Partnerships Competition to fast track zero or near zero carbon development. Challenge developers to accelerate their response to climate change At least five sites of more than 200 homes in first year To achieve Code for Sustainable Homes Level Six zero carbon, very low water use, strict materials requirements, good design, liveability etc.


13 Carbon Challenge: Impact on designs

14 Carbon Challenge: Impact on designs


15 Eco towns Ten small new towns of 5,000 20,000 homes To achieve zero carbon development and more sustainable living 30-50% affordable housing, mix of uses including schools, retail, business and leisure Public transit, cycling and pedestrian links 5 to be built by 2016, the rest by 2020
16 Case study


17 Upton, Northampton United Kingdom


18 Urban Design 44-hectare greenfield site, 1382 homes Mixed-use including schools and retail Densities: 35 to 60 dph Community engagement Pedestrian friendly street design, promoting safety and visibility

19 Integrated Stormwater Management Vegetation filled swales to collect, convey, clean and process stormwater runoff Integral part of the design
 Some net zero carbon PV")

20 Home Design All houses BREEAM Excellent (LEED Gold/Platinum equivalent) Some net zero carbon PV tiles provide approx. 960 kwh/yr Solar thermal systems on south facing homes All homes harvest rainwater

21 Ecology and Habitat 4 hectare Country Park and additional woodland area for recreation Interconnected foraging network Barn restored for bats

22 Winner of the RTPI Sustainable Communities Award 2007
23 Quantification of Sustainability costs and benefits Sustainable Systems Integration Methodology
24 Integrated Whole Systems Thinking Tool for analyzing most appropriate and cost effective sustainability measures for a particular site Developed in part due to help clients address California s carbon reduction targets Best sustainability bang for your $$ Good Better Best options


25 Sustainable Systems Integration Model - SSIM TM Urban / Community Form Transportation Building Energy Public Realm Energy Ecology carbon sequestration Ecology urban heat island Community Agriculture Water & Wastewater Socio-Cultural Green Building / Materials Greenhouse Gas Emissions / Carbon Copyright 2008 EDAW, Inc. Patent pending. All rights reserved. Sustainable Systems Integrated Model, SSIM and the SSIM logo are trademarks of EDAW, Inc.


26 GIS Interface, SSIM Draw alternative concepts Use Yield Model, Urban Form Analysis to identify most sustainable scheme Model & Generate Land Program Get SSIM cost / benefit Results SSIM Model good, better, best packages for each sustainability issue identifying sustainability benefits, costs and cost savings


27 Tanguu, China

28 Scheme alternatives Scheme 1 Scheme 2 Scheme 3 Develop alternative schemes and assess sustainability indicators


29 Plan Comparison Scheme 1 Scheme 2 Scheme 3 E.g: Sustainability Indicators


30 e.g. Access to Local Services Scheme 1 Scheme 2 Scheme 3


31 e.g. Access to Transit Scheme 1 方案 1( 原控规 ) Scheme 2 方案 2 Scheme 3 方案 3


32 Selected Scheme - 3 Scheme 3 selected as Baseline Scenario
33 Low Carbon Program Development Examine each core theme & model good, better, best options Building Energy good better best Domestic Water good better best Transportation good better best Public Realm good better best Renewable Energy good better best First-Costs Life Cycle Costs Environmental Benefit Market Cost Acceptance Optimized Packages for Each Core Theme Packages Combined into Master Sustainability Programs


34 Energy and GHG Offsets: Landscape Ecology Biodiversity Green Infrastructure Networks Micro-Climate Carbon Sequestration Urban Forestry Community agriculture Urban Heat Island
35 Community agriculture Water Need Min. CO2eq Reduction Food Source Benefit First Cost Operating Cost (community liaison) Good 30 AC 60 AcFt/Yr 71 tons per year 16% of annual household produce demand met $0* *or $185K if developer is operator $75,000* *additional if developer is operator Better 80 AC 160 AcFt/Yr 195 tons per year 45% of annual household produce demand met $0* *or $225K if developer is operator $75,000* *additional if developer is operator Best 150 AC 300 AcFt/Yr 368 tons per year 85% reduction in offsite produce need for households $0* *or $300K if developer is operator $75,000* *additional if developer is operator
36 Carbon Sequestration Water Need (first 3-5 years only) First Cost Operating Cost CO2eq Reduction (annual ave 90 yrs) Total Community CO2 Sequestration (annual average over 90 years) Base case ,900 Tons from community landscape Good 100 AC Better 300 AC Best 500 AC 150 AcFt/Yr $150,000 In existing OS mgnt. budget 450 AcFt/Yr $450,000 In existing OS mgnt. budget 750 AcFt/Yr $750,000 In existing OS mgnt. budget 808 tons 7,708 tons per year 2420 tons 9,320 tons per year 4033 tons 10,933 tons per year RMLUI Land Source: Use Conference EDAW 2008, March US 2009 EPA, Ko et al, Shasta Co Pilot Program


37 Sustainability Measures: Domestic Water Reduction Land Use Landscape palettes Building Fixtures Treated sewage effluent reuse Stormwater reuse Rainwater capture Gray water reuse Rainfall 14"/year Rainwater CII Indoor Catchment 160 AFY Potable Uses Residential Indoor 350 AFY Clothes Washer 310 AFY Shower 300 AFY Other Potable Groundwater Extraction & Treatment System 210 AFY 2,830 AFY Losses Deep Energy Groundwater Stormwater BMPs Stormwater Capture & Treatment On-Site Gray Water Treatment Residential Indoor 390 AFY Toilets CII Indoor 80 AFY Toilets 120 AFY Cooling Landscape 910 AFY Residential CII Public GHG Emissions 190 AFY 270 AFY 1,710 AFY Pajaro River Energy Wastewater Treatment & Storage GHG System 40 AFY Losses Agriculture 90 AFY Lake
38 Domestic water reduction: Baseline Scenario SSIM Water


39 Domestic Water Reduction: Best Scenario SSIM Water 水


40 Domestic water reduction - results


41 Domestic water reduction - results 水系统成本

42 Domestic water reduction - results

43 Core Themes / Measures Gaming Board 专项 Themes Select Packages for These Programs A B C Building Energy Reductions Domestic Water Reductions Better Best Best Best Best Best Automobile Use Reductions Public Realm Energy Reductions Better Better Better Best Better Better Good Good Good Renewable Energy Additions

44 Master Program Comparisons A B C

45 Summary Example:
46 Summary Planning policy is a powerful tool for change Planners need to understand new issues, e.g energy Clear route maps showing timeline and expected achievements Competition / exemplar projects to lead the market Use of tools to quantify benefits both in terms of carbon and dollars (for planning authority and developer)
47