PPC s Development Plan
|
|
|
- Alaina Poole
- 5 years ago
- Views:
Transcription
1 PUBLIC POWER CORPORATION PPC s Development Plan Prof. Nikos Hatziargyriou Executive Vice-Chair & Deputy CEO 2 nd South East Europe Energy Dialogue International Conference, Therssaloniki, May
2 Energy Policy Drivers Regulation of Monopolies Innovation and Competitiveness Low Prices And Efficiency Internal Market Primary Energy Security of Supply Environment Sources Reliability and Quality Capacity Nature Preservation Climate Change Kyoto and Post-Kyoto 1

3 The Vision 2
4 Profile of the Greek Electricity Market Trends Demand expected to grow by 2,5 % p.a MW additional new capacity (including Renewables) in Greece by 2020 CO 2 costs to rise, starting from 2008 Increased penetration by other generators and suppliers Emission limits to tighten further PPC s ageing and inefficient plants need urgently to be replaced PPC s lignite mines stripping ratio increasingly unfavorable 3
5 Investments Generation Transmission System Distribution Networks 4
6 PPC Power Plant Portfolio (exceeding 12.7 GW) Installed Capacity (in MW) Vintage (Weighted Age in Years) Interconnected System Hydro Lignite Fuel Oil Nat Gas Total Renewables 0.3% Hydro 24% Lignite 41% Islands Crete Rhodes Small islands Total Nat Gas 16% Islands 13% Oil 6% Renewables Total 91 Installed Power Capacity by Fuel Type Grand Total MW 5
7 PPC is determined to be an efficient and competitive generator in the liberalized electricity environment Objectives Strategies PPC to have a power plant portfolio that: Ensures reliability and efficiency Reduces generation costs Sustains competitiveness Respects the environment Build plants embodying new technologies Decommission of aged and inefficient power plants Accelerate completion of hydro projects Decrease CO 2 emissions Improve procurement practices 6
8 PPC Renewables on track MW Portfolio today [MW] Wind small hydro PV Geothermal Permission for research Under study Application submitted Permission granted Under construction Operational 7
9 PPC Renewables : 10% market share today Strengths: Market leader in small hydro capacity R09A Fifth in wind installed capacity The only company that has a presence in all renewable fields Major Projects: 50 MW photovoltaic park in Megalopolis MoUs / Joint Ventures with: ETVA-VI.PE. for the development of 35 MW of photovoltaic parks in industrial zones EDF Energies Nouvelles for the construction of 122 MW of wind farms S&B for the development of up to 120 MW of geothermal power on the island of Milos 8

10 PPC Renewables targeting 20% market share by 2014 MW R09A Required investment till 2014 : 1.9 bil. Average IRR for new projects : 18%] Installed Capacity Year-End [MW] Wind Small Hydro Photovoltaic Georthermal Not identified yet 9
11 Generation mix on 10/10/ kwh Wind Hydro. Natural Gas Oil Lignite ώρα Καθ. Νικόλαος Χατζηαργυρίου 10 Αντιπρόεδρος & Αναπλ. Δ/νων Σύμβουλος ΔΕΗ
12 Generation mix on 26/6/ kwh Wind Hydro Natural Gas. Oil Lignite ώρα 11 Καθ. Νικόλαος Χατζηαργυρίου Αντιπρόεδρος & Αναπλ. Δ/νων Σύμβουλος ΔΕΗ
13 Primary Energy Sources National Sources: Lignite in Megalopolis : 25 years. Lignite in Western Macedonia: 35 years. Imported Sources: Natural Gas : 50 years. Coal : 200 years. 12
14 Old and inefficient plants identified to be decommissioned (retired or in cold reserve) GROUPING Power Station Fuel Capacity (MW) Commissionin g year Ptolemais I,II,III Lignite LIPTOL I,II Lignite Aghios Georgios VIII Natural gas Lavrio III Natural gas Megalopolis I,II Lignite Ptolemais IV Lignite Aghios Georgios IX Natural gas Lavrio I,II HFO Cyclades Islands Diesel and HFO 200 Aliveri III, IV HFO
15 660 MW new Hydro Capacity to be commissioned by 2016 R13A Power Station Unit Installed Capacity (MW) Commissioning Year Smokovo I Mesohora I, II 161, Ilarionas I, II Metsovitiko II Sykia * I Pefkofito * I Temenos I 16, * Subject to completion of dams by the State 14
16 PPC s s accelerated new-build plan : MW by 2014 Power Station Fuel Installed Capacity (MW) Commissionin g Year Aliveri V Natural Gas Megalopolis V Natural Gas Florina II Lignite Ptolemaida V Lignite Aliveri VI 1 Hard Coal Larimna I 1 Hard Coal In negotiations to be constructed with partners; 200MW each 15
17 PPC s s Power Plant Portfolio by 2014 Installed Capacity (in MW) Vintage (Weighted Age in Years) (2007) Interconnected System Hydro Lignite Fuel Oil 0 Nat Gas Coal Total Lignite 30% Coal 10% Islands Crete (oil) Rhodes (oil) Small Islands(o Total Natural Gas in Islands Crete Renewables Total 950 Hydro 22% Renewables Nat Gas 6% Islands 16% (Nat Gas) 6% Installed Power Capacity by Fuel Type Islands (Oil) 13% Grand Total MW 16


18 Reduction of Environmental Effects 17
19 Investments Generation Transmission System Distribution Networks 18
20 Drivers and targets for investments in Transmission Drivers Targets Significant increase in peak-load nationwide (6,5% this year) Need for upgrading national transmission infrastructure Significant increase in renewable energy projects Increase of transnational trading Transmission System expansion Reliability increase Interconnection of Cyclades islands Upgrade of interconnection to Turkey Interconnection of renewable energy sources 19
21 1.410 m investments in Transmission network m for agreed /planed projects for m new extra-high voltage (EHV) 400/150 kv substations 700m new 400 kv lines 250m interconnection of Cyclades 60m interconnections with Turkey 50m Various projects 20 m for expansion of 400 kv lines 40 m for expansion of 150 kv lines 20
22 Investments Generation Transmission System Distribution Networks 21
 3000 2000 200% Growth From 1987 till today 1000 1987 1991 1995 1999 2003")
23 Steep demand growth in Athens region, challenging the power network : 14% increase only this year 4000 Maximum Demand During the Year (MW) % Growth From 1987 till today

 23")
24 Problems in 2012 if regular investments only ΑTHENS = Attica Substations and Distribution Centers projected load exceeding 80% during summer 2012 peaks (calculated estimation) 23
25 Drivers and targets for infrastructure investments in Distribution Drivers Significant increase in peakload during the summer months everywhere (e.g. 14% in Athens region, 10% in Thessaloniki this year) Upgrading and reinforcing existing urban networks Improve PPC s services to the customer Reduce costs Targets Improve Power quality Reduction of network outages Automate network management and metering Minimization of time-torepair Power loss reduction Better demand management 24
26 Investments of 2.8 billion Euros (1) for Distribution Network Infrastructure in (included in RAB) Distribution Infrastructure 900 MVA new HV/MV substations 1 Attica & Thessaloniki 700 MVA capacity increase of existing HV/MV substations 100 km of new HV cables 400 km HV and MV cables upgrades / replacement 615 million for reinforcement of the Distribution Network 2 Nationwide 1,500 km per year of new MV and LV lines and several MV/LV substations 3 Routine network extensions with customer sharing costs 2,200 million for 180,000 new customer connections per year routine distribution network extensions 4,000 km network per year (1) :subject to regulatory approval 25
27 Investments of 1 1 billion (1) for automation (included in RAB) 100 million for automatic network management Installation of automatic network switches to increase remote control and fault detection Incorporation of all substations to Distribution Management System (DMS) Power quality monitoring system Telecontrol 950 million for telemetering 1 Automatic Meter Reading in all customers, if co-funded (1) : subject to regulatory approval 26

28 SENCAP: The investment Vehicle of PPC and ContourGlobal 27


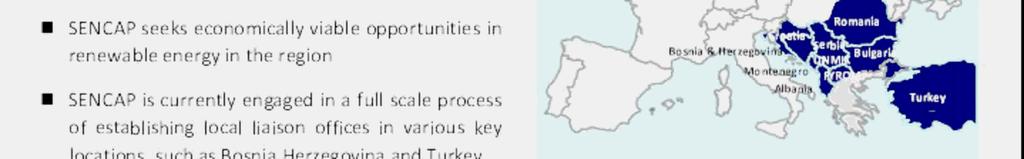
29 SENCAP: Acquisition and Development of Assests in S.E. Europe 28

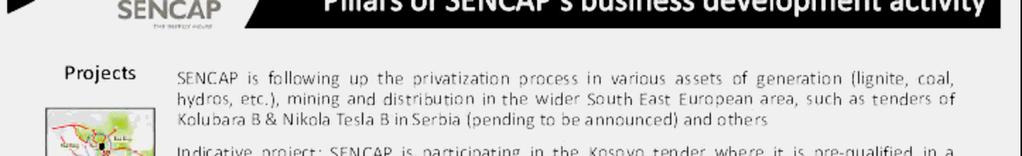
30 SENCAP: Business Development 29
31 Thank you for your attention 30