Barton Farm Winchester. Outline Planning Application A New Suburb for Winchester. Flood Risk Assessment prepared by Parsons Brinckerhoff
|
|
|
- Rosemary Todd
- 5 years ago
- Views:
Transcription
1 Barton Farm Winchester Outline Planning Application A New Suburb for Winchester Flood Risk Assessment prepared by Parsons Brinckerhoff November 2009
2 BARTON FARM WINCHESTER FLOOD RISK ASSESSMENT May 2009 Prepared by Parsons Brinckerhoff Ltd Queen Victoria House Redland Hill Redland Bristol BS6 6US Prepared for Cala Homes (South) Ltd. Burgan House The Causeway Staines Middlesex TW18 3PR

3
4 CONTENTS Page No SECTION 1 INTRODUCTION Project Background Site Location and Description Adjacent Sites Consultation with Relevant Bodies Potential Sources of Flooding 3 SECTION 2 FLOODING AND FLOOD RISK Definition of Flood Risk Flood Zones Environment Agency s Indicative Floodplain Map Environment Agency Flood Map Historical Flooding Risk of Fluvial Flooding Risk of Overland Surface Water Flooding From Adjacent Sites Risk of Site Generated Surface Water Runoff and Sewers Risk of Groundwater Flooding Flood Warning Impacts Due to Climate Change 11 SECTION 3 THE SEQUENTIAL TEST AND EXCEPTION TEST The Sequential Test The Exception Test 13 SECTION 4 CONCLUSIONS Conclusions 15 REFERENCES APPENDICES Appendix A - Not Used Appendix B - Environment Agency Flood Map Appendix C - Environment Agency Historic Flood Map Appendix D - Environment Agency Groundwater Model Results Appendix E - Borehole Location Map May 2009
5 SECTION 1 INTRODUCTION
6 SECTION 1 FLOODING AND FLOOD RISK BARTON FARM WINCHESTER FLOOD RISK ASSESSMENT 1 INTRODUCTION 1.1 Project Background Parsons Brinckerhoff Ltd (PB) has been commissioned by Cala Homes (South) Ltd to prepare a Flood Risk Assessment (FRA) in support of a planning application for Barton Farm Winchester, a proposed mixed-use development located north of Winchester, Hampshire Land within the applicant s control consists of approximately 125 hectares (ha), of which 87 ha is planned for a 2,000 dwelling development with a local centre. Planning Policy Statement 25 (PPS 25) - Development and Flood Risk (1) states that development proposals on sites comprising one ha or greater are required to submit an FRA to address the site s vulnerability to flooding. The FRA must also address the development s potential to increase flood risk elsewhere through the addition of hard surfaces, and its effect on surface water run-off. 1.2 Site Location and Description The proposed development is located to the north of Winchester, and is bound by the B3420 (Andover Road) on the west and the London Southampton railway line on the east. The River Itchen lies approximately 1.2km east of the railway The 125 ha area is split into two parcels by the Southampton to Basingstoke railway line, which is aligned in a north-south direction. Two-thirds of the land (87 ha) lies to the west of the railway line and is referred to as the site. The remaining one-third lies to the east of the railway line and is not included in this assessment. The site is currently vacant and is situated on undulating farmland at National Grid Reference (centre) SU The site is located on Upper Chalk and is traversed west to east by dry valleys. There is a watershed running west to east that divides the site into two areas, north and south. The watershed runs from the high point of approximately 79 metres above Ordnance Datum (m AOD) in the west (central) along Andover Road to the northeast corner of the site where it meets the railway line The northern area of the site generally falls towards Well House Lane to the north. A number of low points exist along the site boundary with Well House Lane, the most prominent of which is at the bottom of the dry valley that flows towards the existing farmhouse (Well House Farm) on the northern boundary. This low point has an approximate elevation of 50m AOD The southern area of the site falls into the prominent dry valley, which lies towards the southern end of the site and is referred to as the southern dry valley.. The elevation of the dry valley decreases from approximately 60m AOD in the southwest corner of the site to approximately 49m AOD, where it meets the railway line on the eastern site boundary. 1.3 Adjacent Sites The site is located within land currently owned by Cala Homes (South) Ltd. The roughly triangular-shaped site is bound by Well House Lane to the north, the B3420 Prepared by Parsons Brinckerhoff Ltd May 2009 Page 1 for Cala Homes (South) Ltd
7 SECTION 1 FLOODING AND FLOOD RISK BARTON FARM WINCHESTER FLOOD RISK ASSESSMENT (Andover Road) to the west, and by the London Southampton railway line to the east. The residential area off Park Road forms the southern boundary The Henry Beaufort School lies further west of the site within a residential area. A residential area also lies further south of the site. The Harestock Wastewater Treatment Works (WwTW) lies to the north of the site, in the dry valley adjacent to Well House Lane. 1.4 Consultation with Relevant Bodies The following consultations were undertaken by PB in relation to the FRA: EA - flooding information; Winchester City Council flooding information; and Southern Water - drainage Further consultation with the EA was undertaken in October 2008 when the following information was provided: The site may be affected by an extreme flood, which may have a 1% chance of flooding annually (1 in 100), whilst ignoring the presence and effect of any flood defences; Historic flooding information; Groundwater level data (2003 to present) for the Harestock Corner monitoring borehole; Flood Zone Map; Defence information; Flood warning information; Risk of flooding at the site is due to groundwater flooding; Southern dry valley is contained within Flood Zone 3; and There is no distinction between Flood Zone 3a and Flood Zone 3b areas on the EA Flood Zone Map; Reference was made to the Winchester City Council Strategic Flood Risk Assessment (2) (SFRA), prepared by Halcrow Group Ltd Reference was also made to the Hydrology and Drainage chapter (3) of the Environmental Statement report, which was prepared by Mason Richards Planning in January, Prepared by Parsons Brinckerhoff Ltd May 2009 Page 2 for Cala Homes (South) Ltd
8 SECTION 1 FLOODING AND FLOOD RISK BARTON FARM WINCHESTER FLOOD RISK ASSESSMENT 1.5 Potential Sources of Flooding Potential sources of flooding at the site, and considered in this assessment, are outlined below: Fluvial flooding from the River Itchen; Overland surface water flooding from adjacent sites; Site generated surface water runoff and sewers; and Groundwater flooding The impacts of the above may have on the site are discussed in the following sections. Prepared by Parsons Brinckerhoff Ltd May 2009 Page 3 for Cala Homes (South) Ltd
9 SECTION 2 FLOODING AND FLOOD RISK
10 SECTION 2 FLOODING AND FLOOD RISK BARTON FARM WINCHESTER FLOOD RISK ASSESSMENT 2 FLOODING AND FLOOD RISK 2.1 Definition of Flood Risk Flood frequency is identified in terms of the return period e.g. 1 in 100 year, 1 in 200 year, etc. In terms of probability, there is a 1 in 100 (1%) risk of one or more 100 year floods occurring in a given year. Similarly, there is a 1 in 200 (0.5%) risk of one or more 200 year floods occurring in a given year Table 2.1 below provides a conversion between return periods and annual flood probabilities. Table 2.1: Conversion Table Return Period (Years) Annual Flood Probability (%) Flood Zones PPS 25 identifies Flood Zones in relation to flood risk. The zones refer to the probability of river (fluvial) and sea (tidal) flooding, whilst ignoring the presence of defences. Table 2.2 below summarises the relationship between Flood Zone category and the identified flood risk. Table 2.2: Flood Zones Flood Risk Area Identification Annual Probability of River Flooding Annual Probability of Sea Flooding Zone 1 Low Probability <0.1% <0.1% Zone 2 Medium Probability 1% 0.1% 0.5% 0.1% Zone 3a High Probability >1% >0.5% Zone 3b Functional Floodplain >5% >5% 2.3 Environment Agency s Indicative Floodplain Map The EA produces indicative floodplain maps which highlight areas that are likely to flood from tidal inundation, fluvial flows, and sometimes includes other sources, such as groundwater flooding. The maps are updated on a quarterly basis using data gathered from hydraulic modelling and recent events to refine the flood extents. The indicative floodplain maps are published on the EA website. Prepared by Parsons Brinckerhoff Ltd May 2009 Page 5 for Cala Homes (South) Ltd
 could be affected by an extreme flood if there were no flood defences.")
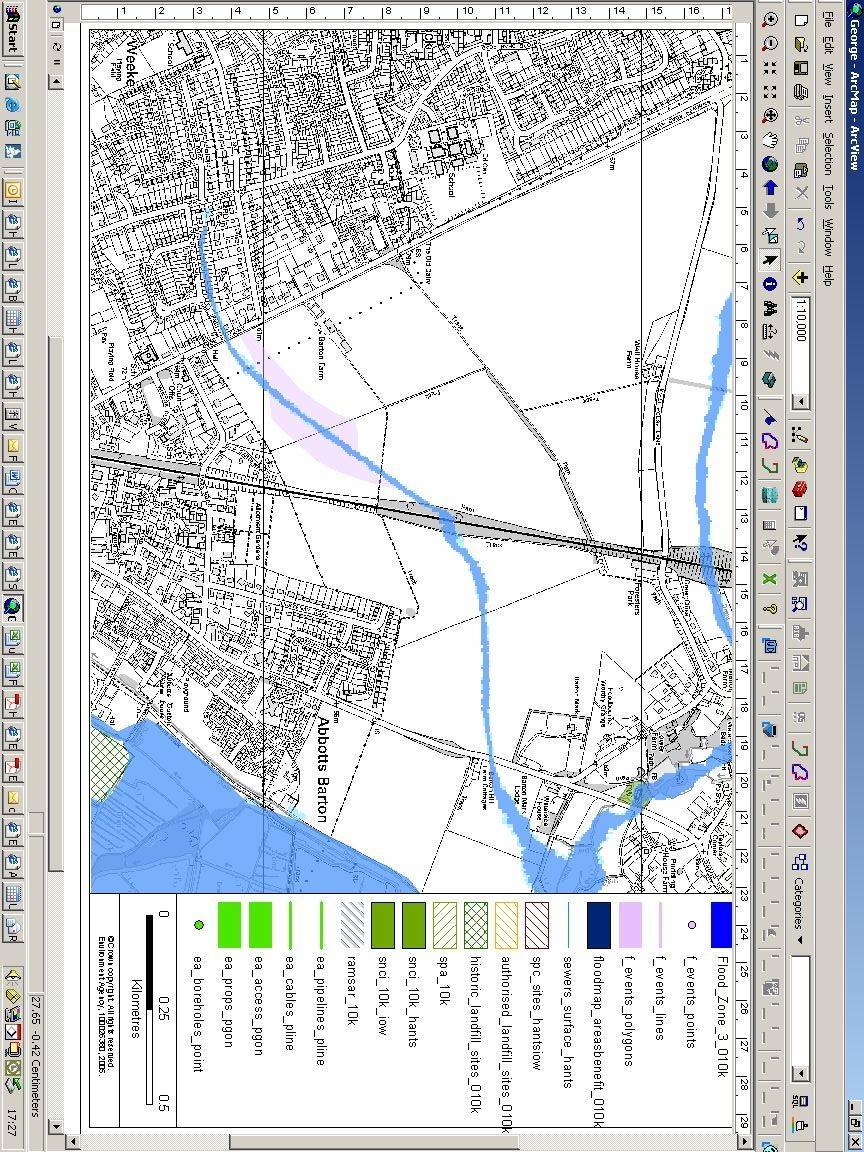
11 SECTION 2 FLOODING AND FLOOD RISK BARTON FARM WINCHESTER FLOOD RISK ASSESSMENT Figure 2.1 below shows the indicative floodplain map for the study area. Figure 2.1: EA Indicative Floodplain Map Extract from Environment Agency Flood Mapping Website (4) The indicative floodplain map illustrates that a portion of the site (dry valley) could be affected by an extreme flood if there were no flood defences. A majority of the site, however, lies outside the extent of extreme flooding. 2.4 Environment Agency Flood Map The EA has issued a current Flood Map for the site location, which provides a general estimate of the likelihood of flooding. The Flood Map indicates that the site lies within Flood Zone 1, aside from the southern dry valley, which is classified as Flood Zone 3. The periphery of the southern dry valley is classified as Flood Zone 2. The current EA Flood Map is located in Appendix B In general, the EA Flood Maps only show extents of tidal and fluvial flooding. The Winchester City Council SFRA, however, indicates that the Flood Maps may also include other sources. In Hampshire County, for instance, much of the flooding is derived from groundwater sources in both dry valleys and isolated ponds. Groundwater flooding outlines are developed from both observations and generalised Prepared by Parsons Brinckerhoff Ltd May 2009 Page 6 for Cala Homes (South) Ltd
12 SECTION 2 FLOODING AND FLOOD RISK BARTON FARM WINCHESTER FLOOD RISK ASSESSMENT computer modelling. Historical flooding records and topographical data suggest that the site (specifically the southern dry valley) is likely to be affected by groundwater sources and overland flow. 2.5 Historical Flooding The EA has indicated that a portion of the southern dry valley was affected by ephemeral flows during the wet winter of It is likely that this event occurred as a result of exceptionally high cumulative rainfall between October and November (2000), which caused the highways drains on the adjacent Andover Road to overflow onto the site. This overland flow was held by the hedgerow that runs north to south through the southern area of the site. This obstruction, and the already saturated ground, caused ponding to occur at the hedgerow and not at the base of the southern dry valley The EA has provided a Historic Flood Map, which indicates areas historically affected by flooding within the vicinity of the site. The Historic Flood Map is contained in Appendix C According to Southern Water, as listed in Table 2 of the Winchester City Council SFRA, one sewerage flooding event was recorded in the vicinity of the site. Records indicate that a hydraulic issue caused internal and curtilage flooding within the foul/combined sewer system in August, The event occurred along Lynford Avenue, approximately 180 metres (m) west of the site s southwestern corner boundary. 2.6 Risk of Fluvial Flooding The Itchen River is located approximately 1.2km east of the London Southampton railway line. Published topographical information (5) indicates that the River Itchen lies at approximately 35m AOD, which is 14m below the lowest site elevation. The EA Flood Map also indicates that a majority of the site lies in Flood Zone 1, which represents areas with the lowest probability of flooding from rivers (if applicable) where the chance of flooding in any one year is less than 0.1%. The risk of fluvial flooding at the site is, therefore, considered negligible. 2.7 Risk of Overland Surface Water Flooding From Adjacent Sites The northern site boundary is bordered immediately by hard, impermeable surfacing (Well House Lane), which provides a small barrier to overland flow. Published topographical information indicates that the area to the north of the site is lower than the northern boundary. Therefore, no overland flow would enter the site from the north Published topographical information indicates that the residential area west of the site (Harestock) generally lies above the site s highest point near the Old Dairy (79m AOD). It was assumed that the existing drainage network contained within the road system is adequate to drain surface water generated within this area However, during a walkover site survey (performed September 2008) a road drainage outfall pipe was discovered in the southwest corner of the site. The pipe appears to discharge surface water from Andover Road into the western end of the southern dry valley. The outfall pipe is located at the lowest (local) point in Andover Road, Prepared by Parsons Brinckerhoff Ltd May 2009 Page 7 for Cala Homes (South) Ltd
13 SECTION 2 FLOODING AND FLOOD RISK BARTON FARM WINCHESTER FLOOD RISK ASSESSMENT therefore, it is assumed that it drains a large area of impermeable surfacing. To reduce the risk of overland surface water flooding from adjacent sites, buildings should not be developed within the southern dry valley, which is classified as Flood Zone Published topographical information indicates that the small residential area to the south generally rises in elevation. It is assumed that the existing drainage network contained within the road system is adequate to drain surface water generated within this area The eastern site boundary lies adjacent to the London Southampton railway embankment, which rises several metres above the site s eastern boundary elevation. The embankment provides a barrier to overland surface water flow generated east of the railway line (specifically near the southeastern site boundary), which currently lies vacant. The topographical survey indicates that the area east of the railway generally drains to the centre to a dry valley, which appears to be a continuation of the southern dry valley contained within the site boundary. This dry valley ranges in elevation from approximately 48m AOD in the west (adjacent to the railway) to approximately 44m AOD in the east (adjacent to Worthy Road/London Road). Therefore, the likely direction of overland flow is in an easterly direction away from the site The EA confirms that no defences exist in vicinity of the site, other than natural channels of the Nuns Walk stream north of the site boundary. 2.8 Risk of Site Generated Surface Water Runoff and Sewers The site is currently vacant and is situated on undulating farmland. The site is located on Upper Chalk and is traversed west to east by dry valleys. Hedge rows exist along an east-west ridge line that splits the site into two parcels. Each parcel contains a dry valley, which essentially acts as a drainage path. The southern dry valley decreases west to east from 60m AOD to approximately 49m AOD and terminates at the railway embankment. Therefore, site generated surface water in the southern parcel is likely to flow in an easterly direction. There is an undulation in the northern area that decreases from the southwest to the northeast from 79m AOD to approximately 50m AOD, where a low point exists on the north-central boundary line adjacent to Well House Farm. Therefore, site generated surface water in the northern parcel is likely to flow in a north easterly direction The site is planned for a 2,000 dwelling development with a local centre, as well as public open space. However, the final layout is not finalised at this time. The planned development will increase the area of hard, impermeable surfacing, resulting in an increase in the proportion and rate of rainfall-runoff Southern Water indicates that there are no existing surface water drainage arrangements at the site. It currently drains by percolation through the soil to the groundwater system in the Chalk. The Hydrology and Drainage chapter (3) indicates that solid chalk is located within 1m of the ground surface Southern Water indicates that site generated surface water will not be accepted into the public sewerage system and must continue to drain by percolation when the site is developed. Therefore, the detailed design phase should consider various techniques to adequately attenuate site generated surface water for, minimally, the 1 in 100 year storm plus 30% (effects of climate change). The EA indicates that surface water run-off should be controlled as near to its source as possible through use of sustainable drainage systems (SUDS). SUDS seek to mimic natural drainage Prepared by Parsons Brinckerhoff Ltd May 2009 Page 8 for Cala Homes (South) Ltd
14 SECTION 2 FLOODING AND FLOOD RISK BARTON FARM WINCHESTER FLOOD RISK ASSESSMENT systems and patterns, and can be incorporated at the local level (e.g. household water butts) to the community level (e.g. drainage swales along roadways). Additional SUDS drainage techniques may include soakaways, swale ditches,, and permeable paving. Surface water can also be attenuated by on-site water features before percolating into the groundwater system. Initial site plans indicate that provision has been made for on-site water features (e.g. ponds). In general, SUDS drainage techniques will be considered during the detailed design phase with a view to minimise on-site storage volume, control surface water runoff, as well as provide natural water treatment In addition to SUDS, surface water can be attenuated by piped drainage systems, with outfalls terminating at on-site water features. As part of the detailed drainage design, the effects of surface water runoff and surcharges within the sewer system will be considered so as not to place existing or new development at risk from drainage flooding The new surface water drainage system will be designed and sized in accordance with current best practice to ensure that no flooding out of manholes results from the 1 in 30 year storm plus 20% (effects of climate change). In addition, the new drainage system will be simulated to determine which parts of the drainage system are likely to flood during the 1 in 100 year plus 30% storm event, and finished levels will be arranged so as not to place buildings at risk of flooding Historical flooding records indicate that a portion of the southern dry valley was affected by ephemeral flows caused by overland flow during the wet winter of , where flowing and ponded water was observed at the hedgerow in the centre of the dry valley. No culverts exist under the railway embankment, which was constructed over 100 years ago. This suggests that ephemeral flows are rare and are caused by overland flow from the highway If site-generated foul drainage is to connect to the public sewer system, the detailed design phase must consider advice obtained from Southern Water on whether their existing sewerage network has sufficient capacity to accommodate flows generated by the proposed development. It is anticipated that the existing sewerage network will not have sufficient capacity to accept flows from the site and a new system will be required for the development flows. However, this will be verified before detailed design The proposed development can be connected almost directly to the Harestock WwTW due to its proximity to the site. Contact must be made with Southern Water during the detailed design phase to determine whether their existing facility has sufficient capacity to accommodate flows generated by the proposed development. 2.9 Risk of Groundwater Flooding A review of the Groundwater Vulnerability Map (6) indicates that the site is underlain by a designated Major Aquifer with high permeability. These features comprise of highly permeable formations usually with a known or probable presence of significant fracturing. A Major Aquifer may be highly productive and able to support large abstractions for public supply and other purposes. The site comprises of soils with High Leaching Potential (H1), which have the capacity to readily transmit liquid discharges. This generally occurs because the soil is either shallow, or susceptible to rapid by-pass flow directly to rock, gravel, or groundwater. The Groundwater Vulnerability Map confirms that the Major Aquifer at the site comprises of chalk. Prepared by Parsons Brinckerhoff Ltd May 2009 Page 9 for Cala Homes (South) Ltd
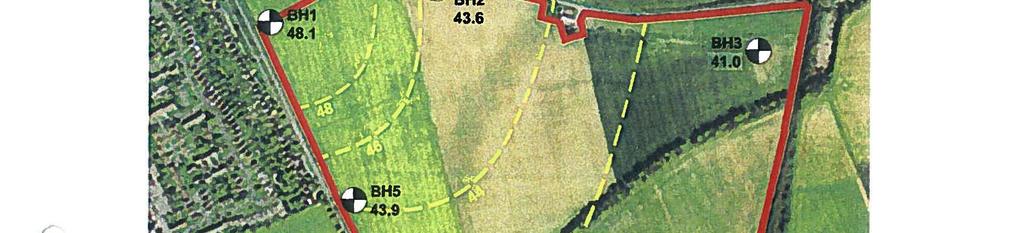
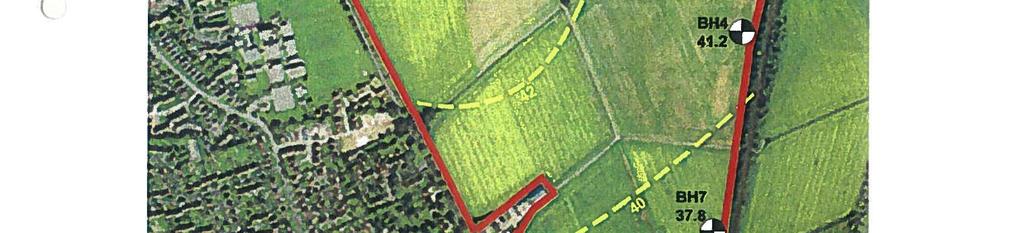
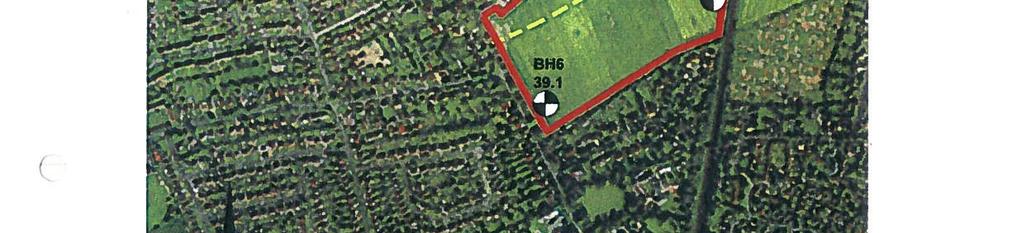
15 SECTION 2 FLOODING AND FLOOD RISK BARTON FARM WINCHESTER FLOOD RISK ASSESSMENT The Hydrology and Drainage chapter (3) indicates that solid chalk is located within 1m of the ground surface. Rainfall percolates through the soil into the chalk. Groundwater generally remains several metres below the ground surface, however, it is possible that ephemeral flows may occur due to saturated ground conditions. This was demonstrated during the wet winter of , where flowing and ponded water was observed for several weeks in the region of the southern dry valley The southern dry valley originates some distance to the west of Andover Road in an urbanised area consisting of low density developments. It extends across the southern portion of the site and terminates at the railway embankment. The dry valley then reappears east of the railway, where it continues at approximately the same slope. There are no culverts present under the 100 year-old railway embankment to link the dry valleys, which suggests that ephemeral flows are rare. During the wet winter of , ponded water did not extend as far as the railway embankment and was not evident east of the railway The Winchester City Council SFRA states that groundwater flooding is a particular characteristic of the Winchester District, given the high proportion of chalk and relatively high water tables. It also states that during periods of intense or prolonged rainfall, valleys that are normally dry areas can become functional waterways The EA produced a model to demonstrate the likely depth to groundwater levels in the spring of Results of the model indicate that the depth to groundwater is approximately 5m at the eastern edge of the southern dry valley, adjacent to the railway line. A map showing the results of the model are shown in Appendix D The Hydrology and Drainage chapter (3) indicates that seven boreholes were drilled to monitor groundwater movement and depth at the site. A map showing the borehole locations and groundwater contours is contained in Appendix E. The boreholes were monitored on two dates in April The report indicates that no rain fell approximately one month prior to the study and the previous winter was not particularly wet. The reproduced results are summarised in Table 2.3 below. Table 2.3: Borehole Results of Groundwater Levels at Winchester City North Site Approx. Water Depth Water Depth Approx. Borehole Ground Level 16/04/03 24/04/03 Water Level Reference (m AOD) (m below ground) (m below ground) (m AOD) Results of the April 2003 monitoring study demonstrate that the probable direction of groundwater flow is in a south-easterly direction (Appendix E). The study also shows that the water table was, at minimum, approximately 9m below the lowest ground elevation at the time of the study. Prepared by Parsons Brinckerhoff Ltd May 2009 Page 10 for Cala Homes (South) Ltd
16 SECTION 2 FLOODING AND FLOOD RISK BARTON FARM WINCHESTER FLOOD RISK ASSESSMENT 2.10 Flood Warning The EA operates a flood warning service covering every region of England and Wales, which is updated every 15 minutes. Full details are found on their website. Flood warnings can also be obtained from the EA s Floodline at number The EA indicates that the site does not fall within a flood warning area Impacts Due to Climate Change The impacts of climate change can pose a challenge and risk to operating authorities (e.g. Internal Drainage Boards, Local Authorities, Environment Agency) and government. Impacts may include rainfall event changes that affect urban surface water system flooding and flooding in fluvial catchments. Projections of future climate change indicate that more frequent short-duration, high-intensity rainfall, as well as more frequent periods of long-duration rainfall could be expected. In the past 200 years, the winter seasons have become wetter relative to summers General guidance on climate change is available through publications such as The Flood and Coastal Defence Project Appraisal Guidance, FCDPAG3 Economic Appraisal, Supplementary Note to Operating Authorities - Climate Change Impacts (7), which was published by the Department for Environment, Food, and Rural Affairs (Defra). This publication states the effects of climate change on flooding from the land, rivers, and the sea, which includes indicative sensitivity ranges of peak rainfall intensity and peak river flow allowances An excerpt of the Indicative Sensitivity Ranges table is included in Table 2.4. Table 2.4: Excerpts from Flood and Coastal Defence Appraisal Guidance: Indicative Sensitivity Ranges Parameter Peak rainfall intensity (preferably for small catchments) Peak river flow (preferably for larger catchments) 5% 10% 20% 30% 10% 20% These allowances suggest that peak rainfall intensity may elevate by as much as 30% in the coming years, which may increase both the frequency and severity of groundwater and surface water flooding at the site The detailed drainage design will take into account the effects of climate change. Prepared by Parsons Brinckerhoff Ltd May 2009 Page 11 for Cala Homes (South) Ltd
17 SECTION 3 THE SEQUENTIAL TEST AND EXCEPTION TEST
18 SECTION 3 THE SEQUENTIAL TEST AND EXCEPTION TEST WINCHESTER CITY NORTH FLOOD RISK ASSESSMENT 3 THE SEQUENTIAL TEST AND EXCEPTION TEST 3.1 The Sequential Test PPS 25 indicates that the Sequential Test is a key component of the hierarchical approach to avoiding and managing flood risk. Its purpose is to steer new development towards areas with the lowest probability of flooding. Ideally, this would be areas classified as Flood Zone The site is currently planned for a 2,000 dwelling development with a local centre. According to Table D.2: Flood Risk Vulnerability Classification in PPS 25, dwelling homes are classified as More Vulnerable development. Table D.3: Flood Risk Vulnerability and Flood Zone Compatibility demonstrates that More Vulnerable development is appropriate within Flood Zone 1 and Flood Zone 2 areas. Table D.3 also indicates that an Exception Test is required for More Vulnerable development proposed within Flood Zone 3a areas. More Vulnerable development should not be permitted in Flood Zone 3b areas Local centres are generally classified as Less Vulnerable development, which may include, but are not limited to, buildings used for shops, financial, professional and other services, restaurants and cafes, hot food takeaways, offices, and general industry. Table D.3 in PPS 25 demonstrates that Less Vulnerable developments are appropriate within Flood Zone 1, Flood Zone 2, and Flood Zone 3a, but should not be permitted within Flood Zone 3b areas The EA indicates that a majority of the site is classified as lying within Flood Zone 1. The southern dry valley is contained within Flood Zone 3, and its periphery is classified as lying within Flood Zone 2 due to its risk of groundwater flooding. Paragraph D6 of PPS 25 states that new development should be directed to areas with the lowest probability of flooding. Therefore, the placement of dwelling homes, commercial and employment developments should be directed to Flood Zone 1 areas. 3.2 The Exception Test Table D.3 in PPS 25 indicates that More Vulnerable development proposed within a Flood Zone 3a area must be subject to an Exception Test. To pass an Exception Test, it must be demonstrated that: The development provides wider sustainability benefits to the community that outweigh the flood risk; The development should be preferably on developable, previously-developed land; and A Flood Risk Assessment demonstrates that the development will be safe, without increasing flood risk elsewhere No development should be permitted within Flood Zone 2 and Flood Zone 3, therefore, the Exception Test is not required. Prepared by Parsons Brinckerhoff Ltd May 2009 Page 13 for Cala Homes (South) Ltd
19 SECTION 4 CONCLUSIONS
20 SECTION 4 CONCLUSIONS WINCHESTER CITY NORTH FLOOD RISK ASSESSMENT 4 CONCLUSIONS 4.1 Conclusions The proposed Winchester City North development is planned for 2,000 dwelling homes with a local centre. According to the EA, the site lies within Flood Zone 1 aside from the southern dry valley, which is classified as Flood Zones 2 and 3. The proposed developments are appropriate within Flood Zone 1. Less Vulnerable developments (commercial, employment areas) are appropriate in Flood Zone 2, however, these developments should not be permitted within Flood Zone 3 areas (southern dry valley) The ground investigation undertaken in 2003 has shown that the depth to groundwater is approximately 9m, at minimum, along the southern dry valley. The Winchester City Council SFRA states that groundwater flooding is a particular characteristic of the Winchester District, given the high proportion of chalk and relatively high water tables. It also states that during periods of intense or prolonged rainfall, valleys that are normally dry areas can become functional waterways. Although previous flooding at the site is the result of overland flows, buildings should not be developed within the base of the southern dry valley to ensure the risk of groundwater flooding is eliminated Southern Water indicates that site generated surface water will not be accepted into the public sewerage system and must continue to drain by percolation when the site is developed. Therefore, the detailed design phase should consider various techniques to adequately attenuate site generated surface water for, minimally, the 1 in 100 year storm plus 30% (effects of climate change). The EA indicates that surface water run-off should be controlled as near to its source as possible through use of SUDS If site-generated foul drainage is to connect to the public sewer system, the detailed design phase must consider advice obtained from Southern Water on whether their existing sewerage network has sufficient capacity to accommodate flows generated by the proposed development. It is anticipated that the existing sewerage network will not have sufficient capacity to accept flows from the site and a new system will be required for the development flows. However, this will be verified before detailed design The proposed development can be connected almost directly to the Harestock WwTW due to its proximity to the site. Contact must be made with Southern Water during the detailed design phase to determine whether their existing facility has sufficient capacity to accommodate flows generated by the proposed development. Prepared by Parsons Brinckerhoff Ltd May 2009 Page 15 for Cala Homes (South) Ltd
21 REFERENCES (1) The Stationary Office, Planning Policy Statement 25: Development and Flood Risk, December (2) Winchester City Council, Strategic Flood Risk Assessment for Local Development Framework Final Report, September (3) Mason Richards Planning, Hydrology and Drainage Environmental Statement, January (4) Environment Agency Flood Mapping, (5) Ordnance Survey 1:50,000 series, Landranger 185, Winchester & Basingstoke, (6) National Rivers Authority Policy and Practice for the Protection of Groundwater, Groundwater Vulnerability Map Sheet 44 North West Hampshire, (7) Department for Environment, Food, and Rural Affairs (Defra), Flood and Coastal Defence Appraisal Guidance, FCDPAG3, Economic Appraisal Supplementary Note to Operating Authorities - Climate Change Impacts, October 2006.
22 APPENDIX A NOT USED
23 APPENDIX B ENVIRONMENT AGENCY FLOOD MAP
24 Winchester City North Development Legend Flood Zone 3 Flood Zone Kilometres Crown copyright. All rights reserved. Environment Agency, , 2008.
25 APPENDIX C ENVIRONMENT AGENCY HISTORIC FLOOD MAP
26
27 APPENDIX D ENVIRONMENT AGENCY GROUNDWATER MODEL RESULTS


28
29 APPENDIX E BOREHOLE LOCATION MAP


30

31