MAP-21 NPRM for Part 490, National Performance Management Measures. Overview and Comments
|
|
|
- Justin Carpenter
- 5 years ago
- Views:
Transcription

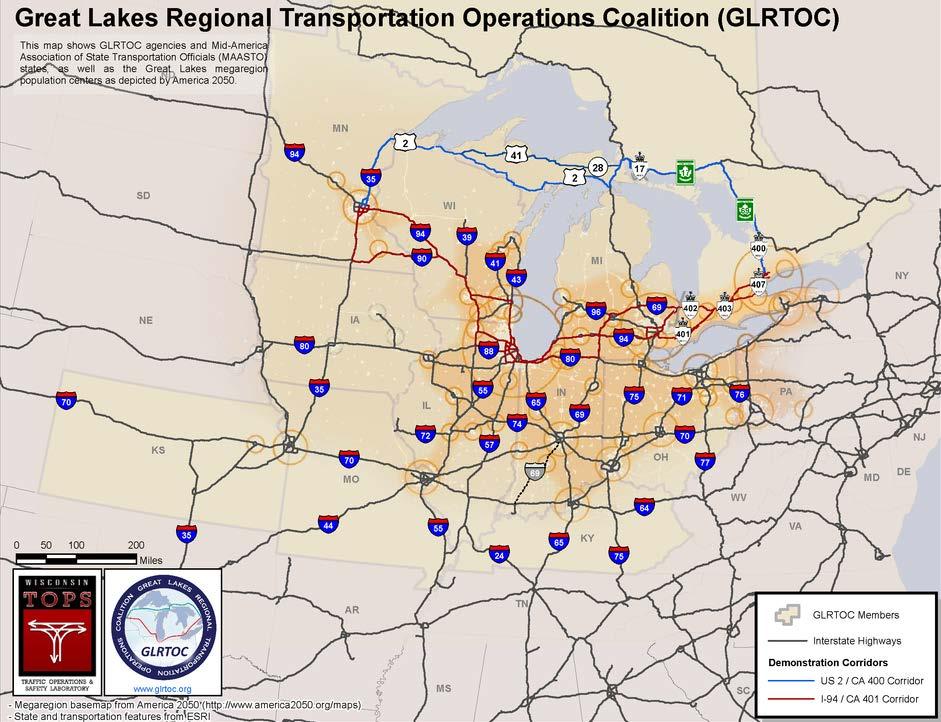
1 MAP-21 NPRM for Part 490, National Performance Management Measures Overview and Comments Great Lakes Regional June 2016


2 MAP-21 System Performance NPRM Published April 22, 2016 Comments, Opinions, Suggestions, Etc. Refer to Draft Report from the TOPS Lab Official Comments due August 20, 2016 Resources Available Start here:
3


4 Best practices sharing across all measures MAP-21 requirements Online maps and reports Freight mobility measures Collaboration with MAFC New performance anomaly scanner

5
6 MAP-21 System Performance NPRM Third and Last of MAP-21 Performance Rules Subparts: A: general, targets, reporting, progress E: performance of NHS F: freight movement on interstates G: CMAQ congestion H: CMAQ emissions o Subpart H is not like E, F, or G
7 The NPRM Measures New annual, travel time based, performance measures Metric vs Measure vs Target Metric Measure Interstate Other NHS* Travel Time Reliability % of Mileage Reliable (80 th %ile) Statewide Statewide Peak Hour Travel Time Ratio % of Mileage Meeting Expectations Metro** Metro** Truck Travel Time Reliability % of Mileage Reliable (95 th %ile) Statewide n/a Average Truck Speed % of Mileage Uncongested (50 mph) Statewide n/a Total Excessive Delay Hours of Delay per Capita All NHS in Metros** in Nonattainment or Maintenance, e.g., St. Louis * Other NHS reporting to be phased in ** Only applies to Urbanized Areas with population greater than one million, e.g., Kansas City, St. Louis
8 Ten Metro Areas in our Megaregion Maybe not all are in nonattainment or maintenance for the O3, CO, or PM (PM10 and PM2.5) NAAQS
9 General NPRM Observations Proposes use of the National Performance Management Research Data Set (NPMRDS) Barriers to use and researchy quirks Alternative data must be approved and comparable Possible that a central entity will be calculating measures for all agencies Thresholds are probably too high
 Subpart F Truck Reliability Subpart F Truck")

10 General NPRM Observations Three measures can be calculated right away Subpart E Reliability (LOTTR) Subpart F Truck Reliability Subpart F Truck Speed Others require consensus or additional data Subpart E PHTTR desired baseline, metro boundaries Subpart G Total Excessive Delay volumes, functional classes
11 NPRM Questions and Comments 1. Defining Significant Progress When performance level is better than target or better than baseline
12 NPRM Questions and Comments 2. Reporting Periods What happens to off-year results?


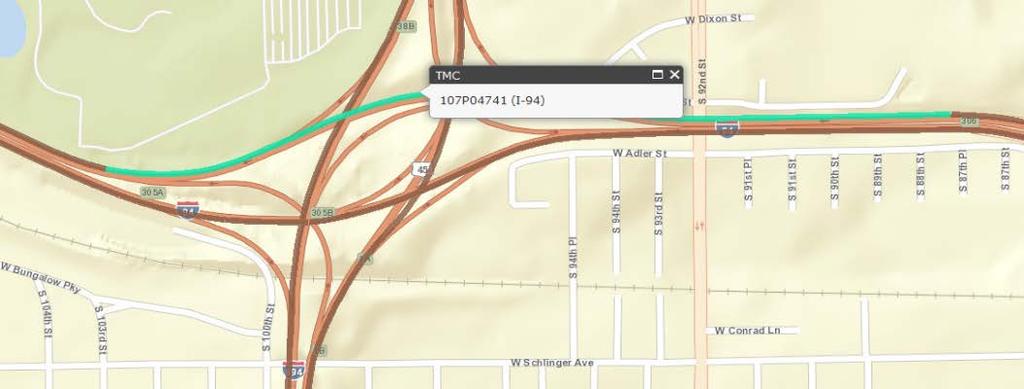
13 NPRM Questions and Comments 3. Identifying Interstate TMCs NPMRDS NHS How to filter? Ramps? New Interstates? What to do with

14 NPRM Questions and Comments 4. Metros less than One Million Any role?
15 NPRM Questions and Comments 5. Aggregating TMCs No reason to. Don t allow it.
16 NPRM Questions and Comments 6. NHS Routes Not Under State Control Still have to report on them Work with responsible agencies
17 NPRM Questions and Comments 7. NHS Coverage in NPMRDS Fluctuates Base results only on TMCs existing in all static versions within the reporting period
18 NPRM Questions and Comments 8. TMC Distances Fluctuate Work in distance-neutral rate units, e.g., minutes/mile Need to join with distances anyway for certain measures
19 NPRM Questions and Comments 9. Recurring 1 KPH Outliers Filter out for all measures Two measures take care of it PHTTR 2 MPH Total Delay 300 second ceiling
20 NPRM Questions and Comments 10. Total Excessive Delay is Complex Need to conflate travel times with volume data Need to identify functional classes and tie to TMCs
21 NPRM Questions and Comments 11. In-fill with has Better Alternatives More work, data wrangling, joining, signals, changes, valid?, more rows, negligible effect, etc.
22 NPRM Questions and Comments What other questions?


23 NPRM Subpart Calculations Travel Time Parameters Great Lakes Regional NPRM proposes average, 50 th, 80 th, and 95 th percentiles

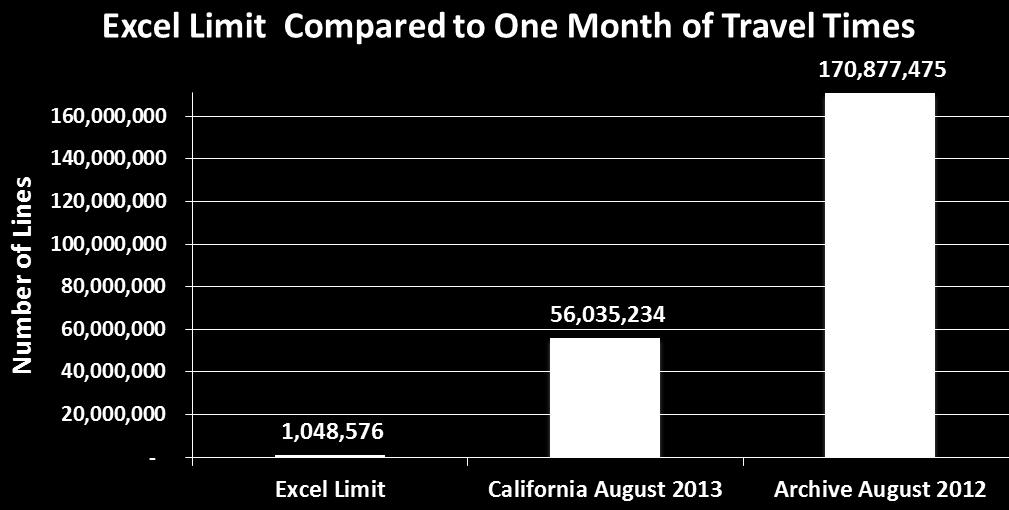
24 NPRM Subpart Calculations NPMRDS Great Lakes Regional 300k+ links 105k epochs/year
25 NPRM Subpart Calculations Subpart E Reliability Great Lakes Regional Coverage: Statewide - Interstates and Other NHS Inputs: Travel time (all vehicles) Segment length Posted speed limit Metric: level of travel time reliability (LOTTR), the max ratio of 80 th to 50 th percentile travel time Hours: four time blocks per week Holidays: include Outliers: do nothing Missing: fill in with TT@PSL Measure: percent of mileage LOTTR < 1.5

26 NPRM Subpart Calculations Subpart E Reliability Great Lakes Regional
27 NPRM Subpart Calculations Subpart E Peak Hour Travel Time Great Lakes Regional Coverage: Metro - Interstates and Other NHS Inputs: Travel time (all vehicles) Segment length Urbanized area boundary Desired peak hour travel time Metric: peak hour travel time ratio (PHTTR) the ratio of average to desired travel time for peak hour Hours: one hour in 6-9am and 4-7pm weekdays Holidays: exclude Outliers: remove outside mph (important) Missing: no infill Measure: percent of mileage PHTTR < 1.5

28 NPRM Subpart Calculations Subpart E Peak Hour Travel Time Great Lakes Regional
29 NPRM Subpart Calculations Subpart F Truck Reliability Great Lakes Regional Coverage: Statewide - Interstates Inputs: Travel time (freight and all vehicles) Segment length Posted speed limit Metric: ratio of 95 th to 50 th percentile travel time Hours: all times Holidays: include Outliers: do nothing Missing: fill in with slower of all vehicles or TT@PSL Measure: percent of mileage with ratio < 1.5
30 NPRM Subpart Calculations Subpart F Truck Reliability Great Lakes Regional
31 NPRM Subpart Calculations Subpart F Truck Speed Coverage: Statewide - Interstates Inputs: Travel time (freight and all vehicles) Segment length Posted speed limit Metric: average truck speed Hours: all times Holidays: include Outliers: do nothing (issue with averages) Great Lakes Regional Missing: fill in with slower of all vehicles or TT@PSL Measure: percent of mileage with ratio < 1.5
32 NPRM Subpart Calculations Subpart F Truck Speed Great Lakes Regional
 Segment length Urbanized area boundary and population Functional")
")
33 NPRM Subpart Calculations Subpart G Total Excessive Delay Great Lakes Regional Coverage: Metro all NHS Inputs: Travel time (all vehicles) Segment length Urbanized area boundary and population Functional classification Traffic volumes Metric: excessive delay (slower than 35 mph or 15 mph) Hours: all times Holidays: include Outliers: five-minute delay ceiling Missing: no infill Measure: vehicle delay (hours) per capita

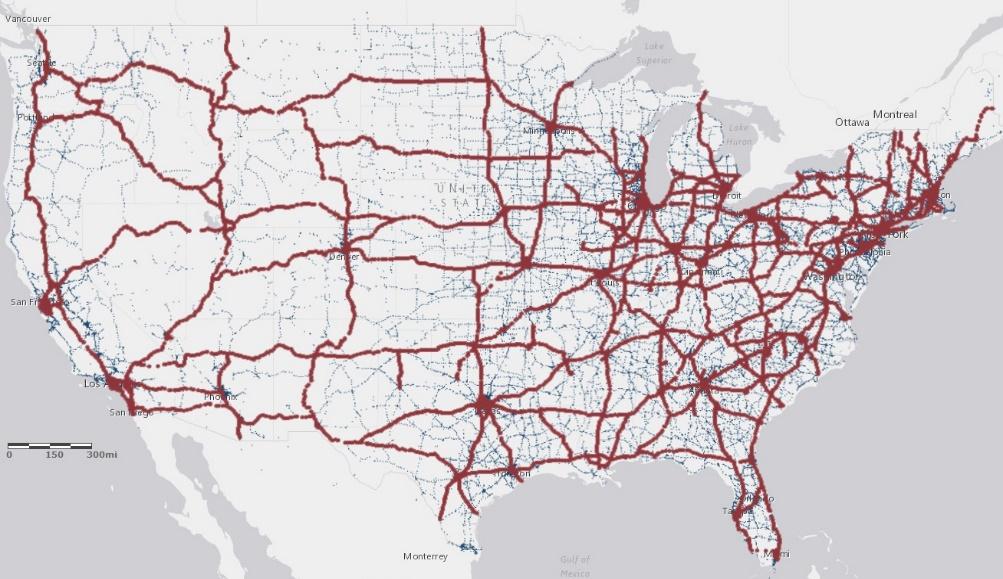
34 Interactive Map Explorer
35 Next Steps Take a look at Send questions, requests, or arguments to nprm@glrtoc.org Review the official material at Submit your ideas to the official docket by August 20