City of Buenaventura Toxicity and Chemical Evaluation October 2003 Dry Weather Sampling Event Santa Clara River Estuary
|
|
|
- Augustine James Dean
- 5 years ago
- Views:
Transcription
1 City of Buenaventura Toxicity and Chemical Evaluation October 2003 Dry Weather Sampling Event Santa Clara River Estuary Prepared by AMEC Earth & Environmental Bioassay Laboratory 5550 Morehouse Drive, Suite B San Diego, California (858)
2 City of San Buenaventura Dry Weather Toxicity and Chemistry Report Santa Clara River Estuary Project, October 2003 INTRODUCTION Toxicity tests and chemical analyses were conducted on estuary sediments collected from the Santa Clara River Estuary in the City of Buenaventura, CA on 17 October This initial sampling effort for the project was characterized as a dry weather event as there was little to no rainfall prior to the sample collection date, the beach berm was intact, and the estuary was inundated with water. Dr. Howard Bailey, Mr. Chris Stransky, and Mr. John Rudolph of AMEC Earth & Environmental (AMEC) coordinated the sediment collection effort, toxicity testing, and chemical testing programs. Sediment toxicity testing was performed using the amphipod Eohaustorius estuarius and the bivalve Mytilus galloprovincialis (formerly Mytilus edulis). Bioassay testing was conducted between 22 October and 14 November 2003 at the AMEC Bioassay Laboratory in San Diego, CA. Chemical analyses were performed by Calscience Environmental Laboratories (CEL) located in Garden Grove, CA. METHODS AND MATERIALS SAMPLE COLLECTION AND TRANSPORT Sediment samples were collected from eleven locations identified as Sites A-1, A-2, A-3, B-1, B-2, B-3, B-4, C-1, C-2, C-3, and D-1. Sample collection time, water depth, sediment grab penetration depth, GPS coordinates, tidal information, and detailed physical descriptions of each sample were recorded in a field logbook (Appendix G). All equipment used for sediment collection was cleaned thoroughly with Alconox soap and rinsed with site water. Collections were performed using a 10 cm 2 stainless steel Van Veen grab. Several grab samples were collected at each field location to in order to obtain sufficient sediment for testing. Sample materials were placed in polypropylene bags, labeled, and tightly sealed. All samples were packed in ice chests containing wet ice and transported to AMEC. Upon arrival at AMEC, coolers were opened and their contents verified. Sediment grabs from each site were then placed in a clean stainless steel bucket, homogenized, and sub-sampled for chemical, grain size, and toxicity analyses. Subsamples for chemical analysis were placed in labeled, certified-clean glass jars. Toxicity testing sample materials were placed in polypropylene bags, labeled, and tightly sealed. Subsamples 1
3 City of San Buenaventura Dry Weather Toxicity and Chemistry Report Santa Clara River Estuary Project, October 2003 for grain size analysis were placed in labeled zip-lock bags. Samples for toxicity and chemical analyses were then placed in a 4 C cold room until toxicity test initiation or transport to CEL the following day. Samples for grain size analysis were stored at room temperature. ORGANISM PROCUREMENT AND HANDLING AMPHIPOD Eohaustorius estuarius were obtained from Mr. Gary Buhler of Northwest Aquatic Laboratories in Newport, OR. The organisms were transported to AMEC in coolers containing sieved site sediment and oxygenated seawater. Upon arrival at AMEC, water quality parameters of temperature, dissolved oxygen (DO), and salinity were measured and recorded in a logbook. Amphipod condition was also noted. The amphipods were then acclimated to test temperature and salinity prior to test initiation. During the acclimation period, the animals were observed for any indications of stress (e.g. abnormal swimming or burrowing behavior) or significant mortality of greater than ten percent. BIVALVES Carlsbad Aquafarms in Carlsbad, CA supplied the bay mussel Mytilus galloprovincialis. The mussels were transported to AMEC in ice chests via same-day courier service. In the laboratory, the date of organism receipt and arrival condition were recorded in a logbook. The mussels were then acclimated to test temperature and salinity prior to test initiation. BIOASSAY PROTOCOL AMPHIPOD BIOASSAY Marine amphipod bioassays using Eohaustorius estuarius were conducted in accordance with Standard Guide for Conducting 10-day Static Toxicity Tests with Marine and Estuarine Amphipods, ASTM Designation: E (1993). Animals were exposed to test sediments for ten days to determine the effects of site sediment on amphipod survival. Prior to testing, sediments were sieved through a 500-µm Nitex screen to remove native organisms and shell debris. Test chambers consisted of 1-L glass jars with a 2-cm layer of sieved sediment and 900 ml of overlying 20 µm lab-filtered seawater 2
4 City of San Buenaventura Dry Weather Toxicity and Chemistry Report Santa Clara River Estuary Project, October 2003 at a salinity of 30 ppt. The tests were performed at a temperature of 15 ± 1 C under continuous light. Aeration was provided continuously to each test chamber through a glass pipette at a rate of approximately two bubbles per second. The experimental design consisted of five laboratory replicate test chambers per site. In addition, a sixth replicate was initiated for each site as a surrogate to perform daily water quality measurements. Twenty amphipods were carefully placed in each test chamber at test initiation. Two negative controls consisting of 1) a water-only exposure with no sediment added, and 2) sediment from the amphipod collection location were tested concurrently. Temperature, DO, ph, and salinity were monitored daily in the surrogate test chamber for each sediment sample. Subsamples of overlying water were collected from surrogate test chambers for initial and final total ammonia analysis. Additionally, subsamples of sediment porewater were collected prior to test initiation and analyzed for total ammonia. Porewater was collected by centrifuging the whole sediment at 3500 rpm for a period of fifteen minutes. A concurrent reference toxicant test (positive control) using cadmium (II) chloride (CdCl 2 ) was conducted in conjunction with the sediment test. Reference toxicant testing is a QA/QC procedure used to evaluate the quality and sensitivity of the test organisms. BIVALVE EMBRYO DEVELOPMENT BIOASSAYS Bivalve embryo development assays were conducted in accordance with the document Recommended Guidelines for Conducting Laboratory Bioassays on Puget Sound Sediments, Puget Sound Estuary Program (PSEP), July (1995) and Standard Guide for Conducting Static Acute Toxicity Tests Starting with Embryos of Four Species of Saltwater Bivalve Molluscs, ASTM Designation: E (1993). Embryos of the bivalve M. galloprovincialis were exposed to whole test sediments for 48 hours to determine the effect of site sediment exposure on survival and development. Tests were conducted in 1-L glass jars with 18 g of sediment and 900 ml of overlying 20-µm labfiltered seawater at a salinity of 30 ppt. The tests were performed at a temperature of 15 ± 1 C under a 16:8 hour light:dark regime. Two concurrently tested negative controls consisted of 1) clean rinsed beach sand with filtered seawater, and 2) a water-only exposure with no sediment added. The experimental design consisted of five laboratory replicate test chambers per site. In addition, a sixth replicate was initiated for each site as a surrogate to perform daily water quality measurements. Fertilized eggs were added 3
5 City of San Buenaventura Dry Weather Toxicity and Chemistry Report Santa Clara River Estuary Project, October 2003 to each test chamber at a density of 20,000 eggs/ml. At test termination, overlying water was carefully poured into a clean beaker. The solution was thoroughly and gently homogenized and a 10-ml subsample was collected and preserved with 1 ml of seawater-buffered Formalin prior to scoring. Temperature, DO, ph, and salinity were monitored daily in the surrogate test chamber for each site. Subsamples of overlying water from each site were collected for total ammonia analysis both at test initiation and termination. Additionally, subsamples of sediment porewater were collected prior to test initiation and analyzed for total ammonia. Porewater was collected by centrifuging the whole sediment at 3500 rpm for a period of fifteen minutes. A concurrent reference toxicant test (positive control) using copper (II) chloride (CuCl 2 ) was conducted in conjunction with the sediment test. STATISTICAL ANALYSIS OF TOXICITY DATA Eohaustorius responses were analyzed using a one-way analysis of variance (ANOVA) or non-parametric Kruskal-Wallis. Homogeneity of variance was checked using the F- test for equal variance and normality of data was checked using the Kolmogorov- Smirnov test. To evaluate differences between the control sediment and each sample location, one-tail Student s t-tests were performed. Proportion values were not transformed prior to analysis due to a normal distribution of the data. Analysis of bivalve response data among test sediments was conducted using one-way non-parametric ANOVA (Kruskal-Wallis). To evaluate differences between the control sediment and each sample location, one-way Student s t-tests were performed on untransformed proportion data. Welch s Correction was applied when a significant difference in variance was observed. Relationships between grain size and sediment trace metals (Cu, Ni, Se, and Zn) to amphipod and bivalve responses were evaluated using Pearson correlations. Analyses were performed using GraphPad Prism Version 4.00 statistical software. Analysis of reference toxicant data was conducted using ToxCalc Comprehensive Toxicity Data Analysis and Database Software, Version 5.0. Median Lethal Concentration (LC 50 ) or Median Effect Concentration (EC 50 ) values were determined using Maximum Likelihood Probit, Trimmed Spearman-Karber, or Linear Interpolation 4
6 City of San Buenaventura Dry Weather Toxicity and Chemistry Report Santa Clara River Estuary Project, October 2003 Analysis. The choice of statistical method used was dependent upon specific assumptions met by the data. CHEMICAL ANALYSES Analysis of total organic carbon (TOC), copper, nickel, zinc, and selenium in the sediments was performed by CEL (Appendix F). RESULTS AND DISCUSSION Amphipod and bivalve result summaries are shown in Figures 1 and 2. Detailed summaries are contained in Appendix A. Bioassay water quality and ammonia data are located in Appendix B. Reference toxicant data are located in Appendix C and statistical analyses are found in Appendix D. Grain size, analytical chemistry data reports, field collection data logs, and chain-of-custody information can be found in Appendices E, F, G and H, respectively. SUMMARY OF TOXICITY TEST RESULTS In summary, no toxicity to Eohaustorius estuarius in whole sediments was observed. Toxicity to bivalve larvae was observed in several samples with greatest responses occurring in Sites B-1 and B-3. AMPHIPOD BIOASSAYS All water quality measurements recorded during the 10-day amphipod exposure with Eohaustorius estuarius were within the range defined as acceptable by the test protocol (Appendix B-1). Mean survival among the water only controls and the sediment controls was 90 and 89 percent respectively (Appendix A-1). Recommended EPA acceptability criterion for this test is a mean of 90 percent survival in the controls. The test was deemed acceptable for reporting purposes as the two control results bracket this value by one percent with a combined mean of 89.5 percent. Mean survival among the individual field replicates ranged from 82 to 91 percent. One-way ANOVA found no significant differences among the sites. Pair-wise comparisons using one-tailed Student s t-tests also indicated that no sites exhibited a statistically significant reduction in survival when compared to the control (Appendix D-1). 5
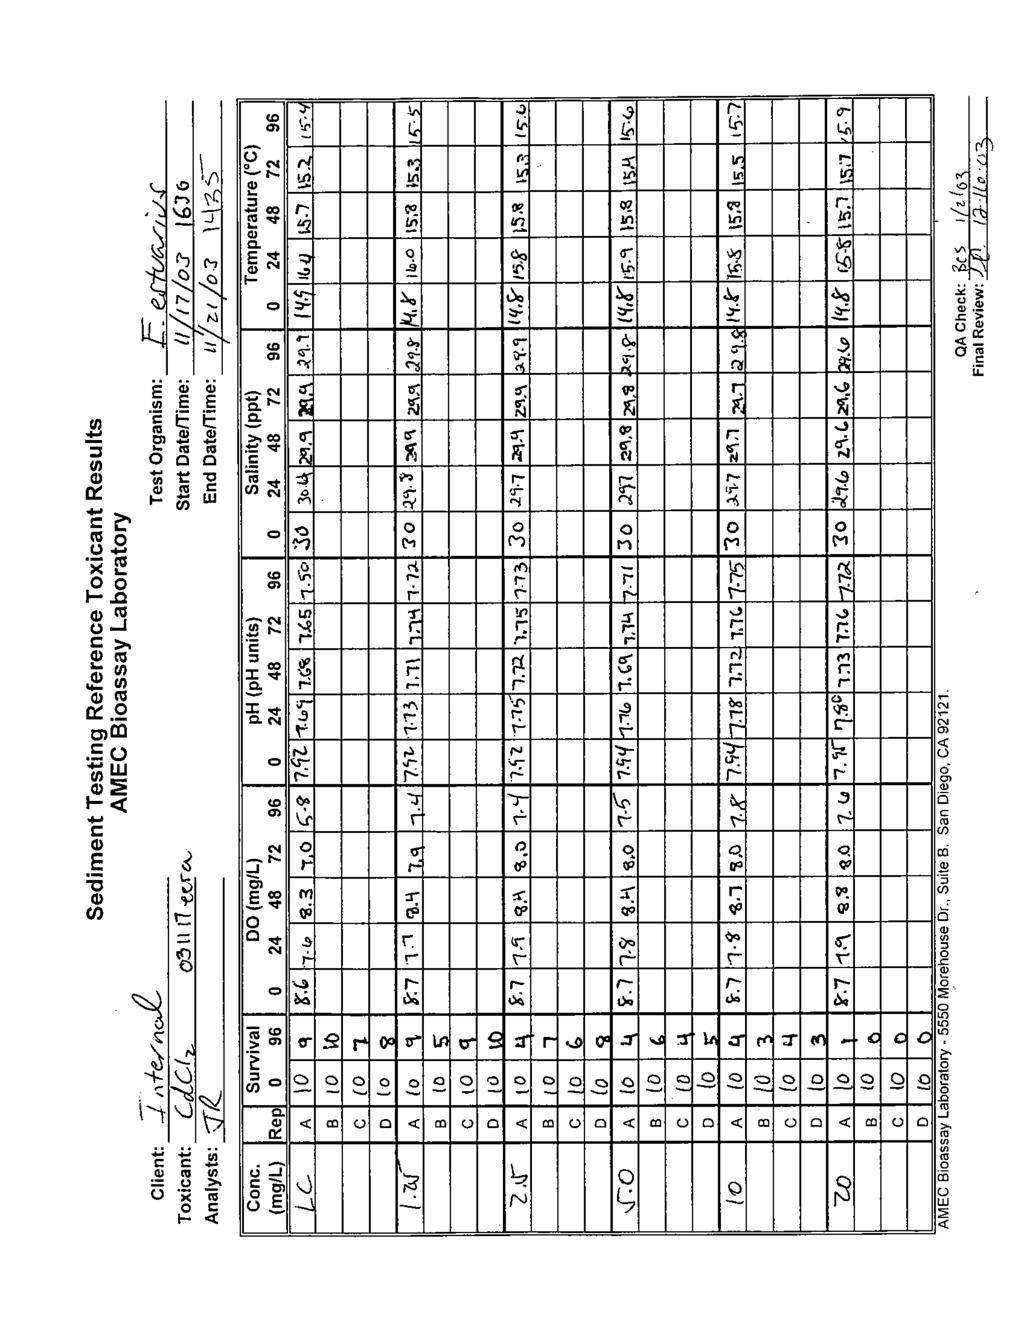
7 City of San Buenaventura Dry Weather Toxicity and Chemistry Report Santa Clara River Estuary Project, October 2003 Amphipod Survival % Survival Control A-1 A-2 A-3 B-1 B-2 Site B-3 B-4 C-1 C-2 C-3 Figure 1. Amphipod survival results (mean ±1 SD, n=5). Santa Clara River Estuary dry weather monitoring event, 17 October No statistically significant decreases relative to the control were observed (p < 0.05, one-tailed t-test). Correlations to Sediment Characteristics No statistically significant relationships between amphipod survival and sediment trace metals were observed (Appendix D-3). A negative relationship, however, was observed with percent sand and gravel. Reference Toxicant Test A concurrent reference toxicant test using CdCl 2 was conducted in order to assess the health and sensitivity of the test organisms. Mean control survival in the reference toxicant was 85 percent (Appendix C). The LC 50 was determined to be 5.86 mg/l CdCl 2 (as cadmium) using the Maximum Likelihood-Probit method. This value falls within of ± two standard deviations of laboratory control chart limits (Appendix C). 6
8 City of San Buenaventura Dry Weather Toxicity and Chemistry Report Santa Clara River Estuary Project, October 2003 Ammonia Total ammonia levels in interstitial porewater ranged from 0.1 to 15.4 mg/l among all test sediments. Ammonia in overlying water ranged from 0.5 to 3.1 mg/l and 0.4 to 5.7 mg/l for day zero and day ten, respectively (Appendix B-1). Levels of total ammonia were well below those (30-60 mg/l) reported to be toxic to this species (Kohn et al. 1994). BIVALVE WHOLE SEDIMENT EMBRYO DEVELOPMENT BIOASSAYS All water quality measurements during the 48-hour bivalve bioassays were within acceptable ranges outlined in the test protocol (Appendix B-2). Normal development (normality) was calculated for all replicates by dividing the number of normal larvae counted in a given replicate by the total number of surviving larvae in that replicate. Normality in the water only and laboratory sediment control was 92 and 89 percent, respectively, indicating that the test organisms were healthy and test conditions were adequate. The water only value exceeds the recommended acceptability criterion of 90 percent (ASTM 1991). Mean normal development in the test samples ranged from 55 to 96 percent among all field replicates. Student t-tests identified statistically significant reductions in normal development of bivalve larvae in Sites A-2, B-1, and B-3 when compared to the control at an alpha level of 0.05 (Appendix D-3). Survival was derived from the total number of larvae (normal and abnormal) recovered in a 10-ml subsample of overlying water from each test chamber. Percent survival was then calculated based on the mean total number of embryos recovered in the test chambers divided by the mean total number of embryos recovered in the sediment control. Mean survival relative to the sediment control following exposure to the test sediment ranged from 39 to 110 percent. Student t-tests detected several sites which showed a statistically significant reduction in survival when compared with the control. Sites A-1, B-1, B-3, and B-4. A combined normality/survival endpoint (effective survival) was also calculated for all replicates. This measurement was derived by dividing the number of normal embryos counted by the mean total number of embryos recovered in the sediment control. This endpoint is useful in that it considers abnormal, yet surviving larvae, as unviable and therefore only takes into account normal larvae, which can be expected to develop into 7
9 City of San Buenaventura Dry Weather Toxicity and Chemistry Report Santa Clara River Estuary Project, October 2003 Normal Development Survival % Normal Control A-1 * A-2 A-3 B-1 B-2 * Site * B-3 B-4 C-1 C-2 C-3 % Survival Control A-1 * A-2 A-3 B-1 B-2 * Site * * B-3 B-4 C-1 C-2 C-3 Effective Survival 140 % Normal/Survival Control A-1 A-2 A-3 B-1 B-2 * Site * B-3 B-4 C-1 C-2 C-3 Figure 2. Summary of bivalve embryo development test results (means ±1SD, n=5). Santa Clara River Estuary dry weather monitoring event, 17 October * Indicates statistically significant decreases relative to the sediment control (p < 0.05, one-tailed t- test). viable adults. The effective survival for the laboratory sediment control was 89 percent. This value exceeds the recommended acceptability criterion of 70 percent (ASTM 1991, PSEP 1995). The effective survival ranged from 23 to 99 percent among all sediment samples. Student t-tests identified statistically significant reductions in the effective survival when compared to the control in Sites A-1, A-2, B-1, and B-3. It should be noted that effective survival is calculated in the ASTM and PSEP test protocols by dividing the total number of normal recovered embryos in each test chamber 8
10 City of San Buenaventura Dry Weather Toxicity and Chemistry Report Santa Clara River Estuary Project, October 2003 by time zero counts, determined through counts in surrogate test chambers terminated immediately after initiation. Time zero counts were not properly collected for this test series, therefore, total recovery of embryos in the sediment control was used for this calculation. This comparison may actually be more meaningful because unviable fertilized embryos will be lost in the sediment prior to ending the 48-hour test. This loss of embryos in the sediment matrix usually makes the derivation of survival in test sediment from that in a water-only control conservative. The water-only control also serves as a comparison to ensure that there are no problems with the test and normal development for all embryos, including any unviable ones remaining on the bottom of the jar was 92 percent for this test series. Correlations to Sediment Characteristics No statistically significant relationships between bivalve responses and grain size or sediment trace metals were observed (Appendix D-3). Reference Toxicant Test A reference toxicant test using CuCl 2 was conducted concurrently in order to assess the health and changes in response of test organisms. Mean normal development in the controls was 89 percent. The EC 50 value was determined to be µg/l CuCl 2 (as copper) by the Trimmed Spearman-Karber method. This value falls outside of internal control chart limits of ±2 standard deviations (4 to 19 µg/l, Appendix C), but was deemed reportable, as there was a clear dose response relationship to the reference toxicant. These reference toxicant results indicate that the organisms used for this study may have been slightly less sensitive than those normally tested in our laboratory. Ammonia Overlying water samples were collected for ammonia measurement at the beginning and end of the test period. Total ammonia levels in overlying water ranged from <0.1 to 1.6 mg/l (Day 0) and 0.2 to 1.1 (Day 2) among all test sediments (Appendix B-2). All total ammonia levels were below a concentration (4.0 mg/l) reported to effect bivalve embryos (Tang, 1997). 9
11 City of San Buenaventura Dry Weather Toxicity and Chemistry Report Santa Clara River Estuary Project, October 2003 SEDIMENT QUALITY Copper concentrations were relatively low at all sites, generally between 2.3 and 4.2 mg/kg, except at sites A-1 and B-4 where they reached 16.9 and 19.3 mg/kg, respectively (Figure 3). These two sites were also associated with the highest concentrations of organic carbon, with TOCs of 10,920 and 16,950 mg/kg, respectively. TOC at the other sites ranged from 1590 to 7070 mg/kg. These data are shown in Appendix Table F-1, which also includes selenium, nickel and zinc concentrations in the different samples. Concentrations of nickel ranged between 0.6 and 20.4 mg/kg, with no apparent trend across sites. Selenium concentrations were below the detection limit of 0.5 mg/kg at most sites; the highest concentration was 0.9 mg/kg. Concentrations of zinc were somewhat more variable, and ranged from below detection to 63.1 mg/kg across the sites; however, there was no apparent relationship between zinc concentrations and the location of the site sampled. Sediment Copper vs Bivalve Larvae Toxicity 17 October Copper ERL 35 % Normal/Survivors Copper (mg/kg dry wt) 0 A-1 A-2 A-3 B-1 B-2 B-3 B-4 C-1 C-2 C-3 Site % Norm/Surv Copper 0 Figure 3. Relationship between sediment copper levels, copper effects-range low (ERL) values, and bivalve embryo development. Santa Clara River Estuary dry weather monitoring event, 17 October
12 City of San Buenaventura Dry Weather Toxicity and Chemistry Report Santa Clara River Estuary Project, October 2003 To determine if these metals concentrations are likely to cause adverse effect on the benthic community, these concentrations were compared with the effects range-low (ERL) values proposed for marine and brackish waters by Long et al. (1995). These values correspond to the 10 th percentile concentration at which biological effects were reported in a large dataset compiled by these investigators. All measured concentrations were below their respective ERL values (no value is available for selenium). However, the two highest concentrations of nickel were slightly over 20 mg/kg; the ERL for nickel is 20.9 mg/kg. The relationship between sediment copper levels, copper effects-range low (ERL) values, and bivalve embryo development is graphically shown in Figure 3. SEDIMENT GRAIN SIZE The distribution of sediment grain sizes is summarized in Appendix Table E-1. Virtually all of the sites contained relatively coarse-grained sediments, predominantly composed of sand. Percent fines ranged between 1.3 and 5.6 percent, except for sites A-1 and B- 4, which exhibited 47.9 and 60.8 percent fines, respectively. These two sites were also associated with the highest concentrations of TOC and copper. AMBIENT WATER QUALITY AND FIELD CONDITIONS Water depths ranged between 3.0 and 7.0 feet, depending upon location. The deepest points were associated with the lower portion of the main river channel (sites A-2 and B- 3). There was little indication of temperature stratification; temperatures across all sites and depths ranged between 20.7 and 22.2 C. ph was highest above the bridge (9.2) and lowest at the effluent discharge point (7.1). Otherwise, ph at all sites ranged between 8.6 and 8.9. Salinity and conductivity exhibited similar patterns, with most sites averaging between 2.0 and 2.4 ppt, regardless of depth. Exceptions included sites A-2 and B-3, which exhibited noticeably higher salinities (11-12 ppt) at the bottom depth compared with the surface and mid-water sampling points. Site A-1 exhibited a modest increase in salinity at the bottom, compared with mid-water and surface measurements; this site was located in the discharge channel. The lowest salinity (1.5 ppt) was observed at the surface at the effluent discharge point, and increased with increasing depth to a maximum of 2.9 ppt at this site. Dissolved oxygen was supersaturated at all sites, except at the discharge point which was 7.5 mg/l. These data are presented in Appendix Table G-2. 11
13 City of San Buenaventura Dry Weather Toxicity and Chemistry Report Santa Clara River Estuary Project, October 2003 REFERENCES American Society for Testing and Materials (ASTM), Conducting 10-day static sediment toxicity tests with marine and estuarine amphipods. ASTM Designation E American Society for Testing and Materials (ASTM), Standard guide for conducting static acute toxicity tests starting with embryos of four species of saltwater bivalve molluscs, ASTM Designation: E GraphPad Software Inc GraphPad Prism, Version 4.00 Kohn, N.P., J.Q. Word, D.K. Niyogi, L.T. Ross, T. Dillon, and D.W. Moore Acute toxicity of ammonia to four species of marine amphipod. Marine Env. Res. 38: Puget Sound Estuary Program (PSEP) Recommended Guidelines for Conducting Laboratory Bioassays on Puget Sound Sediments. Interim Final. U.S. Environmental Protection Agency Region 10, Office of Puget Sound, Seattle, WA, July U.S. Environmental Protection Agency (EPA) Methods for Assessing the Toxicity of Sediment-associated Contaminants to Estuarine and Marine Amphipods. U.S EPA Office of Research and Development, Washington DC. EPA 600/R-94/025, June Tang, A., J.G. Kalocai, S. Santos, B. Jamil, J. Stewart Sensitivity of blue mussel and purple sea urchin larvae to ammonia. Poster, Society of Environmental Toxicology and Chemistry, 18 th Annual Meeting, San Francisco, CA. Tidepool Scientific Software, ToxCalc Comprehensive Toxicity Data Analysis and Database Software, Version
14
15
16
17
18
19
20
21
22
23
24
25
26
27
28

29
30
31
32
33
34
35
36

37
38
39
40
41
42
43
44
45
46
47
48
49
50
51

52
53
54

55
56
57
58

59

60
61
62
63
64
65
66
67
68
69
70
71
72
73
74
75
76
77
78
79
80
81
82
83
84
85
86
87

88
89
90
91
92
93
94
95
96
97
98
99
100
101
102
103
104
105
106
107
108
109
110
111
112
113
114
115
116
117
118
119
120
121

122