The challenge of tropospheric ozone in the W. US Dan Jaffe
|
|
|
- Leslie Stafford
- 5 years ago
- Views:
Transcription

1 The challenge of tropospheric ozone in the W. US Dan Jaffe

2 Jaffe group mission...to study and understand the local, regional and global sources of pollution in the Western US, with an emphasis on O 3, aerosols and Hg. We also seek to understand the chemical processing of these pollutants and their links to climate change. Funding from NSF, EPRI (NASA, EPA)
3 Trinidad Head, N. California O 3 profiles: O 3 is only regulated pollutant with positive gradient with height. O 3 is only regulated pollutant where background concentrations are more than 50% of the health threshold.
4 Current O 3 Standard Based on maximum daily 8-hour average (MDA8); To be in compliance, annual fourth highest MDA8, averaged over 3 years must be less than or equal to ppmv. Highest 4 days each year matter; Other 361 days don t matter; Average O 3 not a meaningful metric for compliance with standard. This poses particular challenge for Eularian models (Rastigejev et al 2010; McDonald-Buller et al 2011)
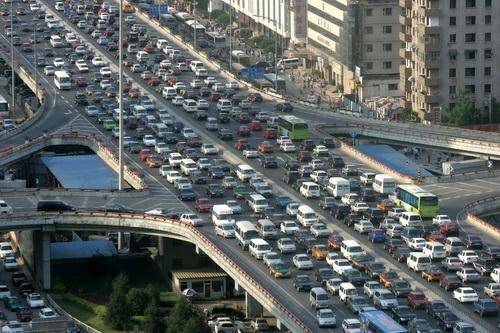
5 Non-attainment areas for O 3 standard 3-year average of the annual 4 th highest daily 8-hour max Existing std: 75 ppbv Proposed new std ppbv Currently ~150 million people live in non-attainment areas based on urban/suburban air monitoring.

6 Non-attainment areas for O 3 standard 3-year average of the annual 4 th highest daily 8-hour max Mt. Bachelor Great Basin NP No data Existing std: 75 ppbv Proposed new std ppbv Note that GRB has higher O 3 then Reno, likely due to NOx titration effect in Reno and higher elevation at GRB.
7 O 3 at Great Basin N.P. 3-year average 4 th highest = 70 ppbv for NPS/CASTNET data

8 Average MDA8 at 10 Rocky Mtn CASTNET sites Great Basin Avg MDA8 at these sites significantly correlated with elevation. While there are site to site differences, interannual variations are significantly correlated across most sites (Jaffe 2011).
9 Average number of exceedance days per site per year at various thresholds The interannual variations are significantly correlated across all 10 sites, which indicates large scale variations. What controls these interannual variations?
10 PPBV Seasonal variations at CASTNET sites in the West Month BBE CAN CHA CNT GRB GRC GTH MEV PND ROM YEL Mean Average MDA8 by month. Many sites have mean MDA8s near 60 ppbv. Avg number of exceedance days per month at 65, 70 and 75 ppbv. Spring: Asia/UTLS Summer: Wildfires


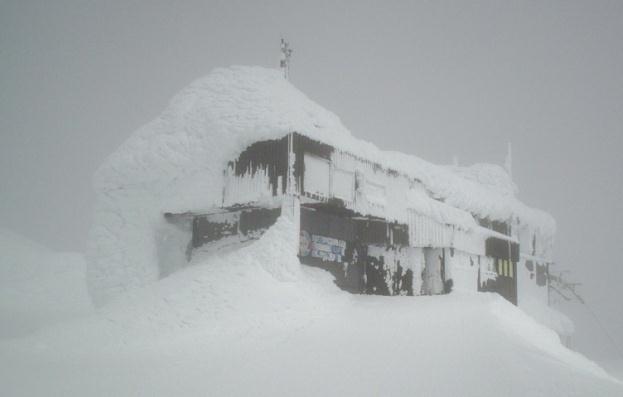
11 Mt. Bachelor, Oregon, 2.7 km above sea level Photo by Randy Hopfer The only high elevation/free tropospheric atmos. research site in western U.S. Continuous observations of CO, O 3, aerosols and Hg since Frequent detection of Asian pollution plumes (Jaffe et al., 2005; Weiss- Penzias et al., 2006; 2007; Swartzendruber et al., 2006; Strode et al., 2007)
12 Chemical measurements CO: Cavity Ring Down Spectroscopy CO 2 : Cavity Ring Down Spectroscopy O 3 : UV spectroscopy NOy: Chemiluminescence spectroscopy Mercury (Hg): Cold vapor atomic fluorescence (CVAFS) Hydrocarbons: Gas chromatography/mass spec. NOx: Chemiluminescence spectroscopy w/uv photolysis Acids (H 2 SO 4, HNO 3 ): Ion chromatography Peroxyacetyl nitrate: Gas chromatography-ecd Particulate matter: light scattering, light absorption Aerosol chemistry: X-ray fluorescence Multiple measurements are essential to understand the sources and chemical processing.
13 Source Identification Chemical ratios (Chemical fingerprint) Backward airmass trajectories Satellite data Chemical Transport Models
14 Pollution episode at Mt. Bachelor: April 25, 2004 What is the source? MDA8 = 71 ppbv
 MDA8 = 71 ppbv.")
15 Mt. Bachelor back trajectories, April 25, backward air trajectories for the times around the highest concentrations ( GMT) and for a grid of locations surrounding the summit of MBO. Nighttime and dry air confirm transport in the FT. Use backtrajectories and chemical fingerprint to confirm Asian source. (Jaffe et al 2005; Weiss-Penzias et al 2006; 2007; NRC 2009) MDA8 = 71 ppbv.
16 Growth in Chinese Emissions
17 Observed trend in Spring O 3 at Mt. Bachelor April-May data Trend is significant at 95% C.I. Jaffe et al (in-prep)
18 Spring O 3 trends over western North America Observed: Mt. Bachelor, : 0.89 ppbv/year Aircraft and sondes, : 0.63 ppbv/year (Cooper et al 2010). Modeled: Global Chemical Transport Model (GEOS-CHEM): 0.5 ppbv/year based on increasing Asian emissions for (Zhang et al 2008). Are there other factors responsible for increasing O 3? Is the rate of increase increasing? Is the model under-estimating the trend due to Asia?
19 Upper Trop/Lower Strat Intrusion MDA8 = 108 ppbv.

20 Fire on the Mountain: O 3 Impacts Photo by Jon Hee View from Mt. Bachelor to the north on 9/19/ Up to 9 ppmv and 1000 µg/m 3 seen at MBO.
21 MDA8 = 72 ppbv O 3 from July wildfire
22 Summer 2012 observations: Look at combustion efficiency using ratios of CO/CO 2, NOy/CO, etc. Modified combustion efficiency (MCE) = CO 2 /(CO+CO 2 ) Typical values for wildfires range from 0.80 (smoldering) to 0.99 (flaming). Use satellite data on Fire Radiative Power which gives quantitative information on fire power (Wooster et al 2003; Val Martin et al 2010)
23 Fire plumes at MBO: August 2012

24 MODIS fire plumes and HYSPLIT back trajectories for Aug th fire events at MBO MBO
25
26 High O 3 at Mt. Bachelor On avg we see 4 days per year with 8-hour avg O 3 g.t. 70 ppbv. MBO would not meet a new O 3 std. Based on the chemical and met. indicators the sources are: 1. Subsidence of upper tropospheric-lower stratospheric air (natural); 2. Long-range transport events from Asia; 3. Wildfires. Springtime O 3 is increasing ~0.89 ppbv/year ( ) Ambrose et al 2011; Wigder et al 2012
27 Project to identify O 3 sources at Great Basin N.P. (Gustin/NV DEP) Goal is to combine existing O 3 data with observations, including satellite data and IMPROVE aerosol data. Ozone sources at GBNP: Same as Mt. Bachelor (Asian, UT/LS, Wildfires) Transport of regional pollution from Las Vegas and/or California sources.
28 UTLS/Asian air at GBNP MDA8 = 79 ppbv; PM2.5 = 3.8, ug/m3; very dry air
29 Transport from Calif and/or Las Vegas to GRB MDA8 = ppbv (7/30/00-8/3/00 PM2.5 = 7.9 ug/m3
30 What can chemical transport models tell us? dx/dt =

31 O 3 at Mt. Bachelor in GEOS-CHEM Global Model Black is observations Red is model Blue is Asian contribution Zhang et al 2008, 2011 Purple is change due to rising Asian emissions.
32 MDA8 values for 2006 for Gothic Colo. from GEOS-Chem and CASTNET observations Black = Obs Red = GC-std Blue = GC-Linoz Highest MDA8 values for the year were on April th, 83 and 88 ppbv, respectively. The Hysplit trajectories (right) and very low observed water vapor mixing ratios for these days suggests a Asian or UTLS source which was not well modeled by GEOS-CHEM. Need a combination of observations plus modeling to correctly id sources. (McDonald-Buller et al 2011)


33 How does FT O 3 influence surface/urban AQ? Mt.Bachelor Boise 48-hour forward air trajectories starting from Mt. Bachelor Wigder et al 2012
34 Transport of O 3 from MBO to Boise: May 2010 MBO-MDA8 Boise-MDA8 MDA8 O 3 at MBO and Boise. Note that peaks at MBO seen at night, peaks at Boise seen in afternoon of next day, consistent with the transport time. This suggests that high O 3 at MBO gets mixed down to the surface. (Wigder et al 2012)
35 Use of CMAQ to model FT-BL exchange for 4/6/2010 using WSU-AIRPACT group (Lamb, Vaughan, Thorpe) MBO Boise

36 Modeled FT O 3 tracer for 4/6/2010 Vertical cross-section Surface mixing ratio MBO Boise MBO Boise
37 O 3 sources in the Western U.S. 1. Transport of regional pollution (eg. California to Nevada). 2. Asian LRT pollution (and increasing) 3. UTLS airmasses; 4. Wildfires (and increasing) UTLS and Asian sources have much greater influence above 2 km asl.
38 The Clean Air Act Clean Air Act requires review of air quality standards every 5 years based on current scientific/health data; CAA requires EPA to set air quality standard at a level to protect health of all people, including sensitive populations. CASAC has recommended a standard between ppbv; Given what we now know about sources of O 3 in the western U.S. many areas of the west will not be able to meet a standard at 70 ppbv or below based on domestic actions. This puts the EPA in a very challenging position!
39 Summary: The way forward? O 3 in the west includes both controllable/domestic and uncontrollable sources; Most sites above 2 km elevation will not meet a standard at or below 70 ppbv; EPA could keep standard at current level, thus ignoring new health data and CASAC; EPA could consider elevation in setting the new standard; If standard is lowered, then states will likely increasingly make use of the exceptional events policy to exclude uncontrollable sources ; More work for air quality scientists!


40 MBO met tower and air sampling inlet


41 Mt. Bachelor Observatory Working in a blizzard After the storm

42 Another day at the office? More information on my research group: National Academy of Sciences study on global pollution: Google Global sources of local pollution
43