COMPANY OVERVIEW. May 2015
|
|
|
- Eileen Gallagher
- 5 years ago
- Views:
Transcription

1 COMPANY OVERVIEW May 2015
2 Forward Looking Statements Advisory This presentation is for information purposes only and is not intended to, and should not be construed to, constitute an offer to sell or the solicitation of an offer to buy securities of Enerflex. Certain statements containing words such as anticipate, could, expect, seek, may, intend, will, believe and similar expressions, statements that are based on current expectations and estimates about the markets in which the Company operates and statements of the Company s belief, intentions and expectations about development, results and events which will or may occur in the future constitute forward-looking statements and are based on certain assumptions and analyses made by the Company derived from its experience and perceptions. All statements, other than statements of historical fact contained in this presentation are forward-looking statements, including, without limitation: statements with respect to anticipated financial performance; future capital expenditures, including the amount and nature thereof; bookings and backlog; oil and gas prices and demand; other development trends of the oil and gas industry; business prospects and strategy; expansion and growth of the business and operations, including market share and position in the energy service markets; the ability to raise capital; expectations regarding future dividends; expectations and implications of changes in government regulation, laws and income taxes; and other such matters. In addition, other written or oral statements which constitute forward-looking statements may be made from time to time by and on behalf of the Company. Such forward-looking statements are subject to important risks, uncertainties, and assumptions which are difficult to predict and which may affect the Company s operations, including, without limitation: the impact of general economic conditions; industry conditions, including the adoption of new environmental, taxation and other laws and regulations and changes in how they are interpreted and enforced; volatility of oil and gas prices; oil and gas product supply and demand; risks inherent in the ability to generate sufficient cash flow from operations to meet current and future obligations, including future dividends to shareholders of the Company; increased competition; the lack of availability of qualified personnel or management; labour unrest; fluctuations in foreign exchange or interest rates; stock market volatility; opportunities available to or pursued by the Company and other factors, many of which are beyond its control. As such, actual results, performance, or achievements could differ materially from those expressed in, or implied by, these forward-looking statements and accordingly, no assurance can be given that any of the events anticipated by the forward-looking statements will transpire or occur, or if any of them do so, what benefits, including the amount of proceeds or dividends the Company and its shareholders, will derive there-from. The forwardlooking statements contained herein are expressly qualified in their entirety by this cautionary statement. The forward-looking statements included in this presentation are made as of the date of this presentation and other than as required by law, the Company disclaims any intention or obligation to update or revise any forward-looking statements, whether as a result of new information, future events or otherwise. This presentation and its contents should not be construed, under any circumstances, as investment, tax or legal advice. Any person accepting delivery of this presentation acknowledges the need to conduct their own thorough investigation into Enerflex before considering any investment in its securities. More complete information pertaining to Enerflex, in particular historical financial information, can be accessed through the SEDAR website ( or at the Company s website ( All figures in Canadian funds unless otherwise indicated.
3 Market Information TSX Ticker Symbol 52-Week Price Range EFX $ $14.04 Market Capitalization Shares Outstanding Held by Management Annualized Dividend Annualized Dividend Yield $1.1 Billion 78.7 million 1% $0.34/share 2.4% 3
4 Q Highlights Engineered Systems backlog of $715.1 million as at March 31, 2015 (a 11% decrease over the same period in 2014). Revenue for the three months ended March 31, 2015 was $475.3 million (a 43% increase over the same period in 2014). EBITDA and EPS from continuing operations for the three months ended March 31, 2015 was $54.4 million and $0.29 respectively (a 172% and 480% increase respectively over the same period in 2013). Achieved mechanical acceptance on the Omani turn-key project. Continued to implement cost-cutting initiatives in response to the downturn in commodity prices.


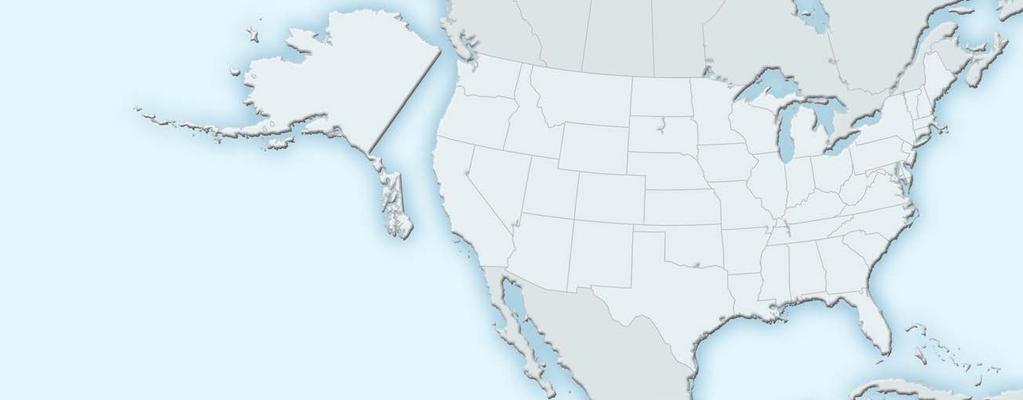
5 Full Cycle Natural Gas Solutions Compression, Processing and Electric Power Solutions Canada USA MEA Europe / CIS Asia Revenue Market Cap Shares Outstanding Sales & Service Locations $1.9 Billion $1.1 Billion 78.7 Million Annualized Dividend 2.4% 52 Week High $ Week Low $14.04 Employees 3, * Trailing 12 months Latin America Australia Calgary, Alberta Calgary, Alberta Houston, Texas Perth, Australia Brisbane, Australia


6 Standardized and Customized Equipment Compression and Process Reciprocating and rotary screw compression applications. Small to large horsepower (200 hp 10,000 hp). Conventional and unconventional plays. Production and Processing Systems for gas plants (dew point) and refrigeration systems. Amine systems (H 2 S and CO 2 removal). Dehydration units and CO 2 facilities. Cryogenic plants. Modular design for fast tracking projects.


.")


7 Recurring Revenue Focus Full after-market services for gas engine compressors and power generators. Full turnkey rental opportunities in growth markets. Electric power solutions (250 kw to 50 MW). Construction and product installation. Contract operations and maintenance. Global Platinum Power Packager for GE Waukesha s gas engines and parts. Authorized distributor for Jenbacher and MAN engines and parts in Canada. Retrofit of existing compression packages for optimizing producers assets.

8 Consolidated Revenues Regions 2,000.0 $1,780.7 $1, , , , , , $1,501.7 $1, $1,227.1 $1, (TTM) Canada USA Rest of World Global Diversification with Core Strengths in North America 8


9 Revenue by Geographic Segment and Product Line Geographic Distribution Q % 36% 37% 23% 5% 34% 37% 44% 43% Canada USA Rest of World Q Product Distribution % 8% 37% 22% 6% 5% 37% 72% 73% Engineered Systems Parts and Service Rental
 : 8.")
 $600,000 $40,000 $400,000")
10 Enerflex The Growth Strategy $2,200,000 June 2014 Acquistion of Axip International $160,000 $2,000,000 $1,800,000 CAGR (Revenue) : 12.3% CAGR (Operating Income) : 8.8% 2010 Merger of Enerflex Systems Income Fund & TESI $140,000 $1,600,000 $120,000 Revenue ($ 000's) $1,400,000 $1,200,000 $1,000,000 $800, acquisition of HPS Group $100,000 $80,000 $60,000 Operating Income ($ 000's) $600,000 $40,000 $400,000 $200,000 $20,000 $ TTM 2015 Revenue Operating Income $- 10
11 Liquefied Natural Gas
12 Global LNG Situation Global LNG has become an increasingly attractive market driven by major natural gas discoveries, robust global demand and technological developments. Global LNG Themes Large Volume of Anticipated Supply Numerous LNG projects are expected to enter the market within the next 15 years. Suppliers integrating downstream is a key feature of the new global LNG trade but requires extensive capital commitment. Offtakers have demonstrated interest in investing into upstream and liquefaction areas of the value chain. Global Demand Continues to Increase Sustained demand upsurge from China, increase in Japanese demand post Fukushima and the difficulties seen in development will all have a significant impact on global supply / demand. Rising crude prices creates inflection points, which may increase future LNG demand. Environmental issues related to the coal industry in Asian markets drives need for alternative source fuels. Pricing Structure Considerations Lenders have demonstrated a greater capability to take price risk but volume risk must be fully covered. Pricing renegotiations are likely to affect the marketplace once additional planned global supply begins to enter the market. Project finance lenders seem keen to use major gas aggregators as a buffer. The abundance of shale gas has propelled a +$10.00/Mmbtu gap between 5 year forward Henry Hub and Asian oil-linked LNG prices. Technological Developments Continued developments such as Floating LNG (FLNG) remain unproven but have the potential to substantially lower barriers to entry. Developments must still overcome technical, financial and marketing challenges. 12


13 Worldwide LNG Opportunities Projected first LNG exports BCF per day potential LNG exports from two to four projects by 2025 CANADA UNITED STATES AUSTRALIA >11 BCF per day expected LNG exports in Expected first LNG exports 7.6 BCF per day expected LNG exports by 2020 Significant LNG shipments, current Expected future LNG shipments Major LNG liquefaction area, current* Proposed new/expanded LNG liquefaction area* Major LNG import (regasification) area, current* Projected new/expanded LNG import area* * Can include multiple facilities 3.2 BCF per day LNG export capacity in BCF per day LNG projects under construction 13
14 Canada

15 Canada Head office and two manufacturing facilities located in Calgary, Alberta. 18 Sales and Service locations situated in liquids-rich plays across the region. Over 125 fully equipped service vehicles. Specializes in cold weather compression and production and processing applications and leverages it`s knowledge for field installations. 15

16 LNG Projects Exports of LNG to the Asian market will help support development in the Montney, Horn River, Liard and Cordova Basins. LNG has received support from Canadian provincial and federal governments. Proposed and Existing Natural Gas Pipelines LNG buyers are attracted to secure supply from stable countries such as Canada. Counteracts natural gas oversupply in North America. Asia Pacific LNG demand is expected to reach 31.6 Bcf/d by


17 Electric Power Opportunities Industrial Applications Island Mode Prime Power Co-Generation Combined Heat and Power Applications Energy Export Flare Gas to Energy Landfill Gas to Energy Biogas to Energy 17
18 United States of America

19 United States of America Regional head office and manufacturing facility in Houston, Texas. Sales and Service locations situated across the region. Houston Strategic Advantages: Tidewater location for international shipping. Lower manufacturing cost base to support international projects. Leverages knowledge for field installations. 19
20 US Growth Opportunities Enerflex location 20

21 Gulf Coast LNG Overview Massive industrial projects near abundant source gas could add 183 MMtpa of liquefaction capacity by A favorable regulatory environment makes the Gulf Coast appealing for investors. Gulf Coast Liquefaction Facilities (1) First LNG Plant Capacity Plant Capacity Shipment Country Project Name (MMtpa) (Bcf/d) Status 2015 USA Sabine Pass T Approved 2017 USA Main Pass Energy Hub Potential 2017 USA Corpus Christi LNG T Proposed 2017 USA Cameron LNG T Proposed 2017 USA Pangea LNG Potential 2018 USA Gulf Coast LNG Potential 2018 USA Golden Pass LNG T Proposed 2018 USA Trunkline LNG T Proposed 2018 USA Freeport LNG T Approved 2018 USA Sabine Pass T Proposed 2018 USA Lavaca Bay LNG Proposed 2018 USA Magnolia LNG Proposed 2018 USA CE FLNG Proposed 2020 USA Gulf LNG Potential Total Capacity Additions / Year ( ) (2) Liquefaction Capacity Increase (MMtpa) Sabine Pass T1-4 Main Pass Energy Hub Corpus Christi LNG T1-3 Cameron LNG T1-3 Pangea LNG Gulf Coast LNG Golden Pass LNG T1-3 Trunkline LNG T1-3 Freeport LNG T1-3 Sabine Pass T5-6 Lavaca Bay LNG Magnolia LNG CE FLNG 13.7 Bcf/d 96.5 MMtpa 2.6 Bcf/d 18.0 MMtpa 8.2 Bcf/d 57.5 MMtpa Sources: FERC, Equity Research (1) Chart excludes Waller LNG, Gasfin Development and Venture Global as first LNG shipment dates are unknown (2) Scheduling of capacity additions assumes facilities turned on at earliest projected start date for illustrative purposes; Actual capacity additions per year may differ due to staggered project completion dates and start dates 21
22 Latin America


23 Latin America Strong focus on compression and processing equipment and after-market service. Modern and technologically up-to-date equipment. Compression fleet of 405 units with approximately 248,000 horsepower. 3 gas treating facilities. Committed rental contracts for the deployment of approximately 15,000 horsepower. Mexico Colombia Peru Argentina Brazil Enerflex locations Enerflex unit locations
24 International


25 Australia Projects include: Gas-gathering infrastructure for LNG plants on Australia s northwest shelf Coal-seam gas compression systems for Queensland s local gas demand and upstream LNG development Compression booster stations along most of Australia s pipeline network ICHTHYS SUNRISE PRELUDE BROWSE SCARBOROUGH GORDON WHEATSTONE NORTH WEST SHELF PLUTO I PLUTO II BAYU-UNDAN COOPER GALILEE GUNNEDAH BOWEN/ SURAT GLADSTONE QCLNG APLNG GLNG ARROW Enerflex Locations Operating Under Construction Planned Unconventional Resource Basin


26 Asia Indonesia is currently suffering from gas shortages and looking for ways to increase production through unconventional production. Focus on offshore production platforms and floating production units. Compression rental fleet of 29 units with approximately 15,000 horsepower Kuala Lumpur Bangkok Kota Kinabalu Jakarta 26


27 Middle East/Africa Expected to lead the world in natural gas production over the next 20 years with an estimated 44% of the worlds proven reserves. Growth will be driven by: LNG; Power generation; Desalination plants; and Cooling needs. Compression rental fleet 16 units with approximately 27,000 horsepower. Committed rental contracts for the deployment of 38 additional units with approximately 70,000 horsepower. Bahrain UAE Oman
28 Financial Overview
29 Focused on Profitable Growth $600, % 20.7% $500,000 $400,000 $300, % 18.4% 17.3% 15.7% 16.9% 15.4% 19.3% 19.3% 17.8% 17.7% 20.0% 15.0% $200, % 8.7% 6.4% 8.7% 6.8% 9.5% 7.6% 10.0% $100, % 4.7% 7.6% 5.0% 3.0% $- Q Q Q Q Q Q Q Q Q Q Q % Revenue Gross Margin EBIT GM % EBIT % 29
30 Regional Backlog 1,200 1, Q1 11 Q2 11 Q3 11 Q4 11 Q1 12 Q2 12 Q3 12 Q4 12 Q1 13 Q2 13 Q3 13 Q4 13 Q1 14 Q2 14 Q3 14 Q4 14 Q1 15 Canada USA Rest of World Bookings 30
31 Investment Thesis Proven track record of creating shareholder value through Growth and Dividend Income. Operating income has grown at a CAGR of 8.8% over the past 10 years. Increased dividend by 42% over the past three years. Strong Free Cash Flow. Enerflex has been able to generate strong FCF year over year. Enerflex is leveraged to Global LNG and is positioned to take advantage of the LNG markets in Canada, USA and Australia. Product line and geographic diversification in fast growing natural gas markets. Strong balance sheet allows Enerflex to pursue strategic growth opportunities to further expand the business.
32 WELL POSITIONED AS A NATURAL GAS COMPRESSION AND PROCESSING SOLUTIONS PROVIDER