RED. California Wireless E Routing on Empirical Data. Shaving Time Saving Lives - A Success Story
|
|
|
- Ilene Austin
- 5 years ago
- Views:
Transcription

1 Shaving Time Saving Lives - A Success Story California Wireless E9-1-1 Routing on Empirical Data Jim Thompson Wireless E9-1-1 Project Manager State of California, Office CALNENA - March 2 & 3, 2010 RED

2 9-1-1 Office Mission To enable Public Safety Answering Points to provide the fastest, most reliable, costeffective and secure access to emergency services from any device, anywhere.
3 US Subscribers grew from 60M in 1998 to 276.6M in Worldwide there are 2.5B subscribers* 89% of the US population uses cell phones and used a total of 2.23 Trillion wireless minutes in 2009.* Wireless Background 20.2% of US households are Wireless only. * Californians placed 24.8M E9-1-1 calls in M (67%) were wireless and 8.2M (33%) were landline. 68,098 E9-1-1 calls are made everyday in California with 45,530 of them being wireless. California has deployed 122,531 total cell sectors. 23,385 or 20% were deployed in *CTIA Facts 2009


4 Size of a fire doubles every minute* 1 Min 8 Min Time Critical Issues A person who has stopped breathing or has had a heart attack needs CPR within 6 minutes.* Ventricular Fibrillation Without CPR Death in 6 minutes Routing to Local PSAPs allows Police, Fire and EMS to respond quicker to their communities needs. Crimes in progress have a better chance of being stopped. * Source: Sacramento Metro Fire Department
5 Wireless E9-1-1 Busies and No CDR Decreased 76% from 4,921,936 to 1,178,688 4,921,936 4,400,533 1,178,
6 Wireless Calls delivered to CHP Increased 102% from 3,583,401 To 7,209,054 3,583,401 4,591,364 7,209,
7 Wireless Calls Delivered to Local PSAPs Increased 76% from 3,109,908 to 5,489,444 3,109,908 4,358,909 5,489,
8 Total Wireless Calls Delivered Increased 89% 5,489,444 from 6,693,306 to 12,698,489 3,109,905 3,583,401 4,358,909 4,591,364 7,209,054 PSAP CHP
9 E9-1-1 Calls Including Secondaries and Transfers Wireless Increased 28% Wireline Decreased 20% 13,039,915 15,385,829 16,618,271 10,301,885 9,388,098 8,237,575 Wireless Other
10 Wireless vs. All Other Classes Combined Wireless Increased 20% Wireline Decreased 25% 55.90% 62.10% 66.90% 44.10% 37.90% 33.10% Wireless Wireline
11 RED Concept Routing on Empirical Data Enable PSAPs to Analyze Emergency Call Record Data using a Web based Geographic Information System to Collaboratively Determine the Most Efficient Path to Route Calls.
12 RED Results The RED Project has demonstrated an accurate call sector analysis is the best method to determine wireless routing. On average, 51.0% of sectors currently routed to the CHP are being rerouted from the CHP to Local PSAPs.
13 RED I -Ventura and Santa Barbara counties is complete. RED II -Bay and Monterey Area concludes in April RED Project Progress RED III -SOCAL (less LA) is in progress and ends in June RED IV -LA County, Central and Northern CA has not yet been awarded.
14 RED County Sectors Reviewed Approved Phase I Ventura % Santa Barbara % % of Sectors Reviewed were Accepted for 74% Routing to Local Agencies
15 County Sectors Reviewed Approved San Francisco % San Benito % Napa % Marin % Monterey % Solano % Santa Clara % San Mateo % Sonoma % Santa Cruz % Contra Costa % Alameda % % RED Phase II of Sectors Reviewed were Accepted for 47% Routing to Local Agencies
16 County Sectors Reviewed Approved RED San Diego % Imperial 123 pending Orange 1415 pending Riverside 1957 pending Kern 347 pending San Luis Obispo 227 pending San Bernardino 1544 pending 7622 Phase III of Sectors Reviewed were Accepted for 53% Routing to Local Agencies
17 Production and Management of Digital Maps 230 Agency Maps 1034 CHP Beat Maps 9812 Sector Maps
18 RED: Routing on Empirical Data Project Implementation Implementation of the RED Project phases encompasses dozens of processes and requires the participation and collaboration of all the major stakeholders including the CHP, County Coordinators, PSAP Managers, Wireless Service Providers, the State office, as facilitated by Public Safety Network. Implementation falls into four primary categories
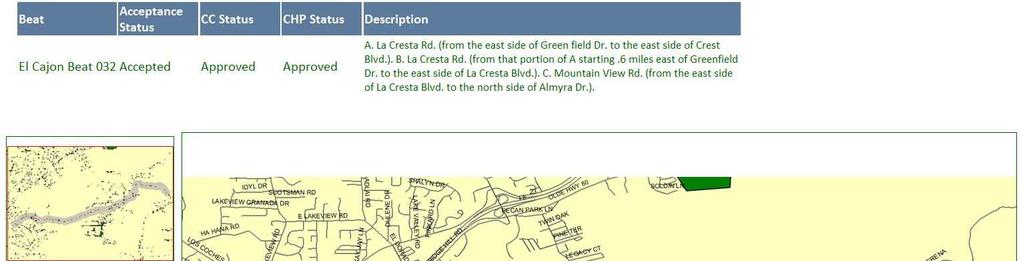
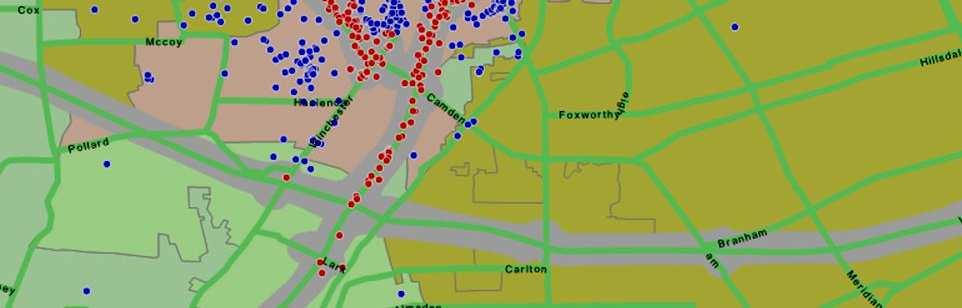
19 Collaborative CHP Map Approval Process


20 On-line PSAP Boundary Maps
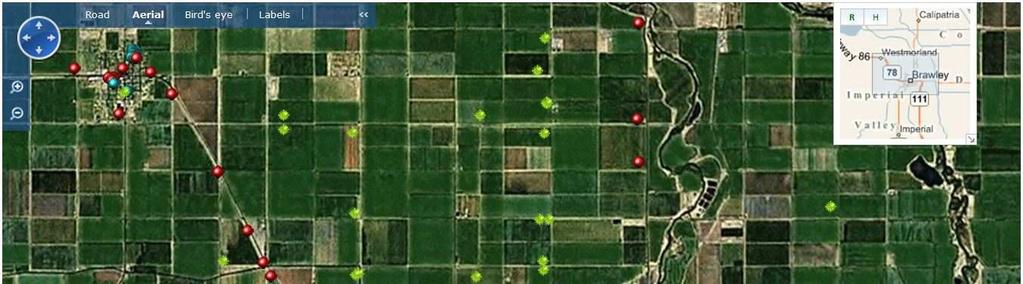
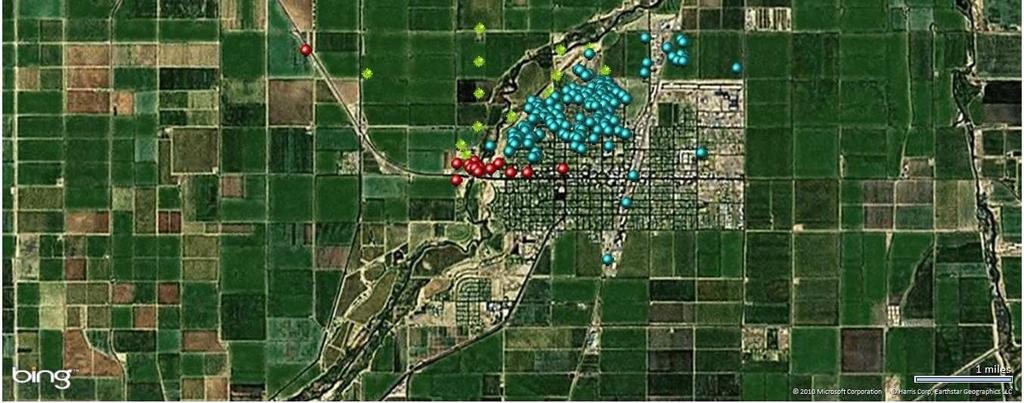
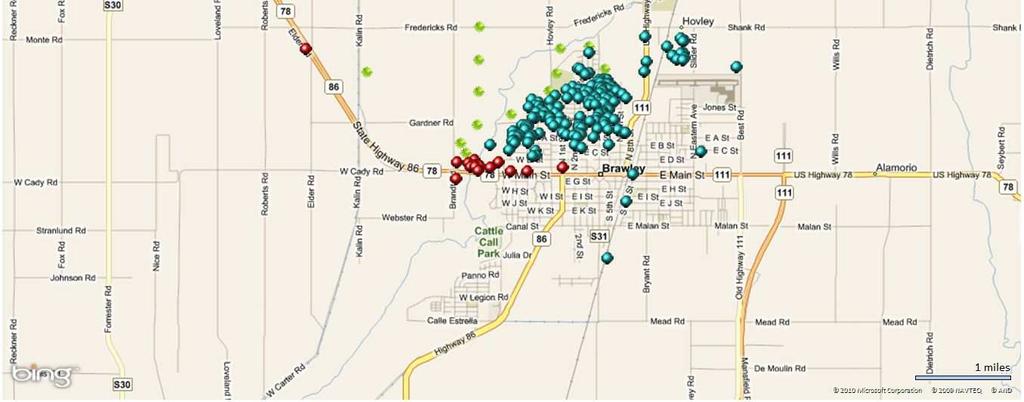
21 Interactive Aerial Image Decision Support
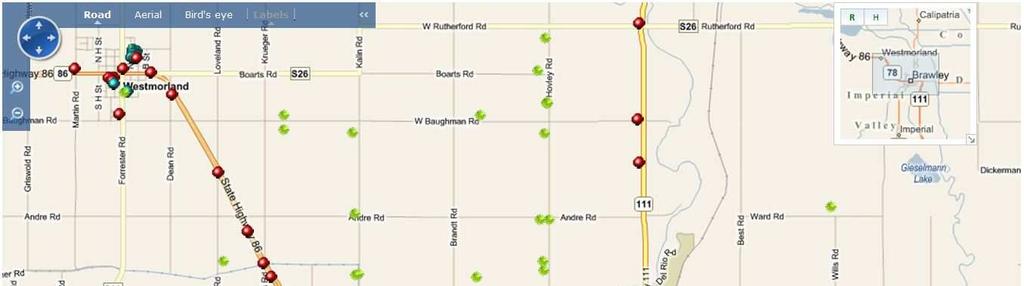
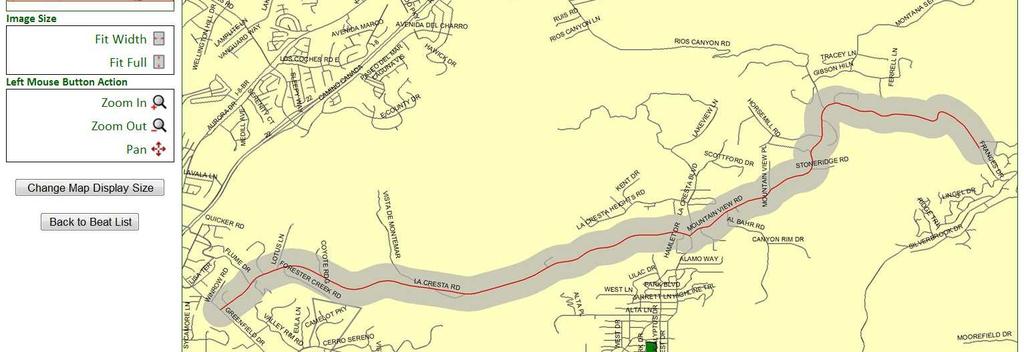
22 Interactive Road Map Decision Support

23 Automated Progress Tracking

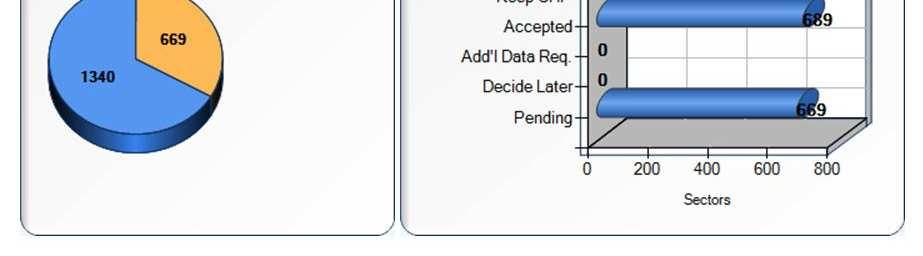
24 Automated Projections Based on Progress


25 Automated Sector Status Reporting

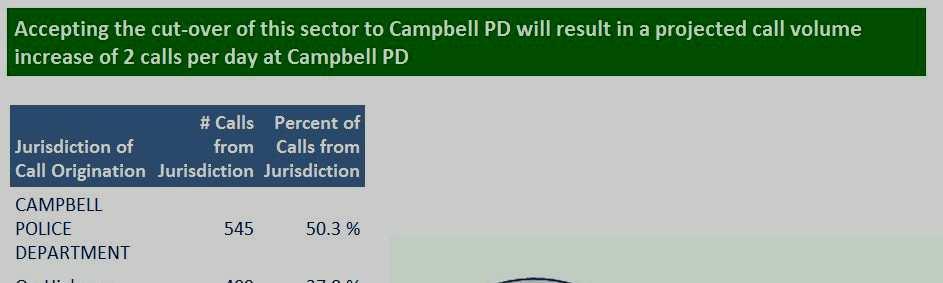
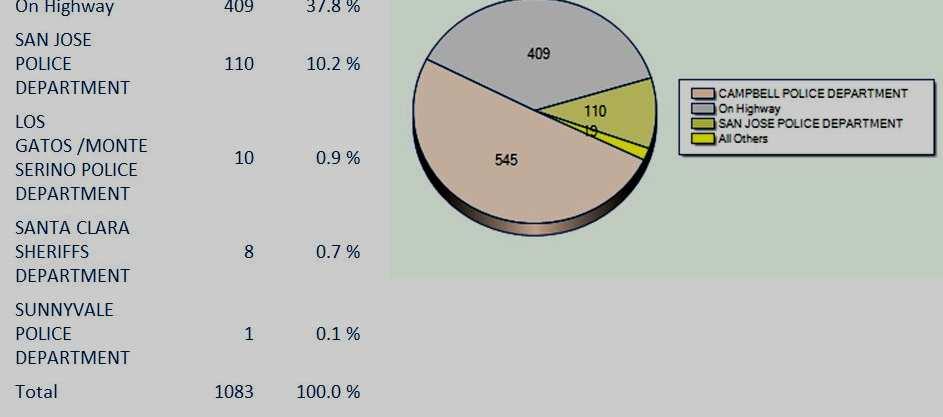
26 Sector Specific Decision Information
27 Cell Sectors Deployed Increased 48% from 82,732 to 122,531 29,141 38,971 53,591 59,338 53,240 69,291 PSAP CHP
28 Cell Sector Routing Verification
29 WSP Maintenance Testing The Office recommends WSPs follow the NENA E9-1-1 Wireless Testing Procedure outlined in the NENA standard to determine when to test with PSAPs. WSPs have the ability to perform internal routine maintenance test of cell sectors without the call being delivered to the PSAP. WSPs should be placing E9-1-1 test calls to the PSAPs only when initially deploying a PSAP, a physical change has been made to a sector, or when an ESN routing assignment has been changed.


30 Wireless Call flow Before RED Call Local Agency Wireless Call flow After RED
31 Contact Information CA Emergency Communications Office Wireless E9-1-1 Project Web Page: Office Consultants Jim Thompson