SSO Estimation. Dustin Tripp City of Raleigh Public Utilities Department
|
|
|
- Austin Archibald Goodman
- 5 years ago
- Views:
Transcription


1 SSO Estimation Dustin Tripp City of Raleigh Public Utilities Department
2 Table of Contents Responsibilities SSO Events Reporting Requirements DEQ How to Determine SSO Volume Examples
3 ORC RESPONSIBILITIES Visit the system as often as is necessary to insure the proper operation of the system but in no case less frequently than specified in the following schedule, unless otherwise specified in permit; Collection Systems: within 24 hours of knowledge of a bypass, spill, or overflow of wastewater from the system unless visited by a collection system Back-up Operator in Responsible Charge;


4 An SSO is occurring what do you do?


5 DON T PANIC Oh crap
6 SSO Events Arrive onsite (within two hours of verification) Assist crews in stopping the overflow Minimize environmental damage Assess amount of spill Begin clean-up Report SSO to DEQ (if necessary)
7 When to Report an SSO When any amount hits a Surface Water of the State (USGS Blue-line) When the amount is over 999 gallons, regardless of surface water Press Release (24 hours) BIMS Report (5 Days) Newspaper Ad (10 Days)
8 SSOs 999 gallons or less No press release required If reaches surface water: Within 24 Hours Notify DEQ Within 5 Days BIMS Report Due
9 SSOs 1000 gallons or more Within 24 Hours Notify DEQ Issue Press Release Within 5 Days BIMS Report Due
10 SSOs 15,000 gallons or more Within 24 Hours Notify DEQ Issue Press Release Within 5 Days BIMS Report Due Within 10 Days Publish Newspaper Ad

11 Newspaper Ad
12 Talking to DEQ Before calling: Address of spill Manhole Facility ID Ex. SMH Time SSO began (estimate) Time SSO stopped (actual) Cause (roots, debris, grease, disposable wipes, paper products, contractor damage, vandalism) SSO Volume Estimated time of cleanup completion USGS Blueline Stream name (if applicable) Could be an unnamed tributary PUMA Show Additional Layers; Environmental
13 Talking to DEQ During the call: Write down Name of staff member Time of Call
14 Clean-Up: No Surface Water Remove solids and liquids Pump to closest manhole or use combo trucks Restore area Apply powdered limestone not near surface waters Seed and straw
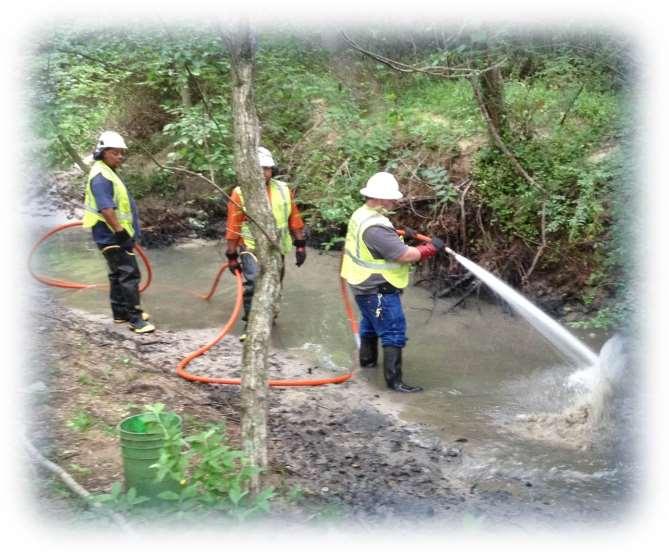
15 Clean-Up: Surface Water Block area downstream To prevent further migration of material Set-up pumps to nearest manholes Multiple pumps may be needed Remove any solids/paper/etc. Use combination trucks (or hydrant with dechlorinator) to wash down surface water Move contaminated water towards pumps
16


17 How to Determine SSO Volume

18 Orange County, CA Estimation Guide
19 Methods Pictorial Reference Flow Rate Visual Vent or Pick Holes Measured Volume Manhole MH Ring Partially Covered MH Open MH Combo/Vacuum Truck Recovery

20 MH Overflow Picture Chart


21 MH Overflow Picture Chart
22 Vent Hole Method To estimate an SSO occurring from the manhole pick and vent holes: Measure the height of the wastewater plume exiting the holes. Find that height and hole diameter on the manhole pick or vent hole chart to determine the flow rate escaping the pick/vent hole. Multiply the flow rate times the number of holes that are discharging wastewater. Once the total volume (gpm) has been determined, multiply the gpm by the duration of the SSO in minutes. This will result in the total estimated gallons of the SSO.

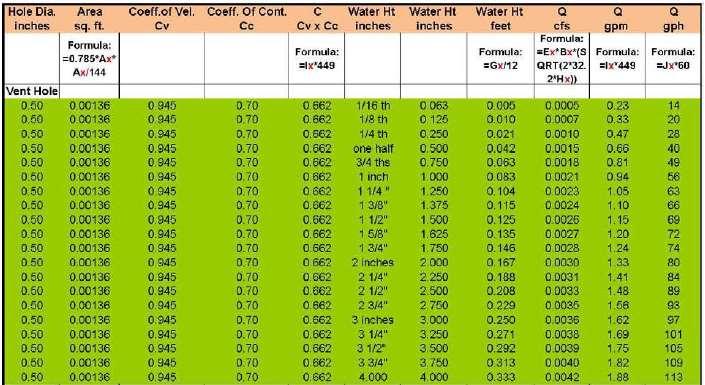
23 Vent Hole Method ½ Vent Hole Chart

24 Vent Hole Method ¾ Vent Hole Chart
25 Vent Hole Method Example: Measured height of plume exiting pick/vent hole is 1 inch from a ½-inch vent hole and there are 4 vent holes. The total volume per minute would be.94 gpm per hole (from attached chart) or 3.76 gpm total (.94 gpm x 4 holes) from the manhole cover. If the SSO lasted one hour, the total wastewater lost would be 226 gallons (3.76 x 60 = 225.6). Number of pick holes 4 Flow from each pick hole.94 gpm Duration of SSO 60 minutes Total SSO volume (.94 x 4 x 60=225.6) 226 gallons
26 Measured Volume 1. Sketch the shape of the contained wastewater. 2. Measure or pace off the dimensions. 3. Measure the depth at several locations and select an average. 4. Convert the dimensions, including depth, to feet. 5. Calculate the area: Rectangle: Area = length (feet) x width (feet) Circle: Area = diameter (feet) x diameter (feet) x 3.14 divided by 4 Triangle: Area = base (feet) x height (feet) x Multiply the area (square feet) times the depth (in feet) to obtain the volume in cubic feet. 7. Multiply the volume in cubic feet by 7.48 to convert to gallons
27 Measured Volume
28 Measured Volume
29 Combo Truck Recovery When the spill is contained to a specific area and recovered by a combo or vacuum truck, the amount recovered can be used in calculating the amount of the original spill. If the spill is contained on a hard surface, estimate the total spill volume by what was captured by the combo or vacuum truck plus the amount that could not be captured. To estimate the amount not captured by the combo or vacuum truck, use the Measured Volume Method. For wet spots on concrete, use a depth of ft. or 1/64 inch. For wet stains on asphalt, use a depth of ft. or 1/32 inch.
30 Conversion Factors 1.0 cfs =.6463 mgd One cubic foot of water (cf) = 7.48 gallons One cubic foot of water per second (cfs) = gallons per minute A cylinder 1 foot in diameter and one foot deep = 5.87 gallons A 1 square foot triangle 1 foot deep = 3.25 gallons One inch or 1/12 ft =.083 feet
31 Shelly Lake Example Based on flow monitor data (up and downstream) 1.5MGD x 4 days +1 MGD x days
32 Pylon Drive Example

33 Dustin M. Tripp