Projection of future drought conditions in Europe and N. America using the relative drought indices and multiple GCMs
|
|
|
- Winfred Sullivan
- 5 years ago
- Views:
Transcription
1 Projection of future drought conditions in Europe and N. America using the relative drought indices and multiple GCMs M. Dubrovsky (1), M. Hayes (2), M. Trnka (3), M. Svoboda (2), D. Wilhite (2), Z. Zalud (3), D. Semeradova (3) (1) Inst. Atmos. Physics, Academy of Sciences of CR, Prague, Czech Rep. (2) National Drought Mitigation Center, School of Natural Resources, University of Nebraska, Lincoln, USA (3) Inst. for Agrosystems and Bioclimatology, Mendel Univ. of Agriculture and Forestry, Brno, Czech Rep. acknowledgements: The study is supported by the National Agency for the Agricultural Research (project QG60051) and the AMVIS-KONTAKT project (ME 844).

2 a) physical drought types: 4 types of drought meteorological (climatological): absence or reduction of precipitation can develop quickly and end abruptly agricultural: dryness in the surface layers, which occurs during the growing season and thereby reduces crop yields. (The onset of A.D. may lag that of a M.D., depending on the prior moisture status of the surface soil layers) hydrological drought: Precipitation deficits over a prolonged period that affect surface or subsurface water supply, thus reducing streamflow, groundwater, reservoir, and lake levels b) socioeconomic drought: result of the 3 above drought types
3 drought indices ( = common way for quantifying the drought) e.g. PDSI, PHDI, Z-index, SPI, CMI, NDI (= NOAA drought index),... Drought Monitor (hosted by NDMC) (see, e.g., Heim 2002 for the review of indices; Quiring 2003] here we use: PDSI (Palmer Drought Severity Index) Z-index ( by-product of PDSI) why? because they reflect both temperature and precipitation conditions - in contrast with, e.g., SPI) Z-index may indicate changes for individual seasons
 PDSI-based drought intensity: based on 2-layer soil water balance model input: PREC and TEMP (monthly, weekly) available soil water content latitude")
4 PDSI (Palmer Drought Severity Index) developed by Palmer (1965) most prominent drought index (... though sometimes criticized for its complexity) PDSI-based drought intensity: based on 2-layer soil water balance model input: PREC and TEMP (monthly, weekly) available soil water content latitude good proxy of surface moisture conditions and streamflow (Dai, 2004) self-calibrated 2 nd / 98 th percentiles correspond to / +4.00
5 present modification to PDSI scpdsi = self-calibrated PDSI (previous version) is applied on the single weather series: input series is used for PDSI calibration the PDF of PDSI is about the same for each input series and therefore one can hardly use scpdsi to study impact of climate change, or to compare stations rpdsi = relative PDSI (present version): step 1: PDSI is calibrated using a learning series (reference station/period) step 2: PDSI applied to a series, which is generally different from the learning series
6 the relative drought indices allow between-stations comparison of drought conditions learning series = reference station (or aggregate of more stations) second series = any other station to be compared with the reference station assessing impact of the climate change: learning series = weather series representing present climate second series = weather series representing future climate

7 PDSI: self-calibrated vs. relative notes: rpdsi and scpdsi go quite well in parallel spin-up first 5 years were dismissed from the analysis PDSI exhibits no annual cycle we use Z-index to distinguish seasonal effects
8 application of PDSI & Zindex to GCM-simulated monthly surface TEMP + PREC series
9 application of PDSI & Z-index to GCM-simulated monthly TEMP + PREC series - outputs from 7 GCMs (SRES-A2 runs; IPCC-TAR data): A: CSIRO C: CGCM2 E: ECHAM4/OPYC3 G: GFDL-R30 H: HadCM3 J: CCSR/NIES N: NCAR-PCM - PDSI model was run - for GCM grids (within 66.5S,66.5N) - 2 future periods: , learning series:
10 HadCM3 example:
; HaDCM3 / SRES-A2 annual winter")
11 climate change scenario ( ) vs. ( ); HaDCM3 / SRES-A2 annual winter summer
; http://www.ngdc.noaa.gov/seg/cdroms/ged_iia/datasets/a12/wr.")
12 soil water holding capacity (1º x 1º map) source: texture-based potential storage of water developed by Webb et al. (1993); the gridded data were upscaled into the rougher GCM resolution

 - - - average")

13 future drought conditions according to HadCM3 / SRES-A2 ( ) vs. ( ) average values of the drought indices PDSI Z-index winter summer PDSI categories:
 vs.")

14 future drought conditions according to HadCM3 / SRES-A2 ( ) vs. ( ) percentage of drought month PDSI Z-index annual winter summer drought month = month within drought spell drought spell: [PDSI< -1] AND [min(pdsi)<-3]
15 ... but the scenarios derived from different GCMs differ (note, that HadCM3 appears to provide the most extreme scenario for the Mediterranean region)


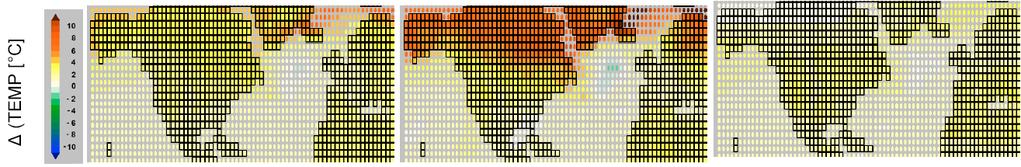

16 year winter summer A C E G H J N TEMP - ( ) vs ( )


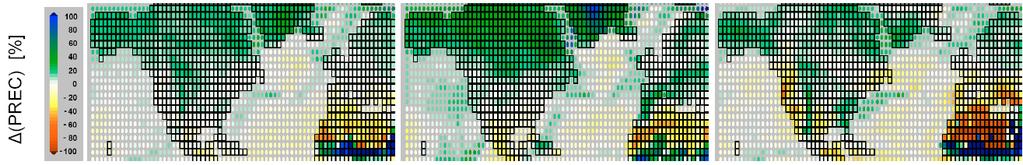

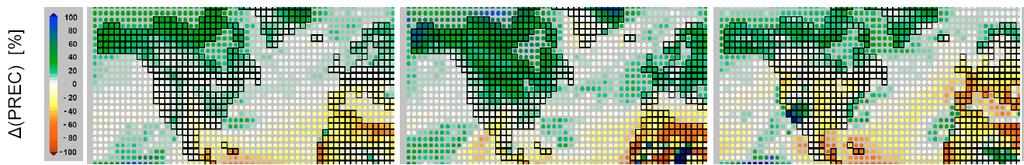
17 year winter summer A C E G H J N PREC - ( ) vs ( )
18 combining information from 7 GCMs
 median( T) - squares and circles [ std( T) 0.")
19 combining information from 7 GCMs results obtained with each of 7 GCMs are re-gridded into 1x1º resolution prec - summer median and std from the 7 values in each grid box are derived and shown in the figures colour = median value from 7 GCMs shape of symbol = uncertainty: Q = std( T) median( T) - squares and circles [ std( T) 0.5 * median( T) ] indicate that T differs from 0 at significance level higher than 95% (roughly) - 4-point stars indicate high uncertainty [ std( T) > median( T) ]
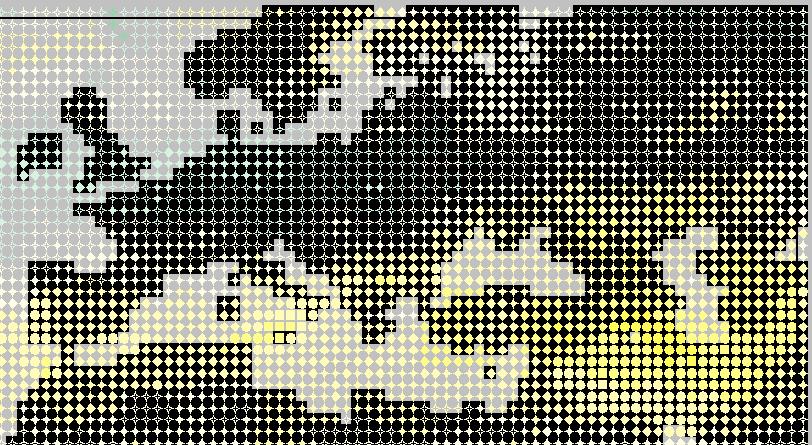
20 7 GCMs - - climate change scenario Europe - -


21 T - winter 7 GCMs: TEMP ( ) vs ( ) T - summer T - year
 prec -")
22 7 GCMs: PREC ( ) vs ( ) prec - year
 vs")


23 7 GCMs: PREC ( ) vs ( ) prec - spring prec - autumn prec - summer prec - winter
24 7 GCMs - - drought indices in ( ) Europe - -

25 avg(pdsi) :: (7 GCMs)


26 avg(z-index) :: (7 GCMs) spring (MAM) autumn (SON) summer (JJA) winter (DJF)
27 7 GCMs - - drought indices in ( ) Europe - -

28 avg(pdsi) :: (7 GCMs)


29 avg(z-index) :: (7 GCMs) spring (MAM) autumn (SON) summer (JJA) winter (DJF)
30 7 GCMs - - drought indices in ( ) N.America + Europe + N.Africa - -
 vs.")
31 7 GCMs :: avg(pdsi) :: ( ) vs. ( )
 SON - 2070-2099 avg(z) DJF - 2070-2099")
32 avg(z) MAM avg(z) JJA avg(z) SON avg(z) DJF
33 CONCLUSIONS relative drought indices (PDSI and Z-index) used for assessing impact of the climate change on future drought conditions results from 7 GCMs were put together to make a probabilistic forecast of the future drought conditions: TEMP: good inter-gcm fit PREC: high inter-gcm uncertainty changes in avg(pdsi) and avg(z-index): PDSI: annual changes; Z-index: changes in seasons regions / seasons: Mediterranean (esp. Italy, Balkan, Turkey in summer) central Europe in autumn uncertainty for larger than for , but quite good inter-gcm fit for the above regions/seasons future: what is now extreme drought may become normal
34 E N D