Table of contents. 4. Review and discussions of ICS and TCS Data 14
|
|
|
- Austin Randell Stewart
- 5 years ago
- Views:
Transcription

1 1
2 Table of contents Page Abbreviations and Acronyms 3 Executive Summary 4 1. Background 8 2. Methods Sampling design and sample collection Location of monitoring sites Air sampling time and location of monitor Ambient air monitoring PM and BC collection and measurement Meteorological condition Results PM data and validity check Review and discussions of ICS and TCS Data Findings from kitchen having ICS Findings from kitchen having TCS Comparison between ICS and TCS Conclusion Acknowledgement References 19 Annex- I: Terms of Reference for the work 20 Annex- II: Sampling design for IAP measurements using ICS 22 Annex- III: Data collection for IAP monitoring 24 Annex- IV: Information on sampling Households and measured IAP data 26 Annex- V: Quality checks for PM 10 and PM 2.5 Data 35 Annex- VI: T-test for data from the HHs with ICS and TCS for the significance of difference between the two sets 39 2
3 Abbreviations and Acronyms AECD Atomic Energy Centre, Dhaka BC Black Carbon BNNAQS Bangladesh National Ambient Air Quality Standards CCT Controlled Cooking Test CO Carbon Monoxide EPA Environmental Protection Agency (US) FRM Federal Reference Method (USEPA) HH Household IAP Indoor Air Pollution ICS Improved Cook stove IWA International Workshop Agreement Lpm Liters per minute PM 2.5 Particulate Matter with aerodynamic diameter less than 2.5µm PM 10 Particulate Matter with aerodynamic diameter lee than 10µm QA/QC Quality Assurance and Quality Control SLCF Short-lived Climate Forcers TCS Traditional Cook stove WBT Water Boiling Test WHO World Health Organization 3
4 Executive Summary Background In order to reduce exposure to Indoor Air Pollution (IAP) and household (HH) fuel consumption reduction, IDCOL has taken the program for ICS dissemination. The objective of the present study is to quantify the reduction, if any in the IAP levels in actual HHs with the introduction of ICS in the HHs. The work involves collections of PM (PM 2.5 and PM 10 ) samples, CO levels from kitchens having ICS and as well as traditional cook stoves (TCS). Initially, the IDCOL ICS program was started with IWA Tier-I ICS; but new higher efficiency Tier II and higher Tier models are being disseminated now. Under this program, about one million ICS of Tier-I & II category were installed as of January, All of the ICS models disseminated were tested to assess efficiency, emission and Indoor Air Pollution parameters using WBT (Water Boiling Test) and CCT (Controlled Cooking Test). These test are designed for the characterization of ICS performance by limiting variability associated with different parameters which impact IAP levels. However, the performances of the stoves in users kitchens vary from test performance in the laboratory due to variation in cooking habits and environments. Hence, the present study has been undertaken on the quantification of IAP levels in households both with ICS and TCS during March, As the ICS households were randomly chosen, some of the HHs had ICS models with and some others had portable models without. Data collection and Methodologies The IAP levels can t be measured with great accuracy, because of various inherent uncertainties involved such as weather, type of fuel used, dryness of fuel, room size, ventilation, quantity of food cooked and even the person involved in using the ICS etc. For quantifying the difference in the levels of IAP for households, it is necessary to determine how many households should be selected to ensure that the populations of households with and without ICS are properly represented. To this end a sampling design has been done to determine the optimal sample size; so that data obtained will be statistically significant at reasonable cost of monitoring. The households were selected on random basis in selected areas. In order to limit the data variability due to variation in the kitchen parameters (i.e. room size, ventilation etc.), attempt was made to choose similar kitchen size households as far as practicable. PM samples (PM 10, PM 2.5 ) were collected on 47 mm diameter Teflon filters using portable (Air Metrics MiniVol) samplers, which were programmed to sample at 5.0 lpm for proper size fractionation. Air Metrix samplers are high quality instrument which have performance nearly equivalent to USEPA FRM samplers. The reflectivity measurements of the PM 2.5 samples provided the BC data. The CO levels were measured by using a calibrated Gas monitor (EAGLE TM Model) with electrochemical sensor. 4
5 The samples were collected from households in in three villages Mazirdia, Melartak, and Pahariartak in Koundia. HHs from Mazirdia was finally selected IAP measurements for ICS HHs. In the village of Melartak, Pahariartak still largely traditional cook stoves are used and these villages were chosen for the measurement of IAP levels in HHs with TCS. The sampling campaigns were conducted during March, Samples were collected from 30 HHs each type having ICS and TCS. The samplings were done for 24h (started at 8 am and stopped at 8 am in the next day) for PM. Each day 5 HHs were sampled (Five PM 10 and five PM 2.5 samplers used). The CO was monitored from each kitchen during cooking periods. The concentrations of black carbon (BC) in the fine fraction of the samples were determined by reflectance measurement of PM 2.5 samples using an EEL-type Smoke Stain Reflectometer. The ambient air quality data were obtained from a monitoring at the Atomic Energy Centre, Dhaka (AECD) which is an urban semi-residential area. As the ambient AQ data is from a semiurban location, actual values are probably somewhat lower in the sampling areas. However, these data have been used in the absence of local data, to get the net contributions for HHs with ICS and TCS; although not being accurate. The data were collected during March, 2017 which is in pre-monsoon season and the weather was mostly dry with a few spells of occasional rain. The temperature was between o C, average humidity was around 60% and the wind speed was low being <2 m/s. Results The data obtained from the measurements were checked for validity using statistical analysis and were considered satisfactory. The measured levels of IAP data are summarized in table ES1 below along with ambient data. Table ES1: PM 10, PM 2.5, BC, CO concentrations and their ratios during study period Category Parameter PM 10 PM 2.5 BC CO µg/m3 ppm PM 2.5 /PM 10 BC/PM 2.5 Mean STD TCS Median Min Max Mean STD ICS Median Min Max Ambient Mean <
6 STD < Median < Min < Max < The T-tests were done between the two groups of data sets (i.e., for ICS and TCS) in order to check the significance of the difference obtained between the data sets. During T-test, the significance level of α = 0.05 (i.e., 95% confidence level) was used. From T-test, it has been found that that traditional stove (TCS) emit statistically significant higher PM 10, PM 2.5, BC as well as CO, than the improved cook stoves (ICS). Discussions of ICS and TCS Data and conclusions The table ES2 shows the median values which provide better central measure of the data sets; as the data sets have some outliers and are not exactly normally distributed. The decrease in the median PM 10 and PM 2.5 values are found to be 73 and 48 (µg/m3) respectively for the Households with ICS compared to Households with TCS. The decrease in the CO level in ICS HHs is 98 ppm which is almost 90% lower from the TCS households. Table ES2: Difference in the measured median IAP levels in the households with ICS and TCS Parameter TCS ICS Difference Ambient levels BNNAQS PM 10 (µg/m3) (24h) PM 2.5 (µg/m3) (24h) BC (µg/m3) CO (ppm) (8h) The conclusions from the findings of the present study are listed in the following with observations. (i) The IAP levels are lower for all pollutants (PM 10, PM 2.5, BC, CO) in HHs with ICS compared to HHs with TCS. The differences are statistically significant at 95% confidence level as determined by t-tests. The lesser pollution levels in ICS HHs will translate to better health outcomes for the members of the HHs. However, the levels of IAP even in ICS HHs are much higher than the BNNAQS. (ii) The median concentration values for PM 10 and PM 2.5 have been found to be 73 and 48 (µg/m 3 ) respectively lower for the Households with ICS compared to Households with TCS. The decrease in the CO level is 98 ppm which is almost 90% lower from the TCS households. These findings mean that the fuel combustions in ICS are more efficient in ICS compared to TCS. 6
7 (iii) It has been observed that the double mouth ICS has relatively lower PM 2.5 /PM 10.. Ratio. This type of ICS has also higher efficiency and probably better combustion with more oxygen supply leading to burning of a greater fraction of PM 2.5 particles. It is also been observed that wood fuel leads to lower PM 2.5, indicating that this is better fuel for lowering fine particle pollution. (iv) It has been observed that the PM concentration levels are rather similar within statistics for HHs with different types of ICS. This is a bit surprising, as one would expect the kitchens with ICS would have lower IAP levels. This counter intuitive finding may be due to inter-household spread of IAP; as the sampling area has high household concentration. This finding indicates that total ICS coverage of a given area will lead to lower IAP concentration in all HHs. (v) It has been observed that the net median BC level (i.e., after subtraction of ambient level) is reduced by about 45% in ICS households compared to TCS households. Although, health impacts of black carbon (BC) is captured in the PM 2.5, monitoring of BC was included in this work; as it has been identified as one of the short-lived climate forcers or SLCFs; which are pollutants that reside in the atmosphere for a short time. Despite being short-lived, BC has been identified as a significant influence on the climate system, especially on regional and local scales. Being short lived, mitigating black carbon can be achieved in the near term and this mitigation can contribute to mitigation of climate change and its impacts. The significantly less level of BC for the ICS HHs, indicate that ICS replacement for TCS is a good approach for mitigation measure for SLCF. 7
8 A study on Indoor Air Pollution Levels in Households with Improved and Traditional Cook stoves 1. Background Burning biomass in traditional stoves, leads to emission of smoke containing large quantities of harmful particulate matter and other gaseous pollutants. This smoke pollution is often aggravated by limited ventilation of kitchens in rural Bangladesh. Recent Studies have shown that indoor air pollution levels from combustion of biofuels are quite variable and can be extremely high; often much higher than the standards for ambient air pollution and guidelines provided by World Health Organization (WHO). Typically 24-hours mean levels of PM 10 (small particles less than 10 microns diameter) in households using biofuels may range from 300 to 3000 µg/m 3 depending on the type of fuel, stove, and kitchen types, amount of food cooked and ventilation level [1]. Concentration levels measured depend on where and when monitoring takes place, given that significant temporal and spatial variation (within a house i.e. kitchen and room near and far), may occur. The small particles especially PM 2.5 is able to penetrate deep into the lungs and have the greatest potential to cause health problems. There is consistent evidence that exposure to biomass smoke increases the risk of common and serious diseases of both children and adults. Air pollution aggravates respiratory symptoms, acute lower respiratory infection (ALRI) in childhood and pneumonia. Chronic bronchitis (assessed by symptoms) and, chronic obstructive pulmonary disease (assessed by spirometry and clinical assessment) are also believed to be associated with the PM exposure. From a policy standpoint, although it is health risks that drive policy concern, there is a need for good proxy indicators to guide and facilitate action to mitigate Indoor Air Pollution (lap). Diseases have multiple causes; and it is often difficult, lengthy, and costly to conduct a careful observation and analysis necessary to discriminate that part of disease due to indoor air pollution and not to other confounding factors, such as malnutrition and smoking. As a result, it is useful to develop ways of determining population exposure - a measure combining the number of people, the concentration of pollution, and the amount of time spent breathing it, as an indicator of where the health risks are likely to be. Determining population exposure will not only improve estimates of the overall impact of indoor air pollution, but also help better target policy interventions. Considering the health hazard, government has adopted policy to distribute the improved cook stoves in rural household where the IAP levels are high. In order to reduce exposure to IAP and household (HH) fuel consumption reduction, IDCOL has taken the program for ICS dissemination. The objective of the present study is to quantify the reduction in IAP levels in actual HH level with the introduction of ICS in the HHs. The work 8
9 involves collections of PM (PM 2.5 and PM 10 ) samples, CO levels from kitchens having ICS and as well as traditional cook stoves. The present work has been undertaken under a contract with IDCOL with a given Terms of Reference (TOR), which is provided in annex-i of this report. The proposed objective of the TOR is the determination of the difference in the levels of exposure to Indoor Air Pollution between households with and without ICS (Improved Cook stoves). The IAP Parameters to be measured are PM 2.5, PM 10, Back Carbon and CO. Initially ICS program was started with IWA Tier-I ICS; but new higher efficiency Tier II models are being disseminated now. Under this program, about one million ICS of Tier-I & II category were installed as of January, All of the ICS models were tested to assess efficiency, emission and Indoor Air Pollution parameters using WBT (Water Boiling Test) and CCT (Controlled Cooking Test). These tests are designed for the comparison of ICS performance by limiting variability associated with different parameters discussed above on the IAP levels. However, the performances of the stoves in users kitchens vary from test performance in the laboratory due to variation in cooking habits and environments. Hence, the present study has been undertaken on the quantification IAP levels in households both with ICS and TCS during March, As the ICS households were randomly chosen, some of the HHs had ICS models with and some others had portable models without. 2. Methods 2.1 Sampling design and Sample collection The IAP levels can t be measured with great accuracy, because of various inherent uncertainties involved such as weather, type of fuel used, dryness of fuel, room size, ventilation, quantity of food cooked and even the person involved in using the ICS etc. For quantifying the difference in the levels of IAP for households as explained earlier, it is necessary to determine how many households should be selected to ensure that the populations of households with and without ICS are properly represented. Determination of sample size is a very important issue because samples that are too large may waste time, resources and money, while samples that are too small may lead to inaccurate results as these may not be representative of the whole population. In many cases, we can easily determine the minimum sample size needed to estimate a process parameter, such as the mean level of a pollutant. It has been assumed that the IAP values are normally distributed and individual measurements may have uncertainties (sigma) around 15%. With such uncertainties, it is good even if one gets an error (E) of around 5% (i.e., difference between the sample and population mean). With these assumptions, the required number of samples (N) is shown to be about 35. In actual case sigma and E may vary somewhat, so sample size of about 30 should be good enough. In practice, the variation in data can be higher than the assumed uncertainties due to variation in the household parameters (i.e. room size, ventilation etc.). So, some degree of control was exercised to choose similar households as far as practicable. The detail of sampling design is described in annex- II. 9
10 PM samples (PM 10, PM 2.5 ) were collected on 47 mm diameter Teflon filters using portable (Air Metrics) samplers, which were programmed to sample at 5.0 pm for proper size fractionation. Air Metrix samplers are high quality instruments; which have performance nearly equivalent to USEPA FRM samplers. Two samplers (i.e., one each for PM 10 and PM 2.5 ) were positioned in each kitchen with air intakes at breathing level height (i.e., 2.5 ft above the floor). Appropriate QA/QC protocol was followed during sampling and mass measurements. Quality assurance of the sampling was ensured by using appropriate laboratory and field blanks. The sampling protocol was every day starting from 3 March to 15 March, After sampling, the filters were brought to the conditioned weighing room of the AECD laboratory directly from the sampling site for equilibration and PM mass measurement. Care was taken in transporting the exposed filters, so that there should be no PM loss. The reflectivity measurements of the sample provided the BC data. The CO levels were measured by using a Gas monitor (EAGLE TM Model) with electrochemical sensor. The calibration of the meter was checked periodically using calibrated gas traceable to NIST. More details on the equipment utilized are provided in annex- III. 2.2 Location of monitoring sites As IDCOL has distributed ICSs to households in Koundia, Amin Bazar, Dhaka, three villages Mazirdia, Melartak, and Pahariartak in Koundia were initially selected for IAP measurements for HH with and without ICS. Among three villages, 100% HHs in Mazirdia use ICS for cooking. In Melartak and Pahariartak, only 8 to 10% houses use ICS and 80% villagers use traditional cook stoves and LPG for cooking. In order to save LPG, the villagers use traditional cook stoves for preparation of their lunch. Hence, HHs from Mazirdia was finally selected IAP measurements for ICS HHs. In the village of Melartak, Pahariartak still largely traditional cook stoves are used, and these villages were chosen for the measurement of IAP levels in HHs with TCS. The GPS location of the measurement areas and the monitoring parameters are given in Table 1. Table 1: Location of the IAP monitoring Sites Village Lat/Lon Monitoring Parameter Mazirdia Melartak Pahariartak 'N~ 'N 'E~ 'E 'N~ 'N 'E~ 'E 'N~ 'N 'E~ 'E PM 10, PM 2.5, BC, CO PM 10, PM 2.5, BC, CO PM 10, PM 2.5, BC, CO 10
11 2.3 Air sampling time and location of monitor PM 10 and PM 2.5 were monitored from kitchens at Mazirdia, Melartak, and Pahariartak in Koundia from March, We have selected 30 houses using ICS and collected 30 pair of samples (One is PM 10 and other is PM 2.5 ) from each house. There is a river in the south of Marzirdia village and lots of small rivercrafts run on the river. Hence, during the selection of sampling HHs, the houses near river side were not chosen for sampling. We have collected also 30 pairs of samples (One is PM 10 and other is PM 2.5 ) from kitchen having traditional cook stoves. In each kitchen, two Air Metrics portable samplers were placed for PM 10 and PM 2.5 samples. The samplings were done for 24h (started at 8 am and stopped at 8 am in the next day). We have collected 10 samples (Five PM 10 and five PM 2.5 ) from five kitchens every day. The CO was monitored from each kitchen when the housewife started cooking. 2.4 Ambient air monitoring Sampling was performed at semi-residential site in Dhaka using a Gent stacked filter sampler which capable of collecting air particulate samples in coarse ( µm) and fine (2.2 µm,) size fractions. The sampler was placed on the flat roof of the Atomic Energy Centre, Dhaka (AECD) campus building. The roof height was 5 m and the intake nozzle of the sampler was located 1.8 m above the roof. The intake was about 80 m away from the roadside. The sampler was placed so that the airflow around it was unobstructed. This site has been operated since the mid-1990s and continues to be operated. The sampling is being done twice in a week during weekdays. The sampling procedure, measurements of mass and BC have been described elsewhere[5]. The ambient AQ data is not from the sampling area and from a semi-urban location. So, the values are probably somewhat in the sampling area. However, these data are being used here, in the absence of local data to get the net contributions for ICS and TCS, although not being accurate. 2.5 PM and BC sample collection and measurement PM sampling was done using Air Metrics MiniVol sampler which was developed jointly by the U.S. Environmental Protection Agency (EPA) and the Lane Regional Air Pollution Authority. Although, not listed in the reference sampler (FRM) list, it is very close to reference sampler in performance. For sampling with Mini Vol samplers, the flow rate was maintained at 5 liter per minute (lpm) for proper size fractionation. The samplers were set up in the conventional manner with filters. Two samplers were placed at co-located position in the kitchen for 24h. Both fractions of PM samples were collected on Teflon (2.0 µm pore size) filters. PM masses were measured in the Chemistry Division of the Atomic energy Centre, Dhaka (AECD) laboratory. The aerosol samples having PM were determined by weighing the filters before and after exposure using a micro balance (METTLER Model MT5) by maintaining room temperature approximately at 22 C and relative humidity at 50%. The air filters were 11
12 equilibrated at constant humidity and temperature of the balance room before every weighing. A U-shaped electrode charge eliminator (STATICMASTER) was used to eliminate the static charge accumulated on the filters before each weighing. The difference in weights for each filter was calculated and the mass concentrations for each PM 10 or PM 2.5 samples were determined. The concentration of black carbon (BC) in the fine fraction of the samples is determined by reflectance measurement using an EEL-type Smoke Stain Reflectometer [6]. Secondary standards of known black carbon concentrations are used to calibrate the Reflectometer. The CO was monitored sequentially at each kitchen using Gas monitor (EAGLE TM Model). 2.6 Meteorological Conditions In Bangladesh, the climate is characterized by high temperatures and high humidity for most of the year, with distinctly marked seasonal variations in precipitation. According to meteorological conditions, the year can be divided into four seasons, pre-monsoon (March-May), monsoon (June-September), post-monsoon (October-November) and winter (December-February) [7]. The winter season is characterized by dry soil conditions, low relative humidity, almost no rainfall, and low north-westerly prevailing winds. The rainfall and wind speeds become moderately strong and relative humidity increases in the pre-monsoon season when the prevailing direction changes to south-westerly (marine). During the monsoon season, the wind speed further increases and the air mass is purely marine in nature. In the post-monsoon season, the rainfall and relative humidity decreases, as does the wind speed. The wind direction starts shifting back to north-easterly [8]. The dispersion of PM strongly depends on the wind speed and direction [9]. We have collected samples during pre-monsoon season. The data were collected during March, 2017 which is in pre-monsoon season and the weather was mostly dry (with a few spells of rain). The temperature was between o C, average humidity was about 60% and the wind speed was low being <2 m/s. 3. Results In this section, data obtained from the measurements are presented with discussions on the validity checks. The sampling plan for the measurement was made based on the assumption that data are likely to be normally distributed. Checks have been made to see how the results bear out this assumption. Given the level of emissions from fuel use, type of cook stoves, the particulate matter concentrations in a space depends on the length of time the emitted particles remain in the space, as well as ambient (outdoor) concentration. The extent and duration of particles in the kitchen and amount of particle leaking from kitchen to the outdoor may depend on several structural factors: the location of the kitchen, the extent of ventilation and the permeable nature of materials used to construct the roof and walls of the kitchen. 12
13 3.1 PM data and validity check As the PM samplings were done in the kitchen for 24hour, there were also the contributions of ambient PM together with emission from cooking stoves (annex-iv). The frequency distribution for PM 10 and PM 2.5 data for ICS and TCS measurements were calculated and plotted in Figures 1&2 respectively. The distributions are fairly normal looking with some outliers. This is not unexpected as there are many variables which impact PM levels as explained earlier. Frequency PM Frequency PM Figure 1: Frequency distribution for PM 10 and PM 2.5 for HH with ICS PM PM Figure 2: Frequency distribution for PM 10 and PM 2.5 for HH with TCS The mean, standard deviation and median values of PM and BC concentrations for ICS, TCS and ambient respectively were presented in Table 2. The ambient PM concentrations were taken from semi-residential site, AECD, Dhaka University campus. In order to reject the outliers, the data were plotted data values against HH number as shown in annex-v. The data points which fall beyond the 3-standard deviation were rejected for the calculation of mean, standard deviation 13
14 values of PM and BC concentrations in households with ICS, TCS. The measured levels of IAP level data are summarized in Table 2. Table 2: PM 10, PM 2.5, BC, CO concentrations and their ratios during study period Category Parameter PM 10 PM 2.5 BC CO PM 2.5 /PM 10 BC/PM 2.5 µg/m3 ppm Mean STD TCS Median Min Max Mean STD ICS Median Min Max Mean < STD < Ambient Median < Min < Max < Review and discussions of ICS and TCS Data Detail information on the households with ICS and TCS are given in annex-iv. The concentrations of PM and BC also depend on types of ICS, fuel, construction materials of kitchen and as well as kitchen configuration. The PM concentrations have been found to be similar in case double mouth ICS with respect to portable metallic ICS using same fuel (Table 2 in annex-iv). It was found that kitchen having roof with side walls and door have high PM and BC than the kitchen having open sides. The CO levels are reduced by almost 90% in the households with ICS compared to households with traditional stoves. 4.1 Findings from kitchen having ICS The efficiency of ICS installed in the sampling areas were measured in the laboratories in BUET or in VERC[10]; the efficiency of the ICS s reported here were from these measurements. During laboratory experiments, only a specific type of wood was used as fuel. But in the field level, people use different types of fuel depending on availability and their purchasing capacity. 14
15 In Marzirdia, Melardia or in Pahariardia, most of the people are boats men; a few are carpenters or fishermen or some stay abroad in foreign countries. During the study, it was found that people use sawdust initially to initiate the fire and use other fuel for most part of the cooking. Some people use only sawdust as they are carpenters. In Mazirdia, almost 100% people are using ICS and they use ICS all the time when they need cooking. Table 1 shows the GPS location for the study sites. Most of the kitchen selected had room size 9"-10" by 7"-8" with roof height of 6 to 7 feet. During the field experiment, three types of ICS were found. These were double mouth with, Portable metallic single mouth and Single mouth with. There were a lot of variability and difficult to control all those variabilities. Hence we have rejected those data which are more than 3 STD (annex-v). The net contribution (i.e., with ambient levels subtracted) of each type of stove is presented in Table 3. Table 3: The net Concentrations of PM 10, PM 2.5 and BC in case of ICS Type of Stove Total Number PM 10 PM 2.5 BC µg/m3 Double Mouth with Chimney ±20 155±20 19±3 Portable Metallic Single Mouth ±21 151±18 19±3 Single Mouth with Chimney It can be seen the PM concentration levels are rather similar within statistics for different types of ICS. This is a bit surprising; as one would expect the kitchens with ICS would have lower IAP level. This counter intuitive finding may be due to inter-household spread of IAP as the sampling areas have high household concentration. This finding indicates that total ICS coverage of a given area will lead to lower IAP concentration in all HHs. The PM 2.5 /PM 10 or BC/PM 2.5 ratios for ICS HHs are shown in Table 4. It can be seen that the double mouth ICS has relatively lower PM 2.5 /PM 10. This type of ICS has higher efficiency and probably better combustion with more oxygen supply leading to burning of a greater fraction of PM 2.5 particles. It is also seen that wood fuel is leads to lower PM 2.5 indicating that this is a better fuel for lowering fine particle pollution. The PM 2.5 /PM 10 being around 0.7 show that about 30% of the PM by mass belong to coarse fraction (i.e., PM PM 10 ) contrary to popular belief that most of PM produced by ICS are PM 2.5 particles. 15
16 Table 4: Comparison of PM 2.5 /PM 10, BC/PM 2.5 ratios and CO with respect to Fuel type in case of ICS HH. PM 2.5 /PM 10 BC/PM 2.5 CO Type of Stove Fuel type No ratio ratio ppm 10 Double Mouth with Chimney Wood and saw dust 0.72± ± ± Double Mouth with Chimney Saw dust and tree leaves 0.75± ± ± Double Mouth with Chimney Wood 0.55± ± ± Portable Metallic single Mouth Wood and saw dust 0.74± ± ± Portable Metallic single Mouth Portable Metallic single Mouth 1 Single Mouth with Chimney Wood Saw dust Wood and saw dust 0.61± ± ± Findings from kitchen having TCS In Melardia and Pahariardia villages 80% of the HHs have traditional cook stoves. People in these villages use traditional cook stoves for cooking. But the solvent people use LPG for making their breakfast and during daytime they use traditional cook stoves for cooking lunch (big dishes). Hence, they spend 2 to 3 hours for cooking food during lunch using traditional cookstoves. Table 5 represents the comparison of PM 2.5 /PM 10 and BC/PM 2.5 ratios with respect to fuel at Melardia and Pahariardia having traditional cook stoves. Most of the kitchen size is 9"- 10" by 7"-8" and roof is 6 to 7 feet high. Table 5: Comparison of PM 2.5 /PM 10 and BC/PM 2.5 ratios with respect to Fuel type in case of TCS HH. No Type of Stove Fuel type PM 2.5 /PM 10 ratio BC/PM 2.5 ratio CO ppm 12 Single Mouth Wood and saw dust 0.76± ± ± Single Mouth Wood, tree leaves and Bamboo 0.69± ± ± Single Mouth Wood 0.66± ± ± Single Mouth Saw dust 0.70± ± ±
17 Using wood as fuel, the literature values are between 0.51[1] and 0.64[6] for the ratio of PM 2.5 /PM 10. From the present study, the values are in the range of The CO level are found to be extremely high being about 10 times higher than ICS; indicating poor burning efficiency in the TCS. 5. Comparison between ICS and TCS In the laboratory experiments, it has been observed that the burning efficiency [10] of the ICS are higher than the TCS. The concentrations of PM and BC in the kitchen environment depend on the type of fuel, burning efficiency of kitchen, configuration of kitchen, construction materials of kitchen and times of cooking. As the HHs was chosen on random basis (except for kitchen dimensions) for both types of HHs with ICS and TCS, the variabilities are expected to be similar. The T-tests were done between the two groups of data sets in order to check the significance of the difference between the data sets. During T-test, significance level of α = 0.05 (i.e., 95% confidence level) was used. From T-test, it is found that that traditional stove (TCS) emit statistically significant higher PM 10, PM 2.5, BC as well as CO, than improved cook stoves (ICS). The details of T-test are given in annex- VI. The differences in the measured median IAP levels in the households with ICS and TCS are shown in Table 6. The table shows the median values which provide better central measure of the data sets; as the data sets have some outliers and are not exactly normally distributed. The decrements in the median PM 10 and PM 2.5 values are found to be 73 and 48 (µg/m3) respectively for the Households with ICS compared to Households with TCS. The decrease in the CO level is 98 ppm which is almost 90% lower from the TCS households. The levels of IAP even with ICS HHs are much higher than the BNNAQS. Table 6: Difference in the measured median IAP levels in the households with ICS and TCS Parameter TCS ICS Difference Ambient BNNAQS levels PM10 (µg/m3) (24h) PM2.5 (µg/m3) (24h) BC (µg/m3) CO (ppm) (8h) Although, health impacts of black carbon (BC) is captured in the PM 2.5, monitoring of BC was included in this work; as it has been identified as one of the short-lived climate forcers or SLCFs; which are pollutants that reside in the atmosphere for a short time. Despite being short-lived, BC has been identified as a significant influence on the climate system, especially on regional and 17
18 local scales. Being short lived, mitigating black carbon can be achieved in the near term and this mitigation can contribute to mitigation of climate change and its impacts. It can be seen that net BC (i.e., after subtraction) is reduced by about 45% in ICS households compared to TCS households. 6. Conclusions The conclusions from the findings of the present study are listed in the following with observations. The IAP levels are lower for all pollutants (PM 10, PM 2.5, BC, CO) in HHs with ICS compared to TCS. The differences are statistically significant at 95% confidence level as determined by t-tests. The lesser pollution levels in ICS HHs will translate to better health outcomes for the members of the HHs. However, the levels of IAP even in ICS HHs are much higher than the BNNAQS. The median concentration values for PM10 and PM2.5 have been found to be 73 and 48 (µg/m 3 ) respectively lower for the Households with ICS compared to Households with TCS. The decrease in the CO level is 98 ppm which is almost 90% lower from the TCS households. These findings mean that the fuel combustions in ICS are more efficient in ICS compared to TCS. It has been observed that the double mouth ICS has relatively lower PM 2.5 /PM 10.. ratio. This type of ICS has higher efficiency and probably better combustion with more oxygen supply leading to burning of a greater fraction of PM 2.5 particles. It is also been observed that wood fuel leads to lower PM 2.5, indicating that this is better fuel for lowering fine particle pollution. It has been observed that the PM concentration levels are rather similar within statistics for HHs with different types of ICS. This is a bit surprising as one would expect the kitchens with ICS would have lower IAP levels. This counter intuitive finding may be due to inter-household spread of IAP; as the sampling area has high household concentration. This finding indicates that total ICS coverage of a given area will lead to lower IAP concentration in all HHs. It has been observed that the net median BC level (i.e., after subtraction of ambient level) is reduced by about 45% in ICS households compared to TCS households. Although, health impacts of black carbon (BC) is captured in the PM 2.5, monitoring of BC was included in this work; as it has been identified as one of the short-lived climate forcers or SLCFs; which are pollutants that reside in the atmosphere for a short time. Despite being short-lived, BC has been identified as a significant influence on the climate system, especially on regional and local scales. Being short lived, mitigating black carbon can be achieved in the near term and this mitigation can contribute to mitigation of climate 18
19 change and its impacts. The significantly less level of BC for the ICS HHs, indicate that ICS replacement for TCS is a good approach for mitigation measure for SLCF. 7. Acknowledgement We thankfully acknowledge the IDCOL for financial support for this study. We also thank Village Education Research Center (VERC) and all members of Chemistry Division of AECD for their support. 8. References 1. S. Dasgupta, M. Huq, M. Khaliquzzaman, K. Pandey, and D. Wheeler. Indoor Air Quality for poor families. The World Bank, Development Research Group, Policy Research Working Paper (2004). 2. K. Smith, L. Y, and e. a. J. Rivera. Indoor air quality and child exposures in highland Guatemala, Proceedings of the 6th International Conference on Indoor Air Quality and Climate, University of Technology, Helsinki, 1: (1993). 3. L. Naeher, K. Smith, and e. a. B. Leaderer. Carbon monoxide as a tracer for assessing exposures to particulate matter in wood and gas cookstove households of highland Guatemala,. Environmental Science and Technology. 35, (2001). 4. J. McCracken, R. Albalak, E. Boy, N. Bruce, J. Hessen, M. Schei, and K. Smith. Improved stove or inter-fuel substitution for decreasing indoor air pollution from cooking with biomass fuels in highland Guatemala. Indoor Air. 3, (1999). 5. B. A. Begum, S. K. Biswas, E. Kim, P. K. Hopke, and M. Khaliquzzaman. Investigation of sources of atmospheric aerosol at a hot spot area in Dhaka, Bangladesh. J. Air and Waste Management Association. 55, (2005). 6. B. A. Begum, S. K. Paul, M. D. Hossain, S. K. Biswas, and P. K. Hopke. Indoor air pollution from particulate matter emissions in different households in rural areas of Bangladesh. Building and Environment. 44, (2009). 7. A. Salam, H. Bauer, K. Kassin, S. M. Ullah, and H. Puxbaum. Aerosol chemical characteristics of a mega-city in Southeast Asia (Dhaka, Bangladesh). Atmospheric Environment. 37, (2003). 8. B. A. Begum, P. K. Hopke, and A. Markwitz. Air pollution by fine particulate matter in Bangladesh, Atmospheric Pollution Research, 4, 75-86(2013). 9. B. A. Begum, S. K. Biswas, and P. K. Hopke. Assessment of trends and present ambient concentrations of PM 2.2 and PM 10 in Dhaka, Banglaesh. Air Qual. Atmos. Health. DOI /s ,(2008). 10. B. A. Begum. Comparison of a traditional cook stove with improved cook stoves based on their emission characteristics. Nuclear Science and Applications. 24, 7-9(2015). 11. H. Horvath. Experimental calibration for aerosol light absorption measurements using the integrating plate method-summary of the data. Aerosol Science. 28, (1997). 12. H. Horvath. Comparison of the light absorption coefficient and carbon measures for remote aerosols: An independent analysis of the data from the IMPROVE Network I and II. Atmospheric Environment. 31, (1997). 19
20 Annex- I: Terms of Reference for study on Indoor Air Pollution (IAP) Levels (November, 2016) 1.0 Background: Infrastructure Development Company Limited (IDCOL) with support from the World Bank has undertaken to disseminate one million ICS under IDCOL s ICS Program. The objective of the program is to increase thermal efficiency of the stoves while reducing Indoor Air Pollution (IAP) exposure especially for women and children. The program is operational since August, 2014 and more than 800,000 ICS installed till September, All of the stove models were tested to assess efficiency, emission and Indoor Air Pollution (IAP) parameters before selection under the program. However, the performance of the stoves in user s kitchen might vary from its performance in the lab, due to variance in cooking habits and environments. Therefore, IDCOL is looking for an individual consultant to conduct a study on IAP level in households to assess the level of IAP in both traditional stoves and Improved Cook stoves. 2.0 Objectives: The proposed objective of the study is to determine the difference in the levels of exposure to Indoor Air Pollution between households with and without ICS (Improved Cook stoves). The IAP Parameters to be measured are PM 2.5, PM 10, Back Carbon and CO. 3.0 Scopes of work The Individual Consultant will require completing following tasks: a. Field visits to 30 households with ICS and measuring IAP levels (PM 2.5, PM 10, CO and BC) b. Field visits to 30 households without ICS and measuring IAP levels (PM 2.5, PM 10, CO and BC) c. Using Portable Emission Measurement System (PEMS), IAP meter and CO meters from IDCOL Technical Monitoring Facility for data collection in 4 households for comparing results d. Preparing a report on the findings of the study 4.0 Time Frame The assignment is expected to be carried out over a period of 3 months preferably in the dry season during November 2016 to February Outputs/Deliverables A report on findings of the IAP study consisting detailed results for each households visited, comparison between different stoves, effects of cooking habits and kitchen environments on IAP 20
21 etc. as a standalone document so that it can be read without reference to any other document. The methodologies for IAP study, quality assurance in the implementation of the methodologies are to be provided in the report. For IAP measurement WBT i protocol should be followed and results should be presented in units specified in the protocol so that it could be compared with ISO IWA WBT Tiers. 6.0 Expression of Interest A written expression of interest should be submitted by the individual consultant specifying the activities intended to be taken up and the time schedule. The CV of the professionals to be deployed for the work must be provided. It is required that the professionals proposed should have proven track records in similar work. The proposal should also come with a cost estimate, mentioning cost of IAP measurement per household
22 Annex-II: Sampling design for IAP measurements using ICS Introduction In order to prove that ICS leads to have lower exposure to IAP compared to traditional cook stoves, it is necessary to measure the exposure levels in households with and without ICS. Such measurement allows one to quantify the improvements in IAP levels. For such measurements, it is necessary to determine how many households should be selected to ensure that the populations of households with and without ICS are properly represented. Determination of sample size is a very important issue because samples that are too large may waste time, resources and money, while samples that are too small may lead to inaccurate results. In many cases, we can easily determine the minimum sample size needed to estimate a process parameter, such as the mean level of a pollutant (µ). When sample data is collected and the sample mean ( ) is calculated, that sample mean is typically different from the population mean µ. This difference between the sample and population means can be thought of as an error. The margin of error E is the maximum difference between the observed sample mean and the true value of the population mean : Where: is known as the critical value, the positive value that is at the vertical boundary for the area of in the right tail of the standard normal distribution. is the population standard deviation. is the sample size. Rearranging this formula, we can solve for the sample size necessary to produce results accurate to a specified confidence and margin of error. This formula can be used when one knows and want to determine the sample size necessary to establish, with a confidence of, the mean value to within. One can still use this formula if population standard deviation is not known and the small sample size is small. 22
23 Although it s unlikely that one would know when the population mean is not known, it may be still be possible to determine from a similar process or from a pilot test/simulation. Sample Size Calculation for IAP measurements: Assumed Distribution: Normal Distribution For 95% confidence interval, Z=1.96 The IAP levels can t be measured with great accuracy, because of various uncertainties involved such as weather, type of fuel used, dryness of fuel, room size, ventilation and even the person involved in using the ICS etc. Thus individual measurements may have uncertainties around 15% (i.e., experience from measurements). With such uncertainties, it is good even if one gets an error around of around 5% (i.e., difference between the sample and population mean). So, the values for Sigma and error have been assumed as =15% and error=5%. With these assumptions, the required number of samples (N) is shown to be about 35. In actual case sigma and E may vary somewhat, so sample size of about 30 should be good enough. Two other cases of calculated sample sizes for different and E values are shown in Table-1. Table-1 Number of samples for different cases Case No Z E N
 and the Lane Regional Air Pollution Authority. Although, not listed in the reference sampler (FRM) list, it is very close to reference sampler in performance.")
24 Annex- III: Data collection for IAP monitoring PM and BC Sample collection PM sampling was done using Air Metrics MiniVol sampler (shown in the picture in fig-1) which was developed jointly by the U.S. Environmental Protection Agency (EPA) and the Lane Regional Air Pollution Authority. Although, not listed in the reference sampler (FRM) list, it is very close to reference sampler in performance. For sampling with MiniVol sampler (Figure 1), the flow rate was maintained 5 liter per minute (lpm) at ambient conditions for proper size fractionation. The samplers were set up in the conventional manner with filters. Two samplers were placed at co-located position (i.e., close to one another at breathing height of 60 cm) in the kitchen for 24hour. Both fractions of PM samples were collected on Teflon (2.0 µm pore size) filters. Figure 1: Air Metrics Minivol Sampler Reflectometer for BC Measurements The concentration of black carbon (BC) in the fine fraction of the samples was determined by reflectance measurement by an EEL-type smoke-stain reflectometer. In the reflectometer method, the light from a tungsten lamp passes through the orifice of an annular photocell to project on a well-defined spot on the sample and is transmitted two times through it (i.e., it is also reflected back through the sample to the photocell). In such cases, the coefficient of absorption of particles in the samples (b ap ) can be expressed as 2b ap =In[I o /I] (1) Where I o is incident light intensity and I is reflected light intensity. The BC is responsible for ~30% of the total light extinction and often more than 90% of the absorption by particulate [11]. BC can, therefore, be estimated from the measurement of b ap by 24
![BC=[2b ap /ε]µg/cm 2 --------------------------(2) Where ε is the absorption efficiency in m 2 /g, bap is in µm -1 and BC is in µg/m 2.](/docs-images/89/100335690/images/25-0.jpg "Values of the absorption efficiency ε vary from ~9 to 12 m 2 /g, ut the generally accepted value for dieselassociated carbon C is ε=10 m 2 /g.")
![BC is the major contributor to the absorption efficiency of the fine particles. The minimum detectable limit for the reflectometer is ~0.2 µm -1 which corresponds to a 3% change in [I o /I] in eq.1. This is well below typical measured values.](/docs-images/89/100335690/images/25-1.jpg "Secondary standards (traceable to primary standards from Max Plank Institute in Germany) of known black carbon concentrations were used to calibrate the reflectometer.")
25 BC=[2b ap /ε]µg/cm (2) Where ε is the absorption efficiency in m 2 /g, bap is in µm -1 and BC is in µg/m 2. Values of the absorption efficiency ε vary from ~9 to 12 m 2 /g, ut the generally accepted value for dieselassociated carbon C is ε=10 m 2 /g. BC is the major contributor to the absorption efficiency of the fine particles. The minimum detectable limit for the reflectometer is ~0.2 µm -1 which corresponds to a 3% change in [I o /I] in eq.1. This is well below typical measured values. Secondary standards (traceable to primary standards from Max Plank Institute in Germany) of known black carbon concentrations were used to calibrate the reflectometer. The precision of the BC was estimated to be within 4-9%, depending on the mass load on the exposed filter. The absolute accuracy of the reflectometer system for BC estimates is a little less uncertain, and comparisons of this technique with thermal optical reflectance measurements have been made over the years [12]. CO Monitoring The CO monitoring was done using EAGLE TM model gas analyzer. It has a PID sensor for detecting CO gas from 0 to 500 ppm. The manufacturer is RKI Instruments Inc ( EAGLE (Figure 2) has a strong internal pump with a low flow auto pump shut off and alarm, which can draw samples from up to 125 feet. This allows for quick response and recovery from distant sampling locations. The EAGLE 2 will continuously operate for over 18 hours on alkaline batteries or 20 hours on NiMH. The instrument is calibrated using standard calibration CO gas. There is one CO gas cylinder which contains 50 ppm gas concentration (Figure 3). Figure 2: Gas Analyzer Figure 3: Calibration Gas (CO) 25
26 Annex- IV: Information on sampling Households and measured IAP data The information on the households with and without ICS was given below: Table 1: Information on households with ICS HH No. Type of ICS 1 Double mouth with 2 Double mouth with 3 Double mouth with 4 Double mouth with 5 Double mouth with 6 Potable Metallic 7 Potable Metallic 8 Double mouth with 9 Double mouth with 10 Potable Metallic 11 Potable Metallic 12 Double mouth with 13 Double mouth with Cooking time /day Family member 26 Fuel 3 Six Wood and saw dust 1 Nine Wood and saw dust 2 Six Wood and saw dust 2 Eight Wood and bamboo Construction materials Roof with Tin, Half wall in three side and front open Made with brick having one window Roof with Tin, Half wall in three side and front open Made with Tin having one window 3 Four saw dust Made with Tin having one window 2 Seven Saw dust Made with brick having one window 1 Four Wood Roof with Tin, and three sides are open 1 Four Tree leaves Roof with Tin, and three sides are open 2 Ten Wood and saw dust Roof with Tin, and three sides are open 2 Five Wood Roof with Tin, and three sides are brick wall having one window and one door 2 Eight Wood and saw dust 1 Four Wood and saw dust 3 Three Wood and saw dust Roof with plastic, two sides in covered with tin and other two sides are open Roof with Tin, and three sides are tin wall having one window and one door Made with brick having two window and one door 14 Double 1 Four Wood and Roof with Tin, and two sides are
27 HH No. Type of ICS mouth with 15 Double mouth with 16 Potable Metallic 17 Potable Metallic 18 Potable Metallic 19 Potable Metallic 20 Potable Metallic 21 Potable Metallic 23 Potable Metallic 24 Potable Metallic 25 Potable Metallic 26 Double mouth with 27 Single mouth with 28 Double mouth with 29 Double mouth with 30 Double mouth with Cooking time /day Family member Fuel saw dust Construction materials brick wall having no door 1 Four Wood Roof with Tin, and three sides are tin wall having and one door 3 Three Wood and saw dust Roof with Tin, and two sides are brick wall having one door 2 Four Wood Roof with Tin, one side with brick wall, two sides tin wall having one door 2 Seven Wood and Roof with Tin, and three sides are saw dust brick wall having and one door 2 Four Wood and Roof with brick and two sides brick saw dust wall, one side open having one door 2 Five Wood and Roof with Tin, and three sides are saw dust open and one side has brick wall 3 Six Wood and Roof with tin and one side has brick saw dust wall, two sides have half brick wall, one side is open 2 Six Wood and Roof with tin and three sides have saw dust brick wall, having one door 2 Four Wood Roof with tin and one side has brick wall, two sides have half brick wall, one side is open 2 Six Wood and Roof with tin and one side has tin saw dust 2 Five Wood and saw dust 2 Four Wood and saw dust 1 Five Wood and saw dust 3 Five Wood and saw dust wall, two sides are open, Roof with tin and one side has brick wall, two sides have half tin wall, having one door Roof with brick and three sides have brick wall, one side is open, Roof with tin and three sides have brick wall, having one door, Roof with tin and one side has brick wall, two sides have half tin wall, having one side open 3 Five Wood Roof with tin and two sides are block and other two sides are open 27
28 Table 2: The PM, BC concentrations (µg/m3) and CO ppm during the study period (ICS) BC in HH CO PM 10 PM Type of Stove Type of Fuel 2.5 PM No 2.5 ppm µg/m 3 1 Double mouth with Wood and saw dust Double mouth with Wood and saw dust Double mouth with Wood and saw dust Double mouth with Wood and bamboo Double mouth with saw dust Potable Metallic Saw dust Potable Metallic Wood Double mouth with Tree leaves Double mouth with Wood and saw dust Potable Metallic Wood Potable Metallic Wood and saw dust Double mouth with Wood and saw dust Double mouth with Wood and saw dust Double mouth with Wood and saw dust Double mouth with Wood Potable Metallic Wood and saw dust Potable Metallic Wood Potable Metallic Wood and saw dust Potable Metallic Wood and saw dust Potable Metallic Wood and saw dust Potable Metallic Wood and saw dust Potable Metallic Wood and saw dust Potable Metallic Wood Potable Metallic Wood and saw dust Double mouth with Wood and saw dust Single mouth with Wood and saw dust Double mouth with Wood and saw dust
29 HH No Type of Stove Double mouth with Double mouth with Type of Fuel CO PM 10 PM 2.5 ppm µg/m 3 BC in PM 2.5 Wood and saw dust Wood Table 3: Comparison of PM 2.5 /PM 10 and BC/PM 2.5 ratios with respect to Fuel type (ICS) HH No Fuel type PM 2.5 /PM 10 ratio BC/PM 2.5 ratio 1 Wood and saw dust Wood and saw dust Wood and saw dust Wood and bamboo saw dust Saw dust Wood Tree leaves Wood and saw dust Wood Wood and saw dust Wood and saw dust Wood and saw dust Wood and saw dust Wood Wood and saw dust Wood Wood and saw dust Wood and saw dust Wood and saw dust Wood and saw dust Wood and saw dust Wood Wood and saw dust Wood and saw dust Wood and saw dust Wood and saw dust Wood and saw dust Wood
30 Table 4: Information on households with TCS HH No. Type of TCS Cooking time /day Family member 1 Single M 2 Three 2 Single M 3 Three 3 Single M 1 Seven 4 Single M 2 Four 5 Single M 2 Four 6 Single M 1 Four 7 Single M 3 Five Fuel Wood and saw dust Wood and saw dust Wood Wood and saw dust Wood and saw dust Wood and saw dust Wood and saw dust 8 Single M 2 Four Wood 9 Single M 2 Four Bamboo 10 Single M 1 Seven Wood 11 Single M 2 Five Wood 12 Single M 1 Five 13 Single M 2 Two 14 Single M 2 Three Wood, leaves and saw dust Wood, leaves and saw dust Wood and saw dust 15 Single M 1 Five Saw dust 16 Single M 1 Four Wood 17 Single M 3 Five Wood and saw dust Construction materials Roof with Tin, Half tin wall in three side and front open Roof with Tin, Half tin wall in three side and front open Roof with Tin, Half wall in three side and front open Roof with Tin, Half wall in three side and front open Roof with polythene, Half thatch wall in three side and front open Roof with tin, Half bamboo wall in three side and front open Roof with Tin, Half tin wall in three side having one door Roof with Tin, Half tin wall in two sides and two sides are open Roof with Tin, Half tin wall in two sides and two sides are open Roof with Tin, and Half brick wall in three sides and front open Roof with tin, thatch in three sides and front open Building having one window and one door Roof with tin, thatch in two sides, brick wall in one side having one door Roof with Tin, and wall with tin in two sides and two sides are open Roof with brick, and brick wall in one side and two sides are open having one window Roof with Tin, brick wall in three sides are having one window. Front is open. Roof with Tin, brick wall in two sides and two sides are 30
31 HH No. Type of TCS Cooking time /day Family member 18 Single M 2 Two 19 Single M 2 Two 20 Single M 1 Four Fuel Wood and saw dust Wood and saw dust Wood and saw dust 21 Single M 2 Five Bamboo 22 Single M 2 Four Wood 23 Single M 2 Seven Saw dust 25 Single M 1 Four Saw dust 26 Single M 2 Six Saw dust 27 Single M 2 Five 28 Single M 1 Four Wood and saw dust Wood and saw dust 30 Single M 2 Three Wood Construction materials open Roof with Tin, brick wall in two sides and one side with half brick wall and one side is open Roof with brick and two sides brick wall, one side open having one door Cook in verandah, Roof with Tin, and three sides are open Cook in verandah, Roof with Tin, and brick wall in two sides and other two sides are open Roof with polythene, bamboo fence in two sides and two sides are open Roof with polythene, bamboo fence in two sides and two sides are open Roof with tin and half brick in three sides and front open Roof with tin and tin wall in two sides and other two sides are open Roof with polythene, brick wall in one side, polythene in other side and rest two sides are open Roof with polythene, brick wall in one side, tine in other side and rest two sides are open Roof with tin and tin wall in two sides and other two sides are open Table 5: The results of PM, BC and CO during the study period (TCS) BC in CO PM 10 PM HH No Type of Fuel 2.5 PM 2.5 ppm µg/m3 1 Wood and saw dust Wood and saw dust
32 BC in CO PM 10 PM HH No Type of Fuel 2.5 PM 2.5 ppm µg/m3 3 Wood Wood and saw dust Wood and saw dust Wood and saw dust Wood and saw dust Wood Bamboo Wood Wood Wood, leaves and saw dust Wood, leaves and saw dust Wood and saw dust Saw dust Wood Wood and saw dust Wood and saw dust Wood and saw dust Wood and saw dust Bamboo Wood Saw dust Saw dust Saw dust Wood and saw dust Wood and saw dust Wood Wood and saw dust Table 6: Comparison of PM 2.5 /PM 10 and BC/PM 2.5 ratios with respect to Kitchen (TCS) HH No Construction material PM 2.5 /PM 10 ratio 1 Roof with Tin, Half tin wall in three side and front open Roof with Tin, Half tin wall in three side and front open Roof with Tin, Half wall in three side and front open Roof with Tin, Half wall in three side and front open Roof with polythene, Half bamboo wall in three side and front open Roof with tin, Half bamboo wall in three side and front open Roof with Tin, Half tin wall in three side having one door 32 BC/PM 2.5 ratio
33 HH No Construction material PM 2.5 /PM 10 ratio BC/PM 2.5 ratio 8 Roof with Tin, Half tin wall in two sides and two sides are open Roof with Tin, Half tin wall in two sides and two sides are open Roof with Tin, and Half brick wall in three sides and front open Roof with tin, bamboo fence in three sides and front open Building having one window and one door Roof with tin, bamboo fence in two sides, brick wall in one side having one door Roof with Tin, and wall with tin in two sides and two sides are open Roof with brick, and brick wall in one side and two sides are open having one window Roof with Tin, brick wall in three sides are having one window. Front is open Roof with Tin, brick wall in two sides and two sides are open Roof with Tin, brick wall in two sides and one side with half brick wall and one side is open Roof with brick and two sides brick wall, one side open having one door Cook in verandah, Roof with Tin, and three sides are open Cook in verandah, Roof with Tin, and brick wall in two sides and other two sides are open Roof with polythene, bamboo fence in two sides and two sides are open Under stair and two sides are open Roof with tin and half brick in three sides and front open Roof with tin and tin wall in two sides and other two sides are open Roof with tin covered with brick wall, two window and one door Roof with polythene, brick wall in one side, polythene in other side and rest two sides are open Roof with tin covered with brick wall, having two windows and two doors Roof with polythene, brick wall in one side, tine in other side and rest two sides are open
34 Table 7: Ambient Air Quality data during the sampling period Date PM 10 PM 2.5 BC µg/m 3 03/06/ /08/ /12/ /15/ /23/ /25/ /27/ /29/
35 Annex- V: Quality checks for PM 10 and PM 2.5 Data Data quality check for PM 10 and PM 2.5 of ICS measurement At first we have done frequency calculation for PM 10 and PM 2.5 data values for ICS measurement and plotted those values in order to observe the distribution pattern of the data values. Figure 2 and Figure 3 show the frequency diagram of PM 10 and PM 2.5. From these Figures, it has observed that there are some outliers in this distribution. Because, there are many variable during PM sampling and difficult to control all PM PM2.5 Frequency Frequency Figure 2: Frequency diagram of PM 10 Figure 3: Frequency diagram of PM 2.5 In order to reject this outlier, we have done statistical calculation such as mean, standard deviation and median values and considered median as a central point. Then we plotted data values against HH no. Figure 4 and Figure 5 show the data quality before and after rejection of data in case of ICS. We have rejected the data value which is beyond 3std PM10( µ g/m3) PM2.5( µ g/m3) Figure 4: The data of PM 10 and PM 2.5 in case of ICS before rejection (pink line=median value; blue dots=1std; orange line=2std; brown dots=3std) 35
36 PM PM Figure 5: The data of PM 10 and PM 2.5 which are within 3α in case of ICS (After rejection; pink line=median value; blue dots; 1std; brown line=2std; orange dots=3std) Then, again we have done frequency calculation after rejection of data value for PM 10 and PM 2.5 of ICS measurement and plotted those values in order to observe distribution pattern of the data values. Figure 6 and figure 7 show the frequency diagram of PM 10 and PM Frequency PM10 Frequency PM Figure 6: Frequency diagram of PM 10 Figure 7: Frequency diagram of PM
37 Data quality check for PM 10 and PM 2.5 of TCS measurement Like previous section, at first we have done frequency calculation for PM 10 and PM 2.5 data values for TCS measurement and plotted those values in order to observe distribution of the data values. Figure 8 and Figure 9 show the frequency diagram of PM 10 and PM 2.5. Here are also some outliers. Frequency PM Frequency PM Figure 8: Frequency diagram of PM 10 Figure 9: Frequency diagram of PM 2.5 Then we have done statistical calculation such as mean, standard deviation and median values and plotted against HH no. Figure 10 and Figure 11 show the data quality before and after rejection of data in case of TCS. We have rejected the data value which is beyond 3std PM10 (µg/m3) PM2.5 (µg/m3) Figure 10: The data of PM 10 and PM 2.5 in case of TCS before rejection (pink line=median value; blue dots=1std; brown line=2std; orange dots=3std) 37
38 PM10 (µg/m3) PM2.5 (µg/m3) Figure 11: The data of PM 10 and PM 2.5 which are within 3α in case of TCS (After rejection; pink line=median value; blue dots; 1std; brown line=2std; orange dots=3std) Then, again we have done frequency calculation after rejection of data value for PM 10 and PM 2.5 of TCS measurement and plotted those values in order to observe the distribution pattern of the data values. Figure 12 and Figure 13 show the frequency diagram of PM 10 and PM 2.5. Frequency PM Frequency PM Figure 12: Frequency diagram of PM 10 Figure 13: Frequency diagram of PM
39 Annex- VI: T-test for data from the HHs with ICS and TCS for the significance of difference between the two sets The T-test was done between two groups of data sets in order to check the significance evidence of the data sets. The formula of T-test is x 1 x 2 t = (1) 2 2 s1 / n1+ s2 / n2 where x 1 and x 2 are the means of the two groups, is the hypothesized difference between the population means (0 if testing for equal means), s 1 and s 2 are the standard deviations of the two groups, and n 1 and n 2 are the sizes of the two groups. The number of degrees of freedom for the problem is the smaller of n 1 1 and n 2 1. Here significance level of α = 0.05 was used. From T- test, it has found that the results were statistically significant evidence that traditional stove (TCS) emits more PM, BC as well as CO than improved cook stoves (ICS). The results of T-test are given below: T-Test: CO Let µ 1 represent the population mean for the Group 1 Traditional Cook Stove(TCS) and µ 2 represent the population mean for Group 2 Improved Cook Stove (ICS). Null hypothesis: H 0 : µ 1 = µ 2 Alternative hypothesis: H a : µ 1 > µ 2 TCS and ICS emits same amount of CO TCS emits more CO than ICS Group Details n x S n-1 Group 1 TCS Group 2 ICS DOF α 0.05 t critical 1.71 t computed t computed > t critical Therefore, null hypothisis is rejected. The test provided statistically significant evidence that TCS emits more CO than ICS. 39
40 T-Test: PM 10 Let µ 1 represent the population mean for the Group 1Traditional Cook Stove(TCS) and µ 2 represent the population Group 2 Improved Cook Stove(ICS). Null hypothesis: H 0 : µ 1 = µ 2 Alternative hypothesis: H a : µ 1 > µ 2 TCS and ICS emits same amount of PM10 TCS emits more PM10 than ICS Group Details n x S n-1 Group 1 TS Group 2 ICS DOF α 0.05 t critical 1.71 t computed 8.59 t computed > t critical Therefore, null hypothisis is rejected. The test provided statistically significant evidence that TCS emits more PM10 than ICS. T-Test: PM2.5 Let µ 1 represent the population mean for the Group 1 Traditional Cook Stove (TCS) and µ 2 represent the population mean for Group 2 Improved Cook Stove(ICS). Null hypothesis: H 0 : µ 1 = µ 2 Alternative hypothesis: H a : µ 1 > µ 2 TCS and ICS emits same amount of PM2.5 TCS emits more PM2.5 than ICS Group Details n x S n-1 Group 1 TCS Group 2 ICS DOF α 0.05 t critical 1.71 t computed 7.25 t computed > t critical Therefore, null hypothisis is rejected. The test provided statistically significant evidence that TCS emits more PM2.5 than ICS. 40
41 T-Test: BC Let µ 1 represent the population mean for the Group 1 Traditional Cook Stove(TCS) and µ 2 represent the population mean for Group 2 Improved Cook Stove(ICS). Null hypothesis: H 0 : µ 1 = µ 2 Alternative hypothesis: H a : µ 1 > µ 2 TCS and ICS emits same amount of BC TCS emits more BC than ICS Group Details n x S n-1 Group 1 TCS Group 2 ICS DOF α 0.05 t critical 1.71 t computed t computed > t critical Therefore, null hypothisis is rejected. The test provided statistically significant evidence that TCS emits more PM2.5 than ICS. 41


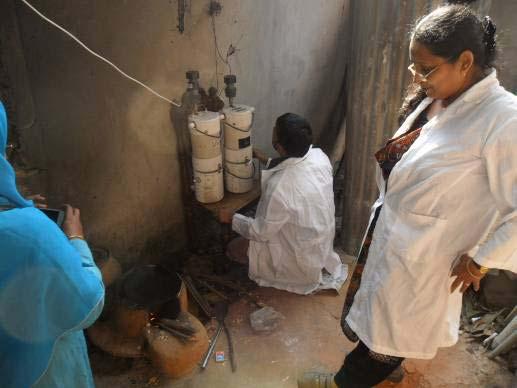


42 The pictures during the sampling period 42