Windrowing. Mr. John Clarke Prof. Michael Bruen
|
|
|
- Fay Matthews
- 5 years ago
- Views:
Transcription
1 Windrowing Mr. John Clarke Prof. Michael Bruen
2 Introduction Before a forest is replanted a number of ground preparation operations are carried out. These include windrowing as well as the clearing of debris from drainage channels. Additional drainage channels may also be dug at this time if they are required
3 Windrowing The stacking of leftover vegetation, brash and other organic matter into long narrow rows Purpose To clear enough space for the replanting of new trees To maintain the site- clear blocked drains, remove brash mats, construct new drainage channels in wet locations What is windrowed Decaying branches, leaves and needles stripped off trees during felling Brash mats and brash bridges left behind after clearfelling Tree stumps and roots (not practiced in sites as part of this study)


4 Pre Windrowing Some pine needles still attached to branches More pine needles on the ground


5 During Windrowing Brash Mat Over Stream Removed New Drainage Channels Dug
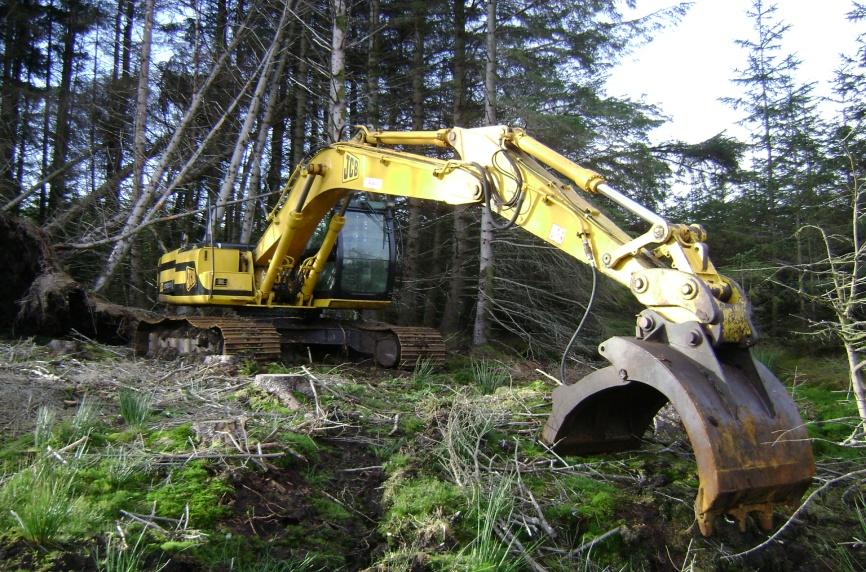
6 During Windrowing
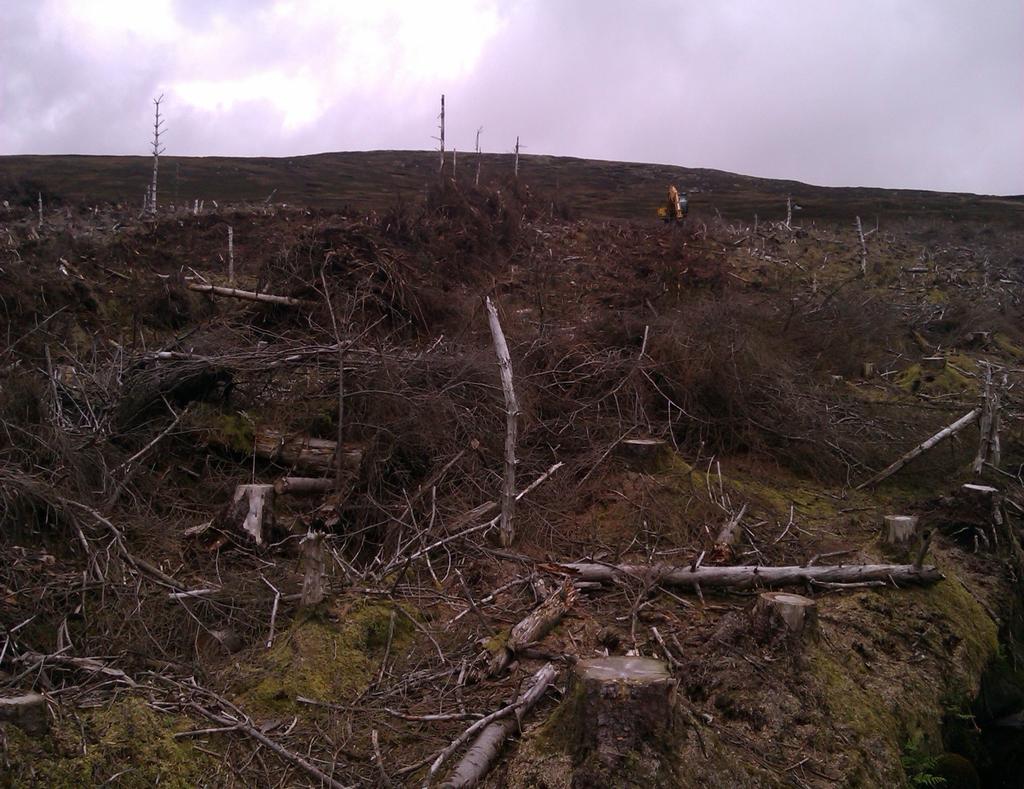
7 After Windrowing
8 Water Quality Concerns Increased soil disturbance by machinery during windrowing Increased soil disturbance caused by the scraping and gathering of brash from the ground Release and mobilisation of loose sediment and nutrients from underneath the brash Mobilisation of sediment during drain clearing, bank collapses, increased sediment loss if new drainage channels are dug Removal of protective cover that the brash provides
9 Hypotheses of Study Reforestation practices result in ground disturbance that increases sediment and nutrient losses to streams draining the catchment
10 Study Site- Annalecka Plantation Size- 10 Ha Catchment Size Ha Felled in Spring Sitka Spruce (Picea sitchensis). Some needles still attached to branches, more on ground. Windrowing began 3 rd September 2011 and lasted until 1 st October 2011 No new drainage channels dug

11 Annalecka Brook Aerial Photographs
12 Suspended Solids Event Loads (Kg) , SS (Kg) ,700 2,085 1, % Area WR ,011 P1 P2 P3 D4 D5 D6 D7 A8 A9 A10 A11 A12 A13 A14 A Months Post WR
13 SS FWMC (mg/l) and Average Rainfall Rate (mm/hr) SS FWMC (mg/l) SS FWMC (mg/l) Average Rainfall Rate (mm/hr) P1 P2 P3 D4 D5 D6 D7 A8 A9 A10 A11 A12 A13 A14 A Rainfall Rate (mm/hr) % Area WR Months Post WR
14 SS (mg/l) SS (mg/l) :00 12:00 00:00 12:00 00:00 12:00 00: SS (mg/l) :00 12:00 00:00 12:00 00:00 12:00 00:00 SS (mg/l) D6 D Flow (m3/s) Flow (m3/s) Flow (m3s) Flow (m3s)
15 Total Event Phosphorous Loads (Kg) TP (Kg) % Area WR P1 P2 P3 D4 D5 D6 D7 A8 A9 A10 A11 A12 A13 A Months Post WR
16 TP Flow Weighted (mg/l) TP FWMC (mg/l) TP FWMC (mg/l) Average Rainfall Rate (mm/hr) P1 P2 P3 D4 D5 D6 D7 A8 A9 A10 A11 A12 A13 A Rainfall Rate (mm/hr) % Area WR Months After WR
17 SS and TP Relationship SS (mg/l) TP (mg/l) R2= 0.82
18 Variation of Soluble Reactive Phosphorous Loads During Sampled Events (Kg) SRP Load (Kg) PWR DWR AWR Time
19 Nitrate FWMC (mg/l) Nitrate FWMC (mg/l) P1 P2 P3 D4 D5 D6 D7 A8 A9 A10 A11 A12 A13 A % Area WR Months Post WR
20 Total Ammonia Flow Weighted Mean Concentrations (mg/l) 0.3 Ammonia FWMC (mg/l) Average Rainfall Rate (mm/hr) 0 Ammonia FWMC (mg/l) Rainfall Rate (mm/hr) 0 P1 P2 P3 D4 D5 D6 D7 A8 A9 A10 A11 A12 A13 A % Area WR Months Post WR
21 0.6 Potassium Flow Weighted Mean Concentrations (mg/l) 0.5 Potassium FWMC (mg/l) P1 P2 P3 D4 D5 D6 D7 A8 A9 A10 A11 A12 A13 A % Area WR Months Post WR
22 Annalecka Seasonal Trends FWMC (mg/l) DOC FWMC (mg/l) FWMC (mg/l) Aluminium FWMC (mg/l)
23 Annalecka Conclusions Removing the effect of flow magnitude indicates that increased sediment and nutrient concentrations observed were as a result of windrowing operations. Elevated concentrations, while declining, seem to persist for up to 2 years after operations ceased Management No observed silt trapping structures used during windrowing. Some observable rutting in places. No streams crossed by machinery.
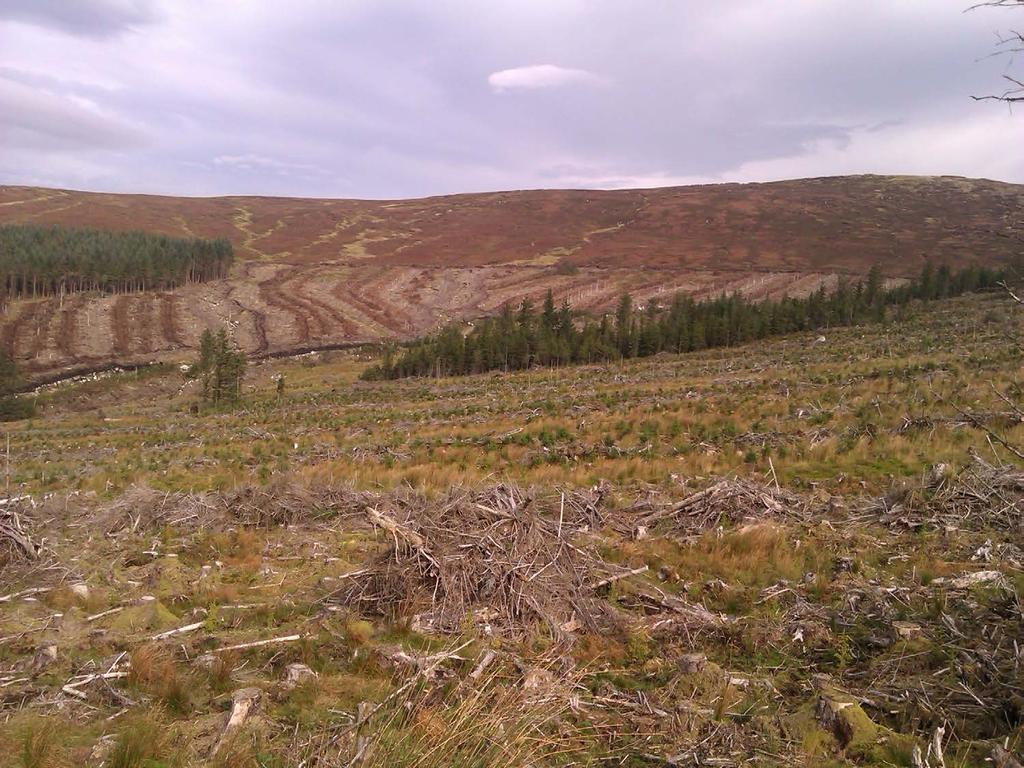
24 Study Site- Oakwood Site Size Ha Catchment Size- 48 Ha Felled in Sitka Spruce (Picea sitchensis) Windrowing began 17 th October 2011 and lasted until 24 th October 2011 One new drainage channel dug Between the studied plantation and the study stream there is a 2-3 year old strip (50-100m+ wide in places ) of planted pine trees.


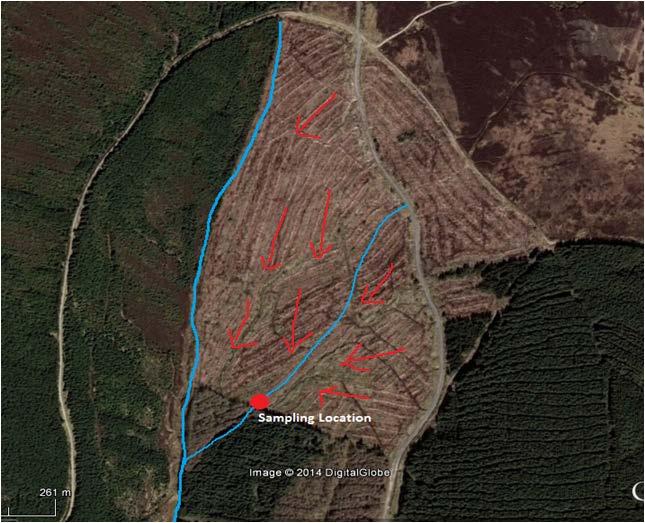
25 Oakwood Aerial Photographs

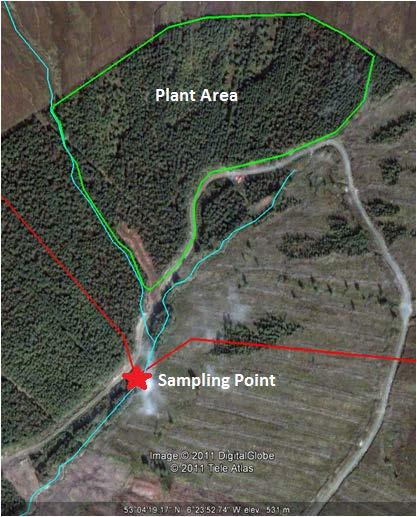
26 Oakwood Map
27 Event Loads (Kg) SS Loading (Kg) TP Loading (Kg) R2= SS (Kg) TP (Kg) P1 P2 P3 P4 D5 D6 D7 A8 A9 A % Area WR Months After WR 0
28 Variation of SRP Loads (Kg) During Sampled Events SRP Loading (Kg) PWR DWR AWR Time
29 Nitrate Event Loads (Kg) Nitrate (Kg) P1 P2 P3 P4 D5 D6 D7 A8 A9 A % Area WR Months After WR
30 Total Ammonia Event Loads (Kg) Ammonia (Kg) P1 P2 P3 P4 D5 D6 D7 A8 A9 A % Area WR Months After WR
31 Total Ammonia Flow Weighted Mean 0.12 Concentrations (mg/l) 0.10 Ammonia FWMC (mg/l) P1 P2 P3 P4 D5 D6 D7 A8 A9 A % Area WR Months After WR
32 Potassium Event Loads (Kg) Potassium (Kg) P1 P2 P3 P4 D5 D6 D7 A8 A9 A % Area WR Months After WR
33 Seasonal Trends Oakwood FWMC (mg/l) DOC 05-Jul 16-Jul 28-Jul 10-Sep 17-Oct 22-Oct 24-Oct 25-Apr 11-Oct 25-Oct FWMC (mg/l) Aluminium 05-Jul 16-Jul 28-Jul 10-Sep 17-Oct 22-Oct 24-Oct 25-Apr 11-Oct 25-Oct
34 Oakwood Conclusions Sediment and nutrients showed the same increasing trends during windrowing but on a reduced scale. Concentrations recorded were lower due to the distance of operations from the sampling location and mitigation by the presence of the 2-3 year old plantation and/or due to the size of the plantation windrowed Ha DOC, Aluminium and Calcium showed similar seasonal trends to Annalecka. Management No observed silt trapping structures used during windrowing. Some observable rutting in places. New drainage channel dug No streams crossed by machinery.
35 Study Sites Kilcoagh Site Size Ha Catchment Size Ha Felled in Pine/Spruce Windrowing began 25 th September 2012 and lasted until 30 th October 2012 One new drainage channel dug

36 Kilcoagh
37 Flow Weighted Mean Concentrations (mg/l) SS FWMC (mg/l) SS FWMC (mg/l) R2= 0.73 TP FWMC (mg/l) TP FWMC (mg/l) 0.00 P1 P2 P3 D4 D5 D6 A7 A8 A9 A10 A % Area WR Months After WR 0.00
38 0.12 Variation of SRP Loads (Kg) During Sampled Events 0.1 SRP Loading (Kg) PWR DWR AWR Time
39 Nitrate FWMC (mg/l) Nitrate FWMC (mg/l) P1 P2 P3 D4 D5 D6 A7 A8 A9 A10 A % Area WR Months After WR
40 Total Ammonia FWMC (mg/l) Ammonia FWMC (mg/l) P1 P2 P3 D4 D5 D6 A7 A8 A9 A10 A % Area WR Months After WR
41 Potassium Event Loads (Kg) Potassium (Kg) P1 P2 P3 D4 D5 D6 A7 A8 A9 A10 A % Area WR Months After WR
42 Kilcoagh Seasonal Trends DOC Aluminium FWMC (mg/l) P1 P2 P3 D4 D5 D6 A7 A8 A9 A10 A11 FWMC (mg/l) P1 P2 P3 D4 D5 D6 A7 A8 A9 A10 A11
43 Kilcoagh Conclusions Sediment and nutrients showed the same increasing trends during windrowing. Concentrations recorded were lower than those recorded at Annalecka Catchment characteristics- drainage network DOC, Aluminium and Calcium showed similar seasonal trends to Annalecka. Management No observed silt trapping structures used during windrowing. Some observable rutting in places. No streams crossed by machinery.
44 Kilcoagh
45 Windrowing Summary and Conclusions Annalecka- large increases in sediment and nutrient concentrations during windrowing. Oakwood- an increasing trend in sediment and nutrients observed. Concentration increases not significant in terms of biological impact due to the presence of the 2-3 year old plantation and the size of the plantation windrowed. Kilcoagh- an increase in sediment and nutrient concentrations recorded during windrowing. Some large peaks observed in sediment and phosphorous.