AIR SCOUR DEMONSTRATES FILTER PERFORMANCE AND ECONOMIC BENEFITS IN QUEEN LANE WATER TREATMENT PLANT
|
|
|
- Tracey Mosley
- 5 years ago
- Views:
Transcription
 Jerry Kuziw, Shiju Kuriakose, Kate Guest, Ya-Chi Tsao")
1 AIR SCOUR DEMONSTRATES FILTER PERFORMANCE AND ECONOMIC BENEFITS IN QUEEN LANE WATER TREATMENT PLANT Jamie Shambaugh, Lori Kappen (GF) Jerry Kuziw, Shiju Kuriakose, Kate Guest, Ya-Chi Tsao (PWD)
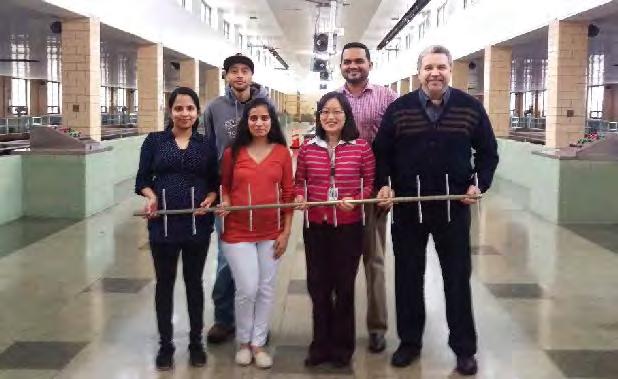
2 Acknowledgement
3 Introduction and Objectives Queen Lane WTP Processes raw water from the Schuylkill River Ferric chloride coagulation, flocculation, and sedimentation 40 dual-media filters Average of 62.7 mgd processed (2015) Median filter surface loading rate 1.1 gpm/sf Average 63 hour filter run time (2015) Full-scale filter air scour demonstration test Assess advancing filter backwash performance Quantify potential filter system efficiency improvements Field optimization and data collection to evaluate: Technical and economic benefits of air scour enhanced BW Comparison of air scour test filters to remaining 38 baseline filters
4 Objectives Focus of evaluation: Improve filter media cleaning Reduce backwash water usage Reduce process wastewater production Extend filter runtimes Reduce power usage, and Enhance operations and stormwater relief Evaluate potential economic and environmental benefits Limited opportunity to improve filter effluent quality Consistently <0.10 NTU Maintaining filter effluent quality critical Partnership for Safe Water participant LT2 Bin 2 requirements


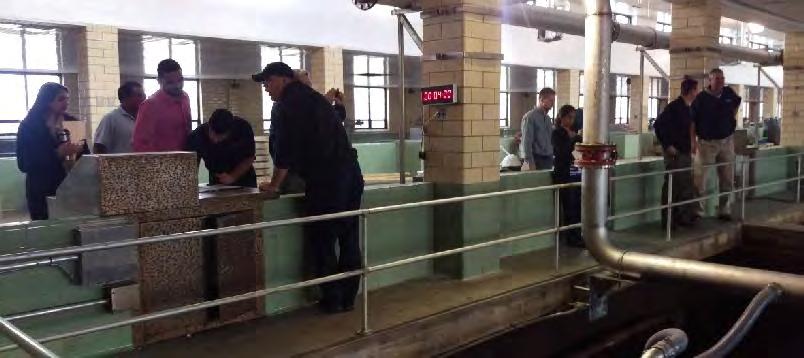
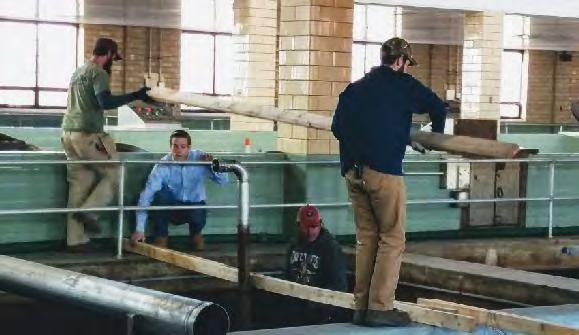
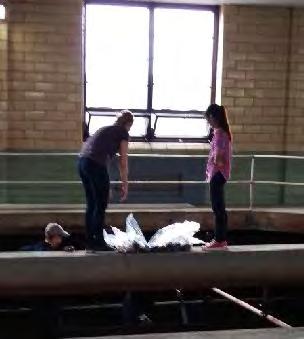
5 Test Arrangement Removed surface wash equipment and installed Aries air scour system from Filters 17 and 19 Installed temporary electrical equipment, blower, and air piping Collected additional field samples: Baseline filters 18 and 20 Experimental filters 17 and 19 Baseline Filters No.18 and 20 Test Filters No.17 and 19


6 Air Scour Blower and Air Supply Header


7 Air Supply Header, Flow Meter, Blower Control

8 Air Scour Timer and Filter Air Supply Isolation Valve

9 Filter Air Supply Isolation Valve, Air Header, and Drop Pipes

10 Air Scour Drop Pipes and Air Distribution Grid
11 Operating Air Scour System

12 Air Scour Test Protocol - Data Collection Filter operating performance Filter effluent turbidity Filter effluent particle counts Filter Backwash Filter pre- and post- headloss Run time Backwash protocol Power usage Backwash water usage Media expansion Filter cleaning efficiency Backwash turbidity profiles Acid solubility Floc retention Filter Media Characteristics
13 One-Year Test Plan Mechanical Performance Test Phase 1 Baseline Operation Baseline and Test Filters Backwashed same (except air scour) Phase 2 - Optimize High Rate Backwash Duration Incremental reduction from 8 to 4 minutes Phase 3 - Optimize Initial Low Rate Backwash Duration Incremental reduction from 4 to 2 minutes Phase 4 - Optimize Air Scour Duration Compare 5 minute and 2.5 minute air scour Phase 5 Optimize High Rate Backwash Rate Incremental reduction of rate by 2,000, 2,500, and 3,000 gpm Phase 6 Optimize Backwash Procedure Reduce high wash rate, increase final low wash duration
 Air scour resulted in no discernable turbidity impacts Very low turbidity")
14 Filter Effluent Turbidity Performance Pre-test turbidity <0.1 NTU Turbidity varied over test period (all filters) Air scour resulted in no discernable turbidity impacts Very low turbidity produced by baseline filters Goal was no negative impact Partnership LT2

15 Typical Filter Effluent Particle Counts (2µ- 5µ)
16 Post-Backwash Particle Count Spike Duration (2µ- 5µ)
17 Phase 1 - Baseline Operation Backwash Turbidity Profile
18 Phase 1 - Baseline Operation Backwash Turbidity Profile (Linear Scale)
19 Phase 2 Reduced High Rate Backwash Duration Backwash Turbidity Profile
20 Phase 3 Reduced Initial Low Rate Backwash Duration Backwash Turbidity Profile

21 Phase 4 Reduced Air Scour Duration Backwash Turbidity Profile
22 Phase 5 Reduced High Rate Backwash Flow Rate Backwash Turbidity Profile
23 Phase 6 Additional Backwash Protocol Optimization Backwash Turbidity Profile
24 Estimated Material Removed During Backwash Air Scour Test Phase Phase 1 Phase 3 Phase 5 Backwash Date Filter Number Air Scour Duration (minutes) Initial Low Rate High Rate Wash Wash Final Low Rate Wash High Rate Backwash Flow Rate (gpm) Approximate Material Removed (kg) 12/9/ , /7/ , /7/ , /22/ , /27/ , /27/ , /4/ , /18/ , /29/ , /3/ , /19/ , /2/ , /2/ , /21/ , /16/ , /16/ , /27/ , /28/ , /28/ , /20/ , /20/ ,


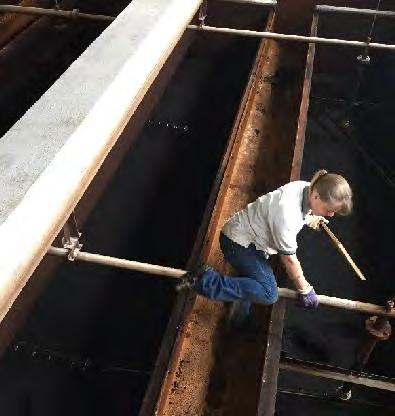
25 Post-Backwash Filter Bed Appearance August 16, 2016 Filter 17 Air Scour Filter 20 Surface Wash
26 Filter Headloss Accumulation Rate Test Data Pre-Test Data

27 Filter Run Length Comparison
28 Ease of Operation Improve the overall integrity of filters Lower post-backwash turbidity peak Less usage of backwash water pump Higher operation runtime flexibility Better response to challenged source water quality (drought) Maintain filter performance (headloss, runtime, filter-to-waste) Less maintenance Less parts replacement and labor
29 Power Existing Backwash Procedures Air Scour Backwash kwh/backwash Air Scour Backwash Extended Run Times Annual Cost $ 28,000 $ 19,000 $ 15,000 Washwater Production and Wastewater Transfer Washwater/ Backwash, gal. Annual Operating Cost Comparison Surface Wash and Air Scour 245, , ,000 Annual Cost $ 308,000 $ 196,000 $ 157,000 Maintenance $ 110,000 $ 50,000 $ 50,000 Total $ 446,000 $ 265,000 $ 222,000
30 Present Worth Comparison of Filter Wash System Options Backwash Method Capital Cost Annual Operation and Maintenance Costs 20-year Present Worth of Annual Costs Total Present Worth Baseline $ 3,800,000 $ 446,000 $ 6,490,000 $ 10,290,000 Air Scour $ 4,800,000 $ 265,000 $ 3,860,000 $ 8,660,000 Air Scour - Extended Run Time $ 4,800,000 $ 222,000 $ 3,230,000 $ 9,790,000
31 Conclusions and Recommendations Compared to Surface Wash Backwash, Filter Air Scour Backwash: Improves removal of material from filter bed Allows reduced backwash flow rates High wash rate reduction of up to 3,000 gpm Allows reduced backwash durations High wash duration reduction of 50% Reduced washwater use and wastewater production by 35% Could allow for extended filter run times Additional water and energy savings With extended low wash duration (ETSF BW), can reduce post-bw turbidity spike Consistent with PWD s reliability, regulatory compliance, and environmental stewardship mission


32 Thank You!