Building Scenarios to Assess Carbon Pricing Instruments: Low Emissions Development Studies in Poland and Macedonia
|
|
|
- Christine Little
- 5 years ago
- Views:
Transcription

1 Building Scenarios to Assess Carbon Pricing Instruments: Low Emissions Development Studies in Poland and Macedonia Erika Jorgensen, Erika Economic Jorgensen Adviser World Bank, World Europe Bank, Europe and Central and Central Asia Region Asia Region 24 April April
2
3 Elements of Poland s low carbon study Context and challenges Poland s greenhouse gas emissions Emissions abatement targets Business-as-usual scenarios for Poland Suite of models Technical options for reducing GHG emissions Economic effects related to technical options Implementation of EU energy and climate policy Results Three critical sectors for intervention Informing lowemissions strategy Readiness to analyze related issues in the future
4 A suite of complementary and interlinked models were developed for this low emissions growth assessment for Poland MacroMAC curve Multi-region CGE Peer-reviewed model applied to Poland Impact of EU package ROCA Model Dynamic stochastic GE Poland model + energy and climate redesign Macro impact of options MEMO Model MicroMAC Curve TREMOVE model (road transport) Passenger, freight TREMOVE Plus Model Marginal abatement cost (NPV cost per tco 2 e) ~120 technology options
 General Equilibrium (economy as a whole, captures inter-sectoral linkages) Why large scale DSGE Model can be used for In line with mainstream contemporary macroeconomics:")
 theories Complex, abstract mathematical object but can be built in a user friendly manner General model was")
5 Large-scale DSGE model for Poland-MEMO Main features Dynamic (economy changes over time, good to understand the transition) Stochastic (economy changes due to random shocks technology, relative prices, policies) General Equilibrium (economy as a whole, captures inter-sectoral linkages) Why large scale DSGE Model can be used for In line with mainstream contemporary macroeconomics: neoclassical in spirit (microeconomic principles, optimization by agents), but combines elements of Real Business Cycle RBC (flexible prices, business cycle due to technological change) and New-Keynesian (prices set in monopolistic competition, market frictions and imperfections) theories Complex, abstract mathematical object but can be built in a user friendly manner General model was based on Eurostat industry level KLEMS database, and was successfully peer-reviewed Quantify economic and fiscal effects of policy options, both ex-post, and exante within a coherent and transparent framework Help understand the causality and developments over short- medium- or long-term Forecast the economic and fiscal impact of external shocks and policy changes, incorporating expectations Flexibly respond to different policy questions, including low-carbon or green transition
6 Poland s DSGE model structure
7 Transmission mechanism to lowcarbon/green economy Incorporating sectoral engineering type of information into the DSGE model Each intervention is interpreted as exogenous shift in the production technology or in the utility function and may change (be a shock to): demand for materials import demand energy efficiency at sector level energy demand consumption demand emission intensity of production public subsidies for material and consumption expenditures of households and firms for light and heavy industry products changes in public subsidies for energy investments tax rates and subsidy schemes
8 Three classes of parameters in the DSGE model 1. Parameters determining level of variables in the steady state 2. Parameters controlling elasticities of substitution and relative standard deviation between specified variables 3. Parameters determining the exact form of exogenous stochastic shocks, and lead-lag structure of endogenous variables
9 Mtons of CO2e At first glance, it seems Poland is not far from meeting the EU s 2020 overall targets of 20 percent reduction compared to Poland s historical GHG emissions and EU-wide 2020 target, in MtCO 2 e % vs % vs % vs Kyoto Base Year in line with the EU targets

10 The development path of the economy in the absence of new low emissions policy measures is the correct comparator for policymakers considering abatement actions. Basic drivers of GHG emissions growth Note: All in growth rates, where energy intensity is change in toe per GDP; emissions intensity is change in tco 2 e per toe; and emissions elasticity is growth of tco 2 e per GDP. The figure makes clear that countries with higher population growth or higher income growth will face faster rising emissions. The emissions elasticity of GDP growth will need to be reduced by even more to offset GDP growth.
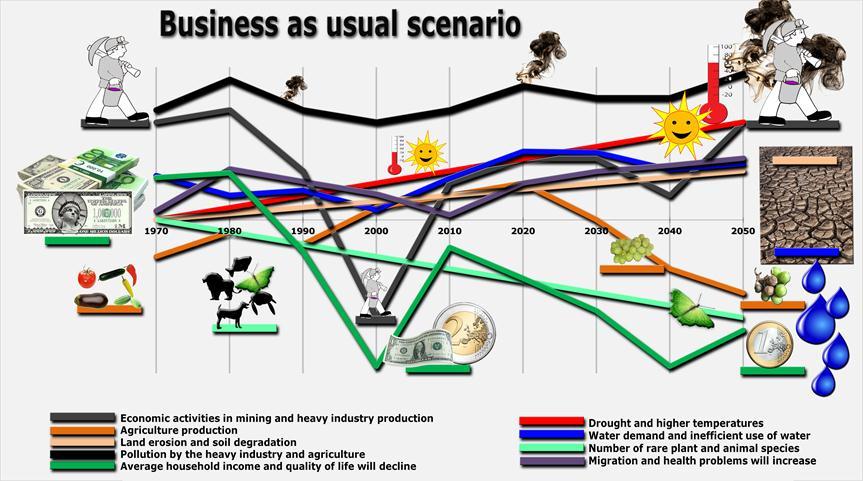
11 MtCO2e In the case of no climate action (BAU), Poland s GHG emissions path is expected to be U-shaped Business as usual scenario % vs % vs % vs % vs Kyoto Base Year BAU 2030 BAU
12 Projected total emissions are similar across models, but which sectors will find low emissions more difficult is critical for policy. GHG emissions in Poland, 2005 and 2020 scenarios, MtCO 2 e Changes in GHG emissions in Poland, 2020 scenarios vs. 2005, in % non-ets ETS 2020~EU targets 2020 ROCA BAU 2020 MEMO BAU 2005 non-ets ETS ~EU targets 2020 ROCA BAU 2020 MEMO BAU Total Total Note: The MEMO ETS and non-ets projections are corrected for small energy installation. The ROCA model produces CO 2 emissions so equivalent GHG emissions were estimated. Poland s EU ETS target is assumed to be the same (as a percentage change) as the EU-wide target.
13 Poland s DSGE model structure
14 GDP deviation from BAU, in % Poland s transition to a low-emissions economy, while not free or simple, is affordable. Decomposition of GDP impact of low emissions package, in % 1.5 mixed energy/fuel efficiency 1.0 fuel efficiency energy efficiency chemical processes industry CCS and distribution maintainance agriculture interventions low-carbon energy supply GDP deviation from BAU Note: Change in real GDP is measured against business-as-usual scenario. Categories are micro-packages (mitigation options grouped by economic characteristics).


15 MtCO2e TRANSPORT: Poland needs to consider how to address the sector with the fastest growing emissions transport. TREMOVE Plus CO 2 e emissions projections for road transport 70 BAU scenario Proactive scenario Proactive + technology Cautionary scenario Technology scenario Actual emissions Note: Precautionary scenario contains policy measures such as road pricing, fuel tax increases, and eco-driving. Proactive scenario contains same measures but with greater effort. Technology scenario contains policy measures for modest technological improvement in trucks (medium and heavy duty vehicles).
16 =
17


18 Macroeconomic model Fiscal policy Labor market Foreign trade Structural policies Agriculture, industry Energy, transport Environment, climate Policies and markets Resources Technology, productivity, innovation Human capital Physical capital Energy Environment GDP growth Employment Income distribution and poverty Fiscal aggregates Competitiveness Trade balance Economic performance Macroeconomic Model Macroeconomic Model Macroeconomic Model Sectoral models and analysis
19 Construction of the MOMA model The Macroeconomic Options of Mitigation and Adaptation (MOMA) model: captures linkages between climate mitigation and adaptation policies and the macroeconomic situation, across medium and long time horizons. Is calibrated directly on Macedonian macroeconomic data includes 12 sectors: Agriculture, Heavy Industry, Light industry, Energy, Transport, Mining and Fuels, Trade, Construction, Finance and Business Services, Public Services, and Other Services
20 Structure of the MOMA model for Macedonia
21 Climate change and infrastructure adaptation -- application of the MOMA model Apply analytical techniques from the World Bank project on economics of adaptation to climate change Estimate infrastructure needs due to changes in climate conditions (power&telecoms, water&sewers, roads, other transport, health&schools, urban, and housing). Be aware of various timelines (from a few years for electricity and water use to decades for transport infrastructure) Link results for Macedonia 2050 with the macroeconomic model to investigate economic effects Investigate the financial and economic costs and benefits of adaptation to climate change in the infrastructure sector Compare Macedonia with other Western Balkan countries
22 percent Growth accounting decomposition in Macedonia annual change in percent Total factor productivity 2.0 Capital 1.0 Labor Value added
23