Dr. Nasr Professor in Chem. Eng. Member of Board of Director RIPI
|
|
|
- Austin Cox
- 5 years ago
- Views:
Transcription


1 Dr. Nasr Professor in Chem. Eng. Member of Board of Director RIPI 21 MAY 2015 HVAC AND HEATING & COOLING SYSTEM CONFERENCE TEHRAN, IRAN 1
2
3

4 Energy and economy savings in the process of methanol synthesis using Pinch technology Dr. Nasr

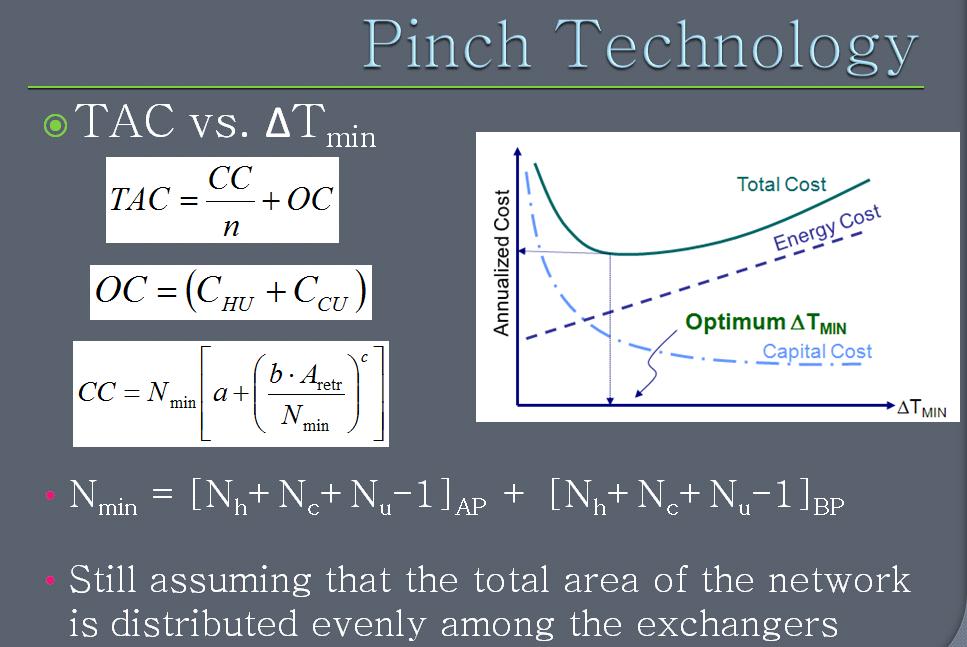
5 OUTLINES: Introduction to HTE Main Concepts in PDM Technology Methanol Process as a Case Study Procedure Demonstration on the Case Study Results and Interaction of Energy Saving & CDM Conclusion Remarks
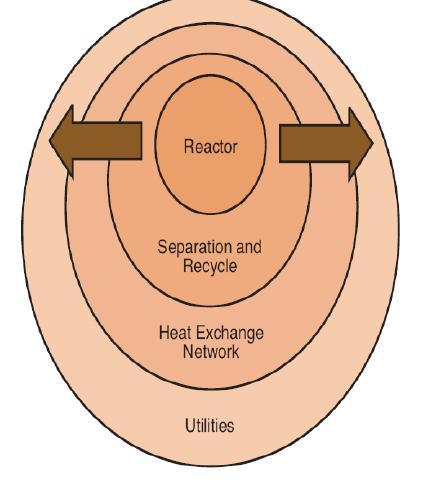
6 MAIN OBJECTIVES: The aim of this work is to perform a retrofit study of a methanol plant using Pinch Technology, in purpose of: Maximum Heat Recovery Between Process to Process HEN. Power Generation by utilizing a turbo expander after the methanol synthesis reactor to produce shaft work (electricity).
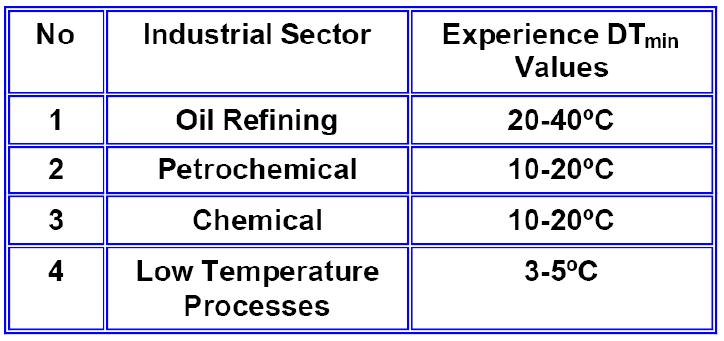
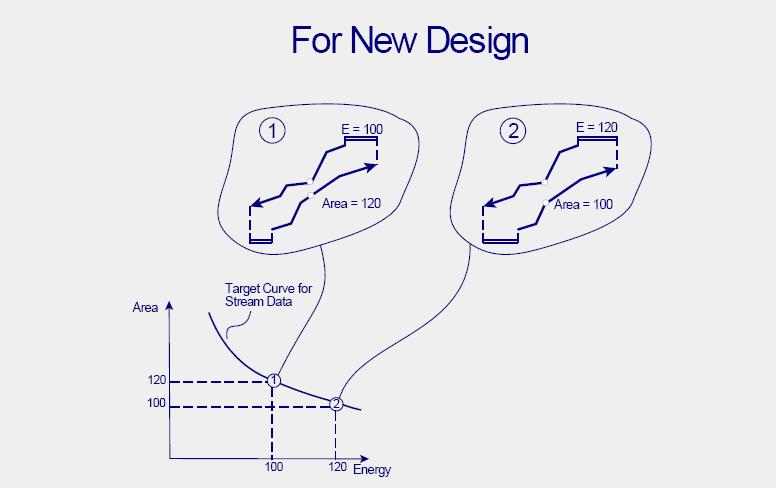
7 Introduction: Pinch Analysis - Basics & Objectives: Retrieve the temperature profile of the whole process. Locate the level of the minimum allowable temperature difference between hot and cold streams (pinch point). Predict, ahead of design, the minimum requirements of external energy, network area and number of units Set the Energy & Capital TARGET Maximize process-to-process heat recovery and minimize external utility loads and related costs
8 Intro...: Typical energy saving %. Very general easily applicable in Power generation, Oil refining, Petrochemicals, Food and Drink Industry, Pulp & Paper, Hospitals etc. Typical pay-back periods from a few weeks to 16 months (decision made by the client). Considerably contributes to Emissions Reduction including CO 2
9
10 Intro...:
11
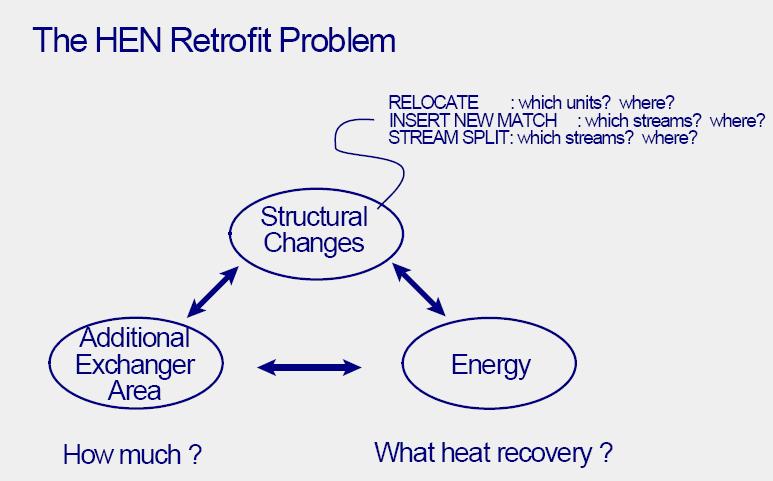
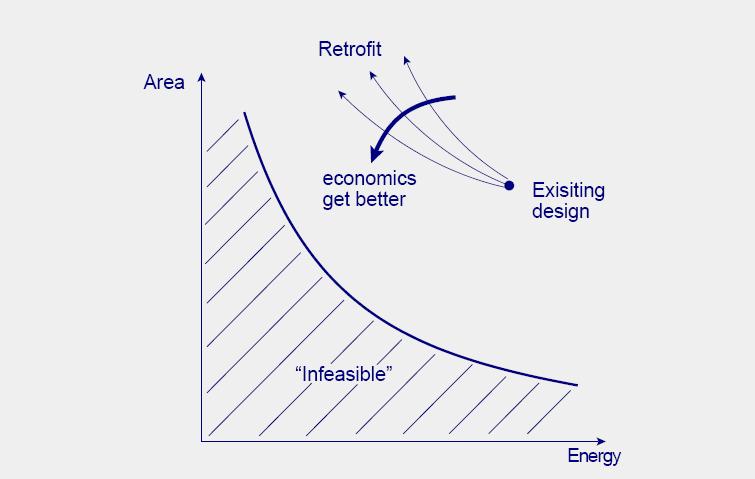
12 Intro...: Most present applications are not grass-root but retrofits considerably more difficult constrained problem. Economy dictates the energy saving potential by pay-back period.


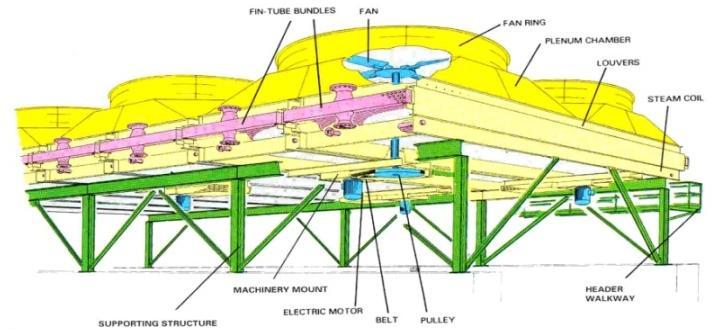
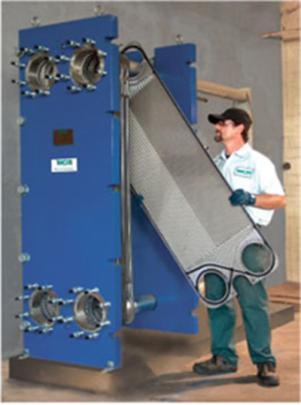
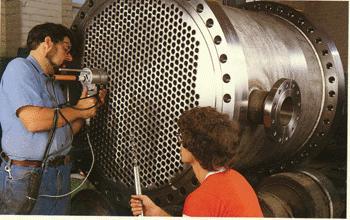
13 Shell & Tube Heat Exchangers Types Double pipe Air cooler Compact 13
 Passive Method (without power) Compound Method 14")
14 Heat Transfer Enhancement Techniques Active Method (with power) Passive Method (without power) Compound Method 14

15 Passive Methods 15


16 NEW TECHNIQUE IS HTE BY TUBE INSERTS
17

18

19 Corrugated Tubes

20 ROD Baffle Heat Exchanger by Courtesy of Philips Co. 20

21 Expanded Metal Baffles 21
22 22

23
24 24

25 Multistream Plate Fin Heat Exchanger Plate-Fin
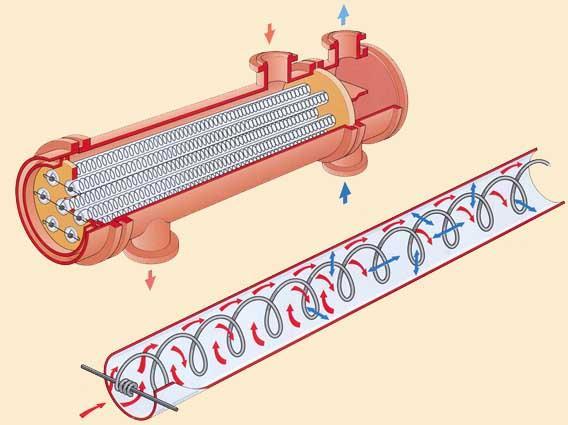
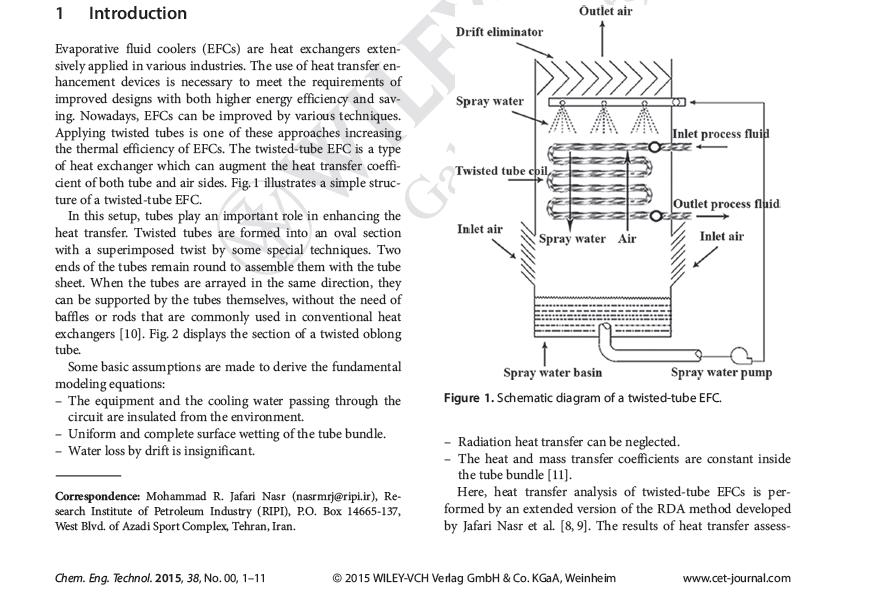
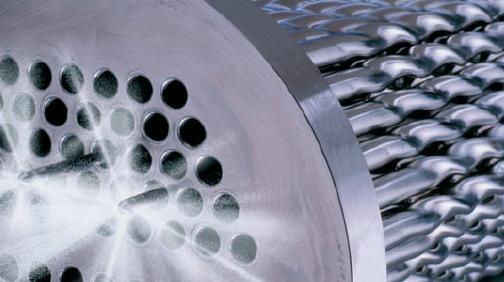
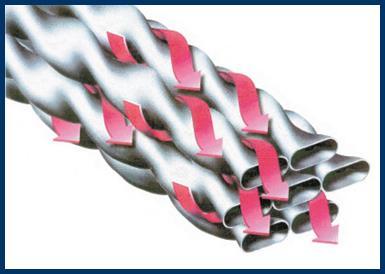
26 Twisted Tube Heat Exchangers 26

27 Advantages of Twisted Tube Heat Exchangers Baffle-Free Tube Support Tube to Tube Contact Points Eliminate Vibration More Efficient Heat Transfer Reduced Fouling Lower Pressure Drop Improved Tube side Flow Uniform Shell side Flow Twisted Tube Cleaning Efficiencies Higher Heat Transfer Area than S&T 27

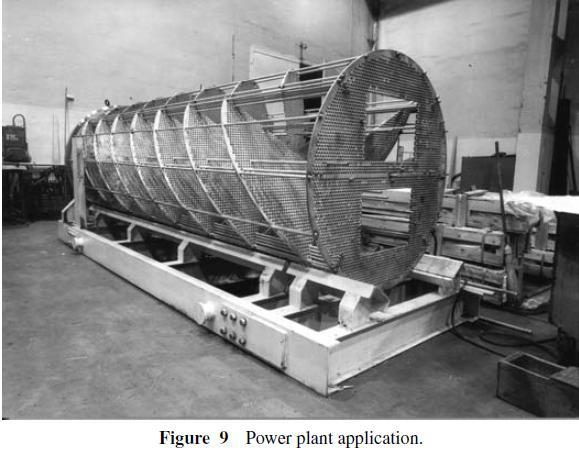
28 Applications Chemical Industries Petroleum & Petrochemical Plants Pulp & Paper Power Steel Mining / Mineral Processing District Heating 28
29 29

30
31
32
33


34 EXISTING PROCESS EXISTING PROCESS Process Integration Analysis PDM SIMULATION DATA COLLECTION PINCH ANALYSIS RETROFIT ANALYSIS SUGGESTED DESIGNS
35 Optimization Method: Three major approaches: Heuristics: not used separately any more. Algorithmic: not widely adapted in industries so far. Pinch technology: widely used at present. Pinch technology provides the optimization among heat recovery, external energy and exchanger area.
36
37
38
39
40 Heat Integration HEN H1 Grassroot Retrofit Analysis 100 C 50 C HE HE 60 C 40 C C1

41 Dr. Nasr 41
42 42
43 Incentives for Retrofitting: Improve Efficiency Product Improvement Regulatory Compliance Safety Improvement Energy Efficiency Improvement Reduction of Maintenance costs Quality Improvement New Technology Implementation
44 Constraints in Retrofitting: Space & Layout (less freedom) Insufficient Information Harsh Environment Time (payback) & Investment Limitations
45 Tools for Retrofitting: Adding New Hxrs Adding More Shells (Parallel or Series?!) Relocating Load Shifting Re-piping Stream Splitting Identifying XP Hxrs
46 46
47 47
48 HTE
49
50
51
52
53
54
55
56
57 Identify the Cross Pinch (XP) Heat Exchangers 57
58
59
60
61
62

63 CALCULATIONS & RESULTS 63
64 PROCESS DESCRIPTION OF METHANOL PRODUCTION: Methanol is generated from the reaction between hydrogen carbon monoxide and carbon dioxide the ratio in feed mixture is determined: H % CO2 Module CO% CO % 2 In addition to those mentioned other materials like methane and nitrogen exist in feed stock but do not participate in reaction these materials may enter into the system by feed or CO 2 has been imported into plant CO+ 2H 2 CH 3 OH CO 2 +3H 2 H 3 OH+H 2 O Coupled by: CO+H 2 O CO 2 +H 2

65 Methanol Process Box Diagram CO2 from Razi Plant CO 2 Compression Reforming CO 2 from Natural Stream Process Gas Heat REC. Synthesis Gas Compression Methanol Synthesis Methanol Compression Methanol Natural Gas Natural Gas Compression Desulfuration Reforming 65

66 Conventional Process for Methanol Synthesis
67 PFD of MeOH Plant (Reformer Section of FPC)
68 PFD MeOH Plant (Reaction Section of FPC)
69 Existing process: PFD of MeOH Plant (Separation section of FPC)
70 Network Existing Conditions: Table 1- Network existing condition T min ( o C ) Cold Utility (MW) Hot Utility (MW) Process To Process Area (m 2 ) Area Efficiency %79
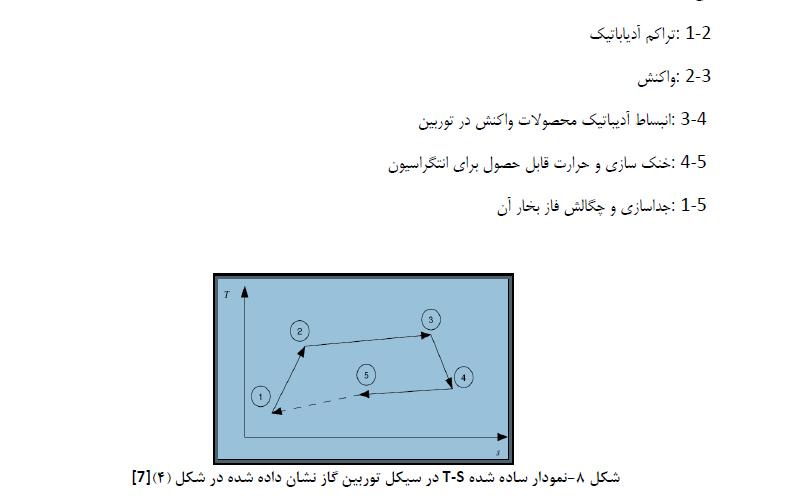
71 Grid Diagram of existing HEN in MeOH plant
 and GCC curve (fig.")
72 Figure A Figure B CC. curve (fig. A) and GCC curve (fig. B) of existing network.
73 Data Collection: Table 2- Result of physical properties calculation of heat exchanger streams at methanol plant in supply and target temperature ΔH(kW) Cp(kJ/kg) M(kg/h) T t Ts Stream Reformer outlet up to D D-5005 outlet up to D-2002 Separator outlet ( D-5005) C-3001-E-1 interstage cooler HP column product cooler Reactor outlet LP column oh condenser Water preheater Steam generation Super heater T-5001 reboiler LP column reboiler(t- 5003) Reactor fee preheater Hp column reboiler(t5002) Combustion air preheater 14 15
74 Existing HEN Analysis: In Table (3) the result of the calculations in exiting HEN streams is determined by using a program which works with Bell-Delaware method.
75 Table 3- Final data calculation of existing heat exchanger streams at methanol plant P (Bar) 1.4 HTC (W/m²K ) CP (KW/ C) 228 DH (KW) Tt ( C) 140 Ts ( C) 915 stream Reformer outlet up to D-5005 No D-5005 outlet up to D Separator outlet (D-5005) C-3001-E-1 interstage cooler HP column product cooler Reactor outlet LP column oh condenser Water preheater Steam generation Super heater T-5001 reboiler LP column reboiler(t-5003) Reactor fee preheater Hp column reboiler(t5002) Combustion air preheater 15
76 Results of Existing of HEN: Net energy consumption of methanol plant is equal to MW. The amount of hot utility is MW provided by LP steam in 170 C. The cold utility consumption is MW which provided by air (45.503MW) and cooling water (47.913MW). The Process to process area of existing situation is 11063m 2. The network energy consumption at ΔT min =33 C is equal to MW.
77 Table 4- Targeted Result on MeOH Plant Targeted DT min ( o C) Existing DT min ( o C) Targeted Cold Utility (MW) Targeted Hot Utility (MW) Targeted Hot Utility Saving (MW) Targeted Cold Utility Saving (MW) Targeted Hot Utility Saving (%) Targeted Cold Utility Saving (%) Net Profit /Yr$ Targeted Heat Surface (m 2 ) Area Cost ($) Pump Displacement Cost ($) Total Cost ($) Payback Period (Yr)
78 Identify the Cross Pinch Heat Exchangers E-4001/1&2 E-2015 C-3001-E1 E-2010/11 78
79 DFP for MeOH Process
80 Retrofit Design of HEN in MeOH Plant Grid diagram of HEN after modification (The load of heat exchanger in terms of MW and temperature in C )
81 Scenarios in Retrofit Targeting for: Determination of Operating Point? With consideration of: Investment & Payback limits Max. Heat Recovery (HEN P-to-P Recovery) max. 700 k$ Power Generation (GT Integration in Reactor) max. 3 Y
82 New Heat Exchanger Detail Design As shown in previous figure the selected network is modified with 4 process to process new heat exchangers. The total surface area has been added is equal to m² which are four new exchangers. Installed area in design procedure is 5% more than targeted procedure which is acceptable.
83 New4 Table 5- New Heat Exchanger Detail Design New3 New2 New1 Exchanger Area (Square meter) Shells (ser. par.) Shell Diameter (mm) Total No. of Tubes Tube Passes 25/4 25/4 25/ Tube O.D. (mm) 2/11 2/11 2/ Tube Thickness (mm) Tube Pitch (mm) Tube Length (m) Tube Layout (DEG) Baffle Cut (%) Baffle Spacing (mm) AEL AEL AEL AEL Type
84 Power Integration: A conventional power plant uses fuel energy to produce work and reject heat. Usually a gas turbine operates by internal combustion Air and Fuel pas through a compressor into a combustion chamber. The combustion product are expanded into turbine which drives an electric generator. Many chemicals may be produced under high pressure at high temperature. The high operating pressure of reactor outlet can be exploited to produce electricity using an open gas turbine. The open gas turbine is a basic gas turbine unit. The working fluid comes from a reactor and cycle through the following units. Gas turbine Heat exchangers Separator compressor
85 Open circuit gas turbine with separator
86
87 In order to target the amount of electricity which can be produced from the reactor outlet,and also determine the new pressure and temperature of stream number six ( table 3) it is necessary to simulate the mentioned power cycle at network. This has been performed with HYSYS software Ver.3.2 The simulation of turbine gas cycle with HYSYS software
88 Modification of HEN to Power Generation Grid diagram of HEN after modification (The load of heat exchanger in terms of MW and temperature in C )
89 New Hx Detail Design for Power Generation New heat exchangers were designed in detail with consideration of pressure drop using advance Bell-Delaware algorithm. This algorithm has an advantageous that design the surface and geometry of heat exchangers in order to meet the allowable pressure drops both in shell side and tube side. This results minimum surface area and maximum heat transfer coefficient.
90 Table 6- New Hx Detail Design for Power Generation New4 New3 New2 New1 Exchanger Area (Square meter) Shells (ser. par.) Shell Diameter (mm) Total No. of Tubes Tube Passes 25/4 25/4 25/ Tube O.D. (mm) 2/11 2/11 2/ Tube Thickness (mm) Tube Pitch (mm) Tube Length (m) Tube Layout (DEG) Baffle Cut (%) Baffle Spacing (mm) BEM AEL AEL AEL Type
91 PFD of MeOH Plant after modification of HEN Ref.( Fanavaran Petrochemical Co.)
92 PFD of MeOH Plant after modification of HEN Ref.(Fanavaran Petrochemical Co.)
93 PFD of MeOH Plant after modification of HEN Ref.(Fanavaran Petrochemical Co.)
 Payback Time 11")
94 EXISTING PROCESS EXISTING PROCESS SIMULATION SIMULATION DATA COLLECTION DATA COLLECTION PINCH ANALYSIS PINCH ANALYSIS RETROFIT ANALYSIS RETROFIT ANALYSIS SUGGESTED DESIGNS SUGGESTED DESIGNS Network Pinch Method Diagnosis Stage Optimisation Stage 4 New HE Savings Hot utility = 28+% Cold utility = 20+% Power Generation= 640,000MW Emissions reduction (30 MT/Y) Payback Time 11 months
95 Project Evaluating in Term of Clean Development Mechanism (CDM): Incremental increase of greenhouse gas such as CO 2 which is the most important of them and its effect on global warming is forced developing country to decrease this harmful effect with help of several convention such as Kyoto protocol. Since industrialized country has low potential for reducing greenhouse gas emission because of their modern technology, instead of their commitment to reduce emission of CO 2 they prefer to meet the target with other countries. Since Iran has made no specific commitment on this issue hence by implementing such projects some credits can be obtained under the Kyoto Protocol and some revenue can be obtained too.
96 CDM Calculations: Green house gas emission in (kg) for each Tera Joule (TJ) of fuel consumption according to net heat value: 1 Tera Joule = (ton) CO 2 Energy saving in hot utility= mw Thus : (MJ/s) 3600(s/hr) 8000(hr/Year) = 560,776,320(MJ/Year) =560.7(TJ/Year) The amount reduction of CO 2 in year: =314,55.2(ton/year) Since each ton of CO 2 cost ten dollars $: Income due to reduction of CO 2 = =314,552.5($/Year)
97 Table 7- Project Comparison Due to Payback Period Time (for two Scenarios) Project evaluating without considering CDM Project evaluating with considering CDM International price cost($) Domestic price cost($) International price cost($) Domestic price cost($) 711, , , ,561 Investment($) 1539, ,304 1,854, ,856.7 Income due to saving($) Pay back period time(year)
98 Table 8- Final Results for Heat Integration Tolerance )%( Design Targeting Result Hold utility consumption (MW) Cold utility consumption (MW) Hold utility saving (MW) Cold utility saving (MW) Hold utility saving (%) (MW) Cold utility saving (%) (MW) ,542,914 1,806,672 Income due to energy saving($/year) Additional cost for power consumption ($/Year) ,539,472 1,803,230 Net Income ($/Year) Area Efficiency (%) Added surface area to network(m 2 ) , ,123 Added Area Cost ($) Pump Displacement Cost ($) , ,723 Total Investment ($) Pay back period time (year)
99 Tolerance )%( Design Targeting Result Hold utility consumption (MW) Cold utility consumption (MW) Hold utility saving (MW) Cold utility saving (MW) Hold utility saving (%) (MW) Cold utility saving (%) (MW) Income due to energy saving($/year) Additional cost for electricity consumption ($/Year) Power Generation (kwh) ,220,800 14,220,800 Income due to power generation ($/Yr) ,314,485 1,136,1760 Net Income ($/Year) Area Efficiency (%) Added surface area to network (m 2 ) , ,913 Added Area Cost ($) ,700 39,700 Pump Displacement Cost ($) 0.00 Table 9- Final Results for Power Integration 25,000,000 25,000,000 Purchase& Installation &Start up gas turbine cost ($) ,649,469 2,562,8613 Total Investment ($) Pay back period time (year)
100 Conclusions: Because of energy saving in this project the amount of emission of flue gas in atmosphere decreases so environmental pollution such as green house effect will be controlled. Because of increasing heat transfer between hot and cold stream in network the load of furnace and demand for hot utility will be reduced. The result of targeting procedure is due to the pressure drop consideration. It reduces the consumption of exhaustible fossil fuels.
101 Now Process Improvement by New Generation of Exchangers

102 Twisted Tube Heat Exchangers 102

103 Gambit Geometry Simulation
104 A comparison of plain and twisted tube by Fluent software

105 A comparison of plain and twisted tube by Fluent software
106 Hot and Cold Utilities for Retrofit of HEN with Plain Tubes Utility Inlet Temp. ( o C) Outlet Temp. ( o C) M.CP (kw/ o C) Energy Consumption (MW) E C E E
107 Cost Function of Twisted Tube HXrs Capital (construction) cost function of Twisted tube HEX 1.27 Cost($) 43.74A Tube replacement cost function of twisted tube HEX Cost($) A shell 107
108 Temps. Input & Output of Twisted Tube HXrs Twisted Tube Inlet Temp. (Tube) ( o C) Outlet Temp. (Tube) ( o C) Inlet Temp. (Shell) ( o C) Outlet Temp. (Shell) ( o C) Heat Transfer Area (m 2 ) Cost of Tube Replacement ($) Heat Recovery (MW) HEX ,330 HEX ,417 HEX ,388 10,417 HEX ,080 11,
109 Hot and Cold Utilities for Retrofit of HEN with Twisted Tubes Utility Inlet Temp. ( o C) Outlet Temp. ( o C) M.CP (kw/ o C) Energy Consumption (MW) Energy Saving (MW) E C E E
110 Project Economic Comparison for Two Scenarios (Twisted Tube) Project evaluation Without considering CDM Project evaluation with considering CDM Investment($) 754, ,249 Income due to saving($/yr) 625, ,300 Payback period time(yr)
111 Utility Comparison of Utilities HXrs Existing Plain Tube Units (MW) Modifications Targeting Plain Tube Units (MW) Targeting Twisted Tube Units (MW) E C E E Q H =68.5 MW Q C =93.4 MW ΔT min =33 0 C ΔT min =16 0 C Q H =45.7 MW Q C =70.6 MW ΔT min =16 0 C 111

112 EXISTING PROCESS EXISTING PROCESS SIMULATION SIMULATION DATA COLLECTION DATA COLLECTION PINCH ANALYSIS PINCH ANALYSIS RETROFIT ANALYSIS RETROFIT ANALYSIS SUGGESTED DESIGNS SUGGESTED DESIGNS Network PDM Application of Twisted Tube Units RDA Algorithm Developed 4 New TW-HX Savings Hot utility = 18% Cold utility = 35% Area Added = 41% DT min,existing =33 o C ΔT min, Ret. =16 o C Emissions Reduction (30 MT/Y) Payback Time 11 months
113 Conclusions: A Realistic Retrofit Analysis have to consider: Pressure drop optimization Fouling effect New heat exchanger technologies A new extension of RDA for twisted tube heat exchangers Significant energy saving by application of twisted tube heat exchanger Adding 4 new process to process heat exchangers Shell and Twisted Tube (41% Heat Transfer Area more than Plain Tube) to the selected network, results up to 35% for Cold utility and 18 % for Hot utility recovery Application of this technology results a significant reduction in CO 2 113
114 Thanks for Your Attention 114