Irrigation Guidelines for Better Blueberry Production. David Bryla USDA-ARS Horticultural Crops Research Unit Corvallis, Oregon
|
|
|
- Wilfrid Ellis
- 5 years ago
- Views:
Transcription


1 Irrigation Guidelines for Better Blueberry Production David Bryla USDA-ARS Horticultural Crops Research Unit Corvallis, Oregon
2 Blueberry is sensitive to soil water deficits Even within a few days without rain or irrigation, water stress develops quickly in blueberry Under-irrigated plants reduced photosynthesis less growth lower yields Water deficits

3 When is Irrigation Needed? Marion County, OR Barton County, MO Rainfall (in.) Blueberry harvest Effective rainfall threshold d 25 d 19 d 69 d 10 d 18 d 9 d 11 d 10 d 23 d 12 d 0.0 Apr May Jun Jul Aug Sep Oct 2011 Apr May Jun Jul Aug Sep Oct 2011
4 Rapid onset of water stress in blueberry Leaf water potential declined as predicted when soil water was depleted over time As leaf water potential began to decline after 3 to 4 days, transpiration also declined Elliott Elliott 0.0 Predawn 70 Irrigated Leaf water potential (MPa) Midday Onset of leaf wilting Transpiration (ml/h) Non-irrigated Days without water Days without water
5 Stress symptoms include: Plant process Mild Water stress level Severe Reduced shoot growth Increased root growth Reduced water use Reduced photosynthesis Leaf wilting Leaf death/senescence

6 Drought Stage Effects on Yield a 100% Bluecrop Yield (g/plant) b b 78% 79% b 74% Control Fruit growth Ripening Harvest Moderate water deficits Mingeau et al. (2001)

7 Drought Stage Effects on Flower Induction 1400 Bluecrop Flower buds per plant a a 100% 102% a 91% a 96% b 53% Control Fruit growth Ripening Harvest Post-harvest Moderate water stress Mingeau et al. (2001)
8 Blueberry is also very sensitive to flooding Plants take 2 weeks to fully recover Over-irrigated plants reduced root function increased soil erosion & nutrient leaching higher incidence of root rot diseases Flooding


9 Perfect Irrigation Transpiration Irrigation Evaporation Rainfall Depends on: weather conditions soil texture plant size & stage of development cultural practices Runoff Deep percolation
10 Study 1 Irrigation Methods


11 Blueberry Irrigation in Oregon Sprinklers Drip Most commercial blueberry fields are irrigated by sprinklers or drip Irrigation is applied once or twice a week by sprinklers and every 1-3 days by drip
12 Overhead sprinkler Drip Advantages: Frost protection Maintain a cover crop Cool the crop in hot weather Wash dust off before harvest drip lines Advantages: Water control & distribution uniformity Fertigation & other chemical application Improved cultural practices Less health concerns Disadvantages: Low WUE Limits field access Promotes weed growth Increases disease problems wetting front wetting front Disadvantages: Filtration required Higher maintenance More expensive

13 A few growers are also testing microsprays on blueberry, which potentially offers advantages of both sprinklers and drip
14 Given the same amount of water, microspray irrigation produced higher yields than drip in Chile Yield (t/ha) 'Bluetta' Microspray Drip Years after planting Holzapfel et al. (2004)


 150% ET c (excessive)")
15 2004 Irrigation Study Three irrigation systems two cultivars and three irrigation rates Sprinklers Drip Microsprays Cultivars: Duke Elliott Irrigation rates: 50% ET c (deficient) 100% ET c (optimum) 150% ET c (excessive) ET c = crop evapotranspiration


16 Objective: Identify the best irrigation method for growth, production, and water use efficiency in blueberry Irrigation manifold Planted April 2004
17 Irrigation systems Sprinklers Microsprays Drip 20 x 20 ft. spacing, 1.5 gpm sprinkler heads A 6 gph emitter located between every other plant One line per row with 0.5 gph emitters every 12 in. wetting front irrigated 2x s/week efficiency - 35% wetting front irrigated 3-4x s/week efficiency - 68% wetting front irrigated 3-4x s/week efficiency - 90%
18 Drip produced the most growth in both cultivars in Year 1
19 In year 2, drip continued to produce the largest plants in Elliott but no longer in Duke % ETc 100% ETc A a Plant dry weight (g/plant) % ETc C de de e ef C de ef g D fg g b-d B bc bc AB ab bc cd bc a-c 0 Sprink. Microspr. Drip Sprink. Microspr. Drip Duke Elliott

20 Duke was smaller with drip and growth was quite variable Drip irrigated at 100% ETc

21 Duke was infected by Phytophthora; Elliott was not Infected root fragments (%) % ETc 100% ETc 150% ETc b-d b-d ab a-c ab a Root samples were plated & assessed for Phytophthora 5 de c-e de 0 e e e e e e e e e Sprinkler Microspray Drip Sprinkler Microspray Drip Duke Elliott


22 Root rot reduced growth in Duke especially with drip Note the level of shading in each treatment Microsprays Drip Sprinklers Based on plant-free soil samples, it appears the problem originated with the planting stock Drip treatment
23 Elliott Year Sprinkler Microspray Drip % 150% Total dry wt. (kg/plant) % 50% 50% 50% 150% 100% 150% Irrigation (in.)

24 Elliott was first cropped in Year 3 while Duke was cropped the following year
 4.")

25 Marketable Fruit Production ( ) Duke Microspray Elliott Microspray 4.5 Sprinkler Sprinkler Yield (ton/acre) Drip Drip caused severe problems with root rot in Duke Drip Microsprays produced highest yields in Elliott (so far) Years after planting Years after planting
26 Summary (healthy plants) Overhead sprinkler Microspray Drip Early growth* 150% ET c 100% ET c Fruit production % ET c (years 4-7) % ET c (years 3-4) Fruit quality Increased fruit firmness Increased mold in Duke Wide range of effects depending on the amount of water applied Consistently increased fruit size & berry ripeness Water use Required only 17-22% of the water needed with sprinklers & microsprays *Sprinklers & microsprays can reduce problems with root rot.
27 Study 2 Nitrogen Fertigation


28 Blueberry Fertigation Goal: 4R Nutrient Stewardship Right source Right time Right place Right rate Many new blueberry plantings are irrigated by drip ( Acid-loving plant; prefers NH 4+ -N)
29 Objectives: Compare fertigation to conventional granular fertilizer application Identify the best fertigation rates for maximum growth and production
30 Study was planted in March 2006 Weekly fertigation (liquid urea) 0 lbs/acre N 45 lbs/acre N 90 lbs/acre N 135 lbs/acre N Control Split fertigation (liquid urea) 0 lbs/acre N 45 lbs/acre N 90 lbs/acre N 135 lbs/acre N Control Granular (drip) (ammonium sulfate) 0 lbs/acre N 45 lbs/acre N 90 lbs/acre N 135 lbs/acre N Standard (soil ph 5.9) Granular (microspray) (ammonium sulfate) 0 lbs/acre N 45 lbs/acre N 90 lbs/acre N 135 lbs/acre N
31 Visible Near-infrared (Year 1) (Year 2) Canopy cover (%) Canopy cover (%) Weekly fertigation (drip) Split fertigation (drip) Granular fertilizer (drip) Granular fertilizer (microspray) Weekly fertigation (drip) Split fertigation (drip) Granular fertilizer (drip) Granular fertilizer (microspray) N application (lbs/acre) N application (lbs/acre)
32 (Year 1) (Year 2) Leaf N (%) Leaf N (%) Weekly fertigation Split fertigation Granular (drip) Granular (microspray) Weekly fertigation Split fertigation Granular (drip) Granular (microspray) N application (lbs/acre) N application (lbs/acre) deficient below normal above normal normal excess

")


33 Granular fertilizer (drip or microspray) lbs/acre N Discolored leaves Dead canes Necrotic & senesced leaves Dead plants

34 Weekly fertigation 135 lbs/acre N
 (microspray) Fertilizer")
35 (Year 1) lbs/acre 45 lbs/acre 90 lbs/acre 135 lbs/acre Dead plants (%) Weekly Split Granular Granular fertigation fertigation (drip) (microspray) Fertilizer application


36 Soil solution samplers Soil solution sampler
37 0 lbs/acre N 45 lbs/acre N 90 lbs/acre N 135 lbs/acre N 3 Weekly fertigation 210 Granular (drip) 180 Fertilizer applications NH 4 + -N (ppm) 2 1 NH 4 + -N (ppm) Apr May Jun Jul Aug Sep Oct Nov Apr May Jun Jul Aug Sep Oct Nov Split fertigation 1000 Granular (microspray) 12 Fertilizer applications 800 Fertilizer applications NH 4 + -N (ppm) 9 6 NH 4 + -N (ppm) Apr May Jun Jul Aug Sep Oct Nov Apr May Jun Jul Aug Sep Oct Nov
38 0 lbs/acre N 45 lbs/acre N 90 lbs/acre N 135 lbs/acre N Electrical conductivity (ms cm -1 ) Weekly fertigation Electrical conductivity (ms cm -1 ) Granular (drip) Fertilizer applications Apr May Jun Jul Aug Sep Oct Nov Apr May Jun Jul Aug Sep Oct Nov Electrical conductivity (ms cm -1 ) Split fertigation Fertilizer applications Electrical conductivity (ms cm -1 ) Granular (microspray) Fertilizer applications Apr May Jun Jul Aug Sep Oct Nov Apr May Jun Jul Aug Sep Oct Nov
39 0 lbs/acre N 45 lbs/acre N 90 lbs/acre N 135 lbs/acre N 200 Weekly fertigation 200 Granular (drip) Fertilizer applications NO 3 - -N (ppm) NO 3 - -N (ppm) Apr May Jun Jul Aug Sep Oct Nov Apr May Jun Jul Aug Sep Oct Nov Split fertigation 500 Granular (microspray) 150 Fertilizer applications 400 Fertilizer applications NO 3 - -N (ppm) NO 3 - -N (ppm) Apr May Jun Jul Aug Sep Oct Nov Apr May Jun Jul Aug Sep Oct Nov 2007
 30 25 20 6 5 4 3 Weekly fertigation (drip) Split fertigation (drip) Granular fertilizer (drip)")
 Granular fertilizer (microspray) 0 45 90 135 N application (lbs/acre) N")
40 Visible Near-infrared (Year 1) (Year 2) Canopy cover (%) Canopy cover (%) Weekly fertigation (drip) Split fertigation (drip) Granular fertilizer (drip) Granular fertilizer (microspray) Weekly fertigation (drip) Split fertigation (drip) Granular fertilizer (drip) Granular fertilizer (microspray) N application (lbs/acre) N application (lbs/acre)
41 (Year 1) (Year 2) Leaf N (%) Leaf N (%) Weekly fertigation Split fertigation Granular (drip) Granular (microspray) Weekly fertigation Split fertigation Granular (drip) Granular (microspray) N application (lbs/acre) N application (lbs/acre) deficient below normal above normal normal excess
42 Most Important Findings in Years 1 & 2: 1. Weekly fertigation was better than granular fertilizer or split fertigation but required much more N fertilizer than granular. 2. Granular fertilizer applied at high rates damaged or even killed the plants and at lower rates was ineffective with drip. 3. Ammonium sulfate was no better than urea at reducing soil ph (5.2 by end of year 1) Right form.
 (drip) (ammonium (urea) sulfate) 0 lbs/acre N 60 45")
 (ammonium sulfate) 60 120 180 0 lbs/acre N 45 lbs/acre N 90 lbs/acre N 135 lbs/acre")
43 Changed two of the treatments in 2008 (Year 3) Continuous fertigation (N-pHURIC) 120 lbs N/acre Weekly fertigation (liquid urea) 0 lbs/acre N 45 lbs/acre N 90 lbs/acre N 135 lbs/acre N Granular Granular (microspray) (drip) (ammonium (urea) sulfate) 0 lbs/acre N lbs/acre N lbs/acre N lbs/acre N Weekly Split fertigation (ammonium (liquid urea) sulfate) 0 lbs/acre N lbs/acre N lbs/acre N lbs/acre N Granular (microspray) (ammonium sulfate) lbs/acre N 45 lbs/acre N 90 lbs/acre N 135 lbs/acre N
44 0 lbs/acre N 60 lbs/acre N 120 lbs/acre N 180 lbs/acre N NH 4 + -N (ppm) Weekly fertigation (urea) NH 4 + -N (ppm) Granular (urea) Fertilizer applications Apr May Jun Jul Aug Sep Oct Nov Apr May Jun Jul Aug Sep Oct Nov NH 4 + -N (ppm) Weekly fertigation (ammonium sulfate) N-pHURIC NH 4 + -N (ppm) Granular (ammonium sulfate) 3000 Fertilizer applications Apr May Jun Jul Aug Sep Oct Nov Apr May Jun Jul Aug Sep Oct Nov
45 0 lbs/acre N 60 lbs/acre N 120 lbs/acre N 180 lbs/acre N Electrical conductivity (ms cm -1 ) Weekly fertigation (urea) Electrical conductivity (ms cm -1 ) Granular (urea) Fertilizer applications Apr May Jun Jul Aug Sep Oct Nov Apr May Jun Jul Aug Sep Oct Nov Electrical conductivity (ms cm -1 ) Weekly fertigation (ammonium sulfate) N-pHURIC Electrical conductivity (ms cm -1 ) Granular (ammonium sulfate) 25 Fertilizer applications Apr May Jun Jul Aug Sep Oct Nov Apr May Jun Jul Aug Sep Oct Nov
 800 Granular (ammonium sulfate) NO 3 - -N (ppm) 600 400 200 N-pHURIC NO 3 - -N (ppm) 600")
46 0 lbs/acre N 60 lbs/acre N 120 lbs/acre N 180 lbs/acre N 800 Weekly fertigation (urea) 800 Granular (urea) Fertilizer applications NO 3 - -N (ppm) NO 3 - -N (ppm) Apr May Jun Jul Aug Sep Oct Nov Apr May Jun Jul Aug Sep Oct Nov Weekly fertigation (ammonium sulfate) 800 Granular (ammonium sulfate) NO 3 - -N (ppm) N-pHURIC NO 3 - -N (ppm) Fertilizer applications 0 Apr May Jun Jul Aug Sep Oct Nov Apr May Jun Jul Aug Sep Oct Nov 2008

47 Plants were first cropped in 2008 (Year 3)
![Fertigation (ammonium sulfate) - [previously split fertigation] Fertigation (urea) Granular (ammonium sulfate) Granular (urea) - [previously granular](/docs-images/89/100349677/images/48-1.jpg "(drip)] Yield (kg/plant) 1.2 1.0 0.8 0.6 0.4 0.2 0.0 a a a a a b 2008 (Year 3) F ** N ** F xn ** a a a 0 60 120 180 b a a b b Yield (kg/plant) 2.2 2.")
 F ** N ** F xn * 0 75 150 225 a a a a a ab bc c N application (lb/acre) N application (lb/acre) N application")
48 Fertigation (ammonium sulfate) - [previously split fertigation] Fertigation (urea) Granular (ammonium sulfate) Granular (urea) - [previously granular (drip)] Yield (kg/plant) a a a a a b 2008 (Year 3) F ** N ** F xn ** a a a b a a b b Yield (kg/plant) a a b b 2009 (Year 4) a a a a a ab a NS F N ** F xn ** b a a b b Yield (kg/plant) a a a a a a ab b 2010 (Year 5) F ** N ** F xn * a a a a a ab bc c N application (lb/acre) N application (lb/acre) N application (lb/acre) 1 kg = 2.2 lbs
49 Most Important Findings in Years 3-6: 1. Weekly fertigation produced higher yields than granular ammonium sulfate but less N fertilizer was needed than the first 2 years. 2. Soil EC was again very high when N fertilizer was applied as granular ammonium sulfate but less when applied as granular urea.
50 Study 3 Water & Fertilizer Placement

51 Correct Location Many growers use two lines of drip Why?
52 Greenhouse evidence for no lateral transfer of water Shoot dry weight g Leaf dry weight 12.8 g Number of new shoots 16 Avg. shoot length 9 mm Large, well-developed root system Shoot dry weight 23.0 g Leaf dry weight 4.5 g Number of new shoots 6 Avg. shoot length 3 mm Small, poorly-developed root system Irrigated Non-irrigated Abbott & Gough (1986)
53 Greenhouse evidence for no lateral transfer of nutrients Shoot dry weight 50.0 g Leaf dry weight 3.7 g Number of new shoots 6 Large, well-developed root system Shoot dry weight 11.5 g Leaf dry weight 1.3 g Number of new shoots 2 Small, poorly-developed root system Fertilized Non-fertilized Gough (1984)


54 Field site 6-year-old Elliott blueberry plants
55 Irrigation treatments Irrigate west side only Control Irrigate east side only Drip laterals Drip lateral Drip lateral Drip laterals Wetting front Wetting front Each treatment received the same amount of water Wetting front
56 Fertilizer treatments Fertilize west side only Control Fertilizer east side only N fertilizer N fertilizer N fertilizer N fertilizer NH + 4 NH + NH NH + NH NH + 4 NH + NH + 4 NH NH + 4 NH + 4 NH + 4 NH + 4 NH + 4 NH + 4 Each treatment received the same amount of fertilizer An unfertilized treatment was also included


57 All measurements were taken on the east and west sides of the plants separately
58 Soil water content m depth Irrigation on both sides Irrigation on west side only Irrigation on east side only 40 West side of the row 40 East side of the row Soil water content (%) Soil water content (%) Jun 1 Jun 15 Jun 29 Jul 13 Jul 27 Aug 10 Aug 24 Sep 7 5 Jun 1 Jun 15 Jun 29 Jul 13 Jul 27 Aug 10 Aug 24 Sep Measured by TDR
59 Plant water status H o : Lower water potential on un-irrigated side of the plant Stem water potential (MPa) z West side East side Avg. of both Irrigation of plant of plant sides of plant Both sides a y a a West side only b c b East side only a b a Significance * ** ** z Average of measurements collected weekly from 15 June to 31 Aug y Means were separated within columns using Fisher s protected LSD at the 0.05 level. *, ** = P < 0.05 and P < 0.01, respectively. Measured at midday on bagged leaves using a pressure bomb


60 New shoot production Irrigate west side only Irrigate both sides
61 New shoot production H o : Fewer new shoots on un-irrigated side of plant New shoots (no./plant) z West side East side Total of both Irrigation of plant of plant sides of plant Both sides 4.7 a y 6.0 a 10.7 a West side only 2.3 b 1.9 b 4.3 c East side only 3.7 ab 3.4 ab 7.0 b Significance * * ** z Shoots were counted 6 Aug y Means were separated within columns using Fisher s protected LSD at the 0.05 level. *, ** = P < 0.05 and P < 0.01, respectively.
62 Fruit production H o : Less yield on un-irrigated side of the plant Three-year total ( ) Marketable yield (kg/plant) West side East side Total of both Irrigation of plant of plant sides of plant Both sides a z 11.9 a West side only b 9.8 b East side only ab 10.1 b Significance NS * * y Means were separated within columns using Fisher s protected LSD at the 0.05 level. NS, * = non-significant and P < 0.05, respectively. Yield differences among treatments were a function of both fruit size and fruit number per plant
63 Plant N status H o : Lower leaf N% on unfertilized side of the plant Leaf N concentration (%) West side East side Avg. of both N fertilizer of plant of plant sides of plant Both sides a z 1.75 a West side only b 1.64 bc East side only ab 1.68 ab None b 1.58 c Significance NS * * y Means were separated within columns using Fisher s protected LSD at the 0.05 level. NS, * = non-significant and P < 0.05, respectively. Only 0 N (none) had any effect on yield and only after 3 years
 Handle Computer")
")

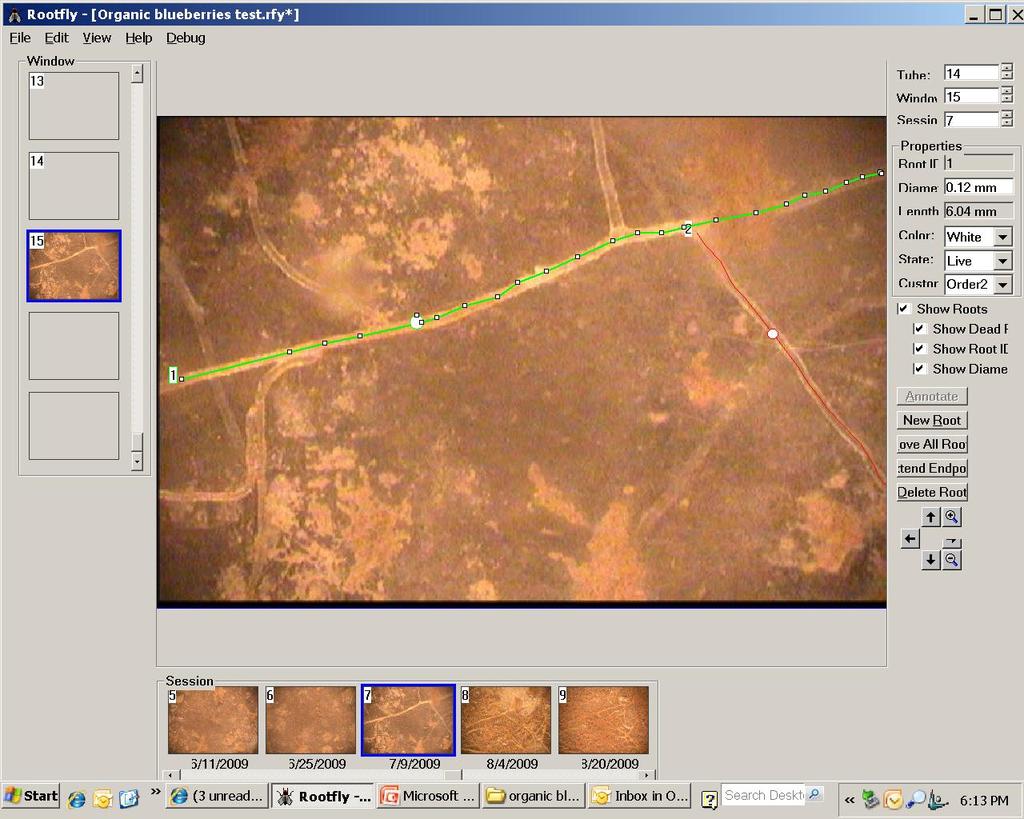
64 What s happening belowground? (root imaging) Handle Computer Camera & light source Power source Minirhizotron tube (clear) Figure 1. Minirhizotron camera system for monitoring root development in soil.
65
66 Early Root Imaging Results 1. Unfertilized plants produced 2 to 2½ times more roots than fertilized plants. 2. Unfertilized plants tended to produce deeper roots than fertilized plants irrigated by either microsprays or drip or unfertilized plants irrigated by microsprays. 3. Three times as many roots were produced on the east side of the plants than on the west side, regardless of treatment.
67 Conclusion: Location is important in blueberry, as expected but the reason for it was unexpected West side only Control East side only Drip laterals Drip lateral Drip lateral Drip laterals 1. Water applied to only one side reduced shoot & fruit production; N fertilizer applied to only one side reduced leaf N% 2. No evidence for lateral isolation of water & nutrients 3. Plant water & nutrient status were higher when irrigation & fertilizer were applied to the east side than to the west side
68 Study 4 Cultivar Comparisons
 Six cultivars Earliblue Draper Elliott")

69 Influence of Application Method (planted Oct. 2008) Six cultivars Earliblue Draper Elliott Duke Bluecrop Aurora Three irrigation/fertigation methods Drip (2 lines) Microspray KISSS


70 Drip treatment Level raised planting beds Drip laterals are located 8 from each side of the plants and covered with sawdust


71 Microspray treatment Rectangular spray pattern (5 x 10 )


72 KISSS (Kapillary Irrigation Sub Surface System) Line source instead of point source of water & fertilizer
73 Irrigation systems Drip (two lines) Microsprays KISSS (one line) Drip lateral Drip lateral KISSS lateral Wetting front Wetting front Wetting front

74 Bluecrop Drip Microspray KISSS

75 Elliott Drip Microspray KISSS
76 Why is KISSS better? Drip (two lines) Microsprays KISSS (one line) Drip lateral Drip lateral KISSS lateral NH 4 + NH 4 + NH 4 + NH 4 + NH 4 + NH 4 + NH 4 + NH 4 + NH + 4 NH + 4 NH + 4 NH + 4 Wetting front Wetting front Wetting front
77 Fruit Production (Year 3) 1 kg = 2.2 lbs Yield (kg/plant) Irrigation method Earliblue Duke Draper* Bluecrop Elliott Aurora Drip 0.8 a 1.2 b 1.4 a 1.8 a 2.3 a 1.7 a Drip (low N) 0.9 a 1.3 ab 1.2 a 1.7 a 2.0 b 1.4 bc Microspray 0.6 b 1.2 b 1.2 a 1.3 b 1.7 c 1.2 c KISSS 0.7 ab 1.5 a 1.4 a 1.9 a 2.4 a 1.6 ab *Healthy plants only; Draper developed problems with root rot. 1. Yield was similar between Drip and KISSS in each cultivar but lower with Microsprays 2. With drip, low N had no effect on yield in the early- and midseason cultivars but reduced yield in the late-season cultivars
78 Study 5 Rapid Field Establishment
 Optimize timing & placement of fertilizer for rapid field establishment Conventional & alternative fertilizers, e.g., slow-release, humic acids Pre-plant fertilizers Fertilizer timing")
79 More on Fertilizer Source, Timing & Placement (planted Oct. 2010) Optimize timing & placement of fertilizer for rapid field establishment Conventional & alternative fertilizers, e.g., slow-release, humic acids Pre-plant fertilizers Fertilizer timing
80 Current Drip Recommendations During Establishment 1. Use two lines of drip per row. 2. Locate lines far enough away from the plants to avoid root rot & far enough apart to avoid too much overlap of the irrigated drip zone. 3. Use fertigation but 4. Either move the drip lines closer to the plants the first few months after planting or make a couple small applications of granular fertilizer or use slowrelease fertilizer to establish the plants.
81 Graduate students: Oscar Vargas Luciane Letzke Acknowledgements Cooperators Bernadine Strik (OSU) Rui Machado (U. Evora) Technical Support Amber Shireman Will Fummerton OSU undergrads Wei Yang (OSU) David Ehret (Ag Canada) Bob Linderman (retired) Funding Oregon Blueberry Commission Northwest Center for Small Fruit Research Fall Creek Farm & Nursery
82 Irrigation System Maintenance
83 Uniformity of Water Application Common assumption: Irrigation water is applied uniformly across the field Uniform distribution of water
84 Uniformity of Water Application Reality: All irrigation systems apply water non-uniformly Drought stress Deep percolation Deep percolation Non-uniform distribution
85 Uniformity of Water Application Goal: Avoid drought stress & yield loss All plants are well irrigated Deep percolation NH 4 + H 2 PO 4 - K + Deep percolation NO 3 - NO 3 - NO 3 - NO 3 - Non-uniform distribution NO 3 - NO 3 -
86 Distribution Uniformity DU LQ = Average depth of application in the lowest quarter of the field Average depth of application in the entire field X 100 where DU LQ is the Low Quarter Distribution Uniformity
87 Target Distribution Uniformity Quality Distribution uniformity of irrigation system Drip Sprinklers Excellent, but >90% >80% Good* 85% 70% Fair 70-80% 50-65% Poor <70% <50% *Target range.
88 Distribution uniformity (%) Washington Berry Fields Good Fair Poor Blueberry Raspberry Failed Evaluation rank *From Walters et al.
89 Non-Uniformity with Drip System component Factors causing non-uniformity 1. Differences in discharge - Manufacturer variation between emitters - Soil differences (if emitters are buried) - Temperature differences along the lateral - Zone & hose pressure differences - Different emitter types in the same field - Plugged emitters 2. Volumes applied not - Variations in plant spacing are not proportional to plant area matched by emitter spacing or (assuming same plant age) scheduling - Unequal discharge during start-up and drainage

90 Regular irrigation system evaluations provides helpful information for improving distribution uniformity