LIFE CYCLE INVENTORY OF FIVE PRODUCTS PRODUCED FROM POLYLACTIDE (PLA) AND PETROLEUM-BASED RESINS SUMMARY REPORT
|
|
|
- Alban Rodgers
- 5 years ago
- Views:
Transcription
1 LIFE CYCLE INVENTORY OF FIVE PRODUCTS PRODUCED FROM POLYLACTIDE (PLA) AND PETROLEUM-BASED RESINS SUMMARY REPORT Prepared For ATHENA INSTITUTE INTERNATIONAL By FRANKLIN ASSOCIATES, A DIVISION OF ERG PRAIRIE VILLAGE, KS November 2006
2 ACKNOWLEDGMENTS The Athena Institute would like to gratefully acknowledge the support provided for this research in the form of direct funding, data and other information from plastics industry stakeholders. DISCLAIMER Although the Athena Institute has done its best to ensure accurate and reliable information in this report, the Institute does not warrant the accuracy thereof. If notified of any errors or omissions, the Institute will take reasonable steps to correct such errors or omissions. This report should not be used to make specific statements about product systems unless the statements are clearly supported by the Life Cycle Inventory (LCI) results and are accompanied by a reference to the publicly available full report. However, this study does not meet all the ISO series data quality requirements for use in making general comparative assertions regarding the overall environmental superiority or preferability of one system relative to a competing system or systems, and the use of this study as the sole basis for general comparative assertions of this nature is discouraged. Use of the study results for advertising purposes (e.g., public assertions or comparative assertions) should comply with Federal Trade Commission (FTC) Guides for the Use of Environmental Marketing Claims (16 CFR Part 260) and ISO series guidelines. Athena Institute and Franklin Associates are not responsible for use of the study results by any party in a way that does not fully conform to the guidelines described above. Text 2006 Athena Sustainable Materials Institute Athena Sustainable Materials Institute 28 St. John Street, P.O. Box 189 Merrickville, Ontario, Canada, K0G 1N0 Tel: Fax: info@athenasmi.ca
3 Foreword The focus of this report is on comparative life cycle inventory (LCI) results for the production of various kinds of plastic consumer products made from petroleum-and biobased resins. The Athena Institute was pleased to have the opportunity to commission the work because we have long been concerned about the general tendency to identify environmentally preferable products or processes solely on the basis of specific attributes. While there is often an intuitively appealing basis for claims about recycled content, renewability, or the relative merits of bio-based products, the claims do not always stand up to objective analysis. In some cases it depends on the situation and in other cases on how comprehensively we examine the relative effects. Life cycle assessment is the method by which we can more fully assess the environmental effects associated with products and processes, and better understand the trade-offs that may be implicit in purchasing or production decisions. There is an intuitive appeal of plastics made from a bio-based resin such as NatureWorks PLA made from corn grain versus those made from petroleum-based resins. Fossil fuel depletion is certainly a major concern for society; it is in fact one of the key environmental impact measures used in LCA. So even though the production of hydrocarbon-based polymers uses only approximately 3% of the oil and natural gas extracted each year, it seems reasonable to applaud and support any substitution of a hydrocarbon product with one derived from agriculture. However, intensive cropping (especially with irrigated crops) depletes the soil and we must equally be concerned about the degradation of cropland as a natural resource. We should also be cognizant of the implications of using food crops to make consumer products, thereby diverting land from growing food for a relentlessly growing world population. As well, there is a rapidly growing demand for corn to be used in the manufacture of ethanol, another means by which we can reduce our dependence on fossil fuels. It s important to ask which of these competing uses of cropland will have a more beneficial environmental effect. One could also cite considerations such as the possible requirement for more water or the use of ancillary materials such as nitrogen fertilizer, pesticides and herbicides to grow corn as compared to many other crops. The point is that all of these factors are relevant to any comparison and we have to bring as much science and objectivity to bear on the decisions as possible. We also have to exercise care to include all of the life cycle activities necessary for the manufacture, use, and disposal of final products, and not focus on just the production of a particular material. At the disposal end of the life cycle, we again encounter tendencies to highlight potential environmental benefits that don t necessarily match reality in terms of what is currently happening or possible. For example, when conventional plastics are placed in a landfill, excavation data shows that they degrade very slowly, if at all, in a 100-year time frame. While this isn t positive from a landfill capacity perspective, it does mean that carbon is sequestered and air and water pollution is minimized. While some bio-based plastics are biodegradable, we really don t know what will happen when these bio-based plastics are placed in a landfill because there is very little relevant data. Dr. Rathje s University of Arizona Garbage Project landfill excavation data shows that readily degradable paper
4 does not actually degrade quickly in the landfill environment; 50 year old newspapers from landfills were still perfectly readable. If it does degrade anaerobically, the data for paper products indicates that the resulting site-dependent emissions may include methane, carbon dioxide or more complex chemicals. The fact is that claims about the bio-degradability benefits of bio-based plastics are in the realm of conjecture until we have more experience and data. A similar problem of inadequate data prevails when we look at other end-of-life possibilities. For example, PLA could be composted if a community has a composting facility, while most conventional plastics cannot. But some report that PLA degrades only with difficulty, and will not degrade in a home composting project, which means reliance on a commercial operation. Again, we simply don t know enough at this stage. If we look at incineration of solid waste, the merits of PLA are more apparent. Conventional plastics produce carbon dioxide, water and lower levels of other compounds if the incineration is conducted in an optimum manner. If not, the combustion products may contain carbon monoxide and possibly other toxic emissions. The carbon emissions increase the level of greenhouse gases in the atmosphere. If PLA is incinerated, the same results could be expected as for conventional plastics. A major difference, however, is that the carbon is of biomass origin, so its return to the atmosphere is part of a natural cycle and would not be viewed as a contribution to increased greenhouse gases. Recycling is especially notable because conventional plastics can be recycled, although the levels of recycling are often not very high. PLA is theoretically recyclable, but there are not sufficient products in the market to test the feasibility of routine recycling. The reality in this case is that PLA cannot be mixed with other plastics for recycling, so networks specifically aimed at PLA are necessary. In fact, if PLA bottles are mixed with PET bottles, they have the potential to harm the existing extensive PET recycling infrastructure because of the incompatibility of the two materials. This is not to say that we shouldn t encourage the development of appropriate infrastructure and work toward a day when all kinds of plastics can be routinely recycled. But we have to be cautious that we don t lose more than we gain in the shorter term. In general, then, the world of plastics is no less complex than any of the other environmental issues that we face. There are no simple, black and white answers. While this report doesn t cover all of the issues to the same extent, or to the degree that may be warranted, it does provide hard data on the environmental flows associated with comparable plastic products made from bio-based and petroleum-based resins. We trust that it will help shift the discussion from a fairly simplistic focus on attributes toward a more scientific and objective analysis of true environmental performance. As readers will see from the results presented here, there is no clear winner in this comparison; there is an identification of trade-offs, which is as it should be. Wayne Trusty President, Athena Institute November 2006
5 Contents 1 INTRODUCTION GOAL, SCOPE AND BOUNDARIES LCI METHODOLOGY SYSTEMS STUDIED DATA SOURCES, LIMITATIONS AND ASSUMPTIONS LCI RESULTS ENERGY SOLID WASTE ENVIRONMENTAL EMISSIONS...133
6 LIFE CYCLE INVENTORY OF FIVE PRODUCTS PRODUCED FROM PLA AND PETROLEUM-BASED RESINS SUMMARY REPORT 1 Introduction This is the summary of a detailed technical report on a Life Cycle Inventory (LCI) of five products 16-ounce cups, 2-piece 16-ounce deli containers, envelope window film, foam meat trays, and 12-ounce water bottles produced from corn-based polylactide (PLA) and various petroleum-based resins. Most of the PLA products are already in the marketplace. The results of this study can be used to evaluate the environmental footprint of these five products. This study was conducted for Athena Institute International by Franklin Associates, a Division of ERG, as an independent contractor. At Franklin Associates, the project was managed by Melissa Huff, who served as primary life cycle analyst in researching, analyzing results, and developing the report. James Littlefield assisted with modeling, review, and editing. Beverly Sauer also provided a quality assurance review of the report. William E. Franklin provided overall project oversight as Principal in Charge. 2 Goal, Scope and Boundaries The principal goal of this study is to evaluate the energy and emissions associated with the production and disposal of various products made from PLA resin and petroleumbased plastic resins currently and soon-to-be in the market, in order to develop a better understanding of the key factors affecting their environmental profiles. The focus is on comparing actual products using PLA and petroleum-based resins, as opposed to comparing resins on a weight basis; the latter is misleading because final product weight is a key factor in the analysis and different products from different resins have diverse weights. Moreover, consumers use an aluminum can, not a pound of aluminum, and it is therefore important to take the weight-based data and translate it into actual products that the public uses. The resin weight data is therefore multiplied by the appropriate weighting factors to reflect their use in a defined product, and then combined to model a product system on an equivalent use basis. This analysis includes the following four steps for each product: 1. Production of the product materials, which includes all steps from the extraction of raw materials through the production of the product resins. 2. Transportation of the product resins to fabrication. 3. Fabrication of the products from their resins. 1
7 4. Postconsumer disposal of the products, including landfill and combustion of mixed municipal solid waste (MSW). Transportation of the fabricated product, printing, and use of the product by consumers are assumed to be equivalent for all resin systems within each product category studied and are not included in this study. Environmental emissions associated with end-of-life management of the products are not part of the scope of this analysis. Only landfilling and combustion of the products are analyzed for end-of-life management. Other end-oflife scenarios are possible for most of the products, but the other scenarios are relatively insignificant and we have focused on those that are more relevant. To make this report as transparent as possible, only publicly available data were used for the resins and product fabrication processes. 2.1 LCI Methodology This LCI is essentially a cradle-to-grave analysis, covering steps from raw material extraction through product disposal. The methodology used for goal and scope definition and inventory analysis in this study is consistent with the methodology for Life Cycle Inventory (LCI) as described in the ISO and Standard documents. A life cycle inventory quantifies the energy consumption and environmental emissions (i.e., atmospheric emissions, waterborne wastes, and solid wastes) for a given product based upon the study scope and boundaries established. However, the study departs from being a strict LCI by including a calculation of global warming potential effects for the various products. The global warming potentials used in this study were developed in 2001 by the International Panel of Climate Change (IPCC). The 100 year GWP used are as follows: fossil carbon dioxide -1, methane - 23, nitrous oxide - 296, CFC/HCFCs , methylene chloride - 10, HCFC The five products can be manufactured using PLA resin and various petroleum-based resins. No secondary packaging is considered in this analysis; only the primary product is analyzed. Flow diagrams of the resins and the total life-cycle systems are shown for each of the products in the detailed technical report. 3 Systems Studied The drink cups in this analysis are 16-ounce cold drink cups. Common resins for this cup include high-impact polystyrene (HIPS), polyethylene terephthalate (PET), and polypropylene (PP). The weight data for the cups in this analysis, including those made from PLA, were provided by one company that produces all the types of cups studied. The deli containers in this analysis are 16-ounce 2-piece deli containers. However, two types of deli containers are considered in this analysis: a light-weight deli container used more commonly for hand-packing (PLA and general purpose polystyrene (GPPS)) and a heavier-weight deli container used more commonly for automated packing (PLA and PET). Two companies provided samples, which were weighed by Franklin Associates staff. One company provided lightweight deli containers of both PLA and GPPS, while the other provided heavier-weight deli containers of both PLA and PET. The deli container weights include both the container and flat lid. 2
8 The envelope windows are a standard gauge of (1.15 mil). Weights for the envelope windows in this analysis were taken from the Alcoa Kama website for GPPS and from the Plastic Suppliers website for PLA. The foam meat tray (#2 size) is the only product in this analysis where PLA is not already established in the market. Trials are being performed on PLA foam to be used for meat trays by various manufacturers. NatureWorks, LLC, the producer of NatureWorks PLA resin, was consulted along with other experts in foaming technology and it was estimated that the PLA foam meat tray is 5 percent heavier than the corresponding polystyrene foam (GPPS foam) meat tray. One company provided weights for the GPPS foam meat tray. The final product analyzed is the 12-ounce water bottle. The main resin used for water bottles is PET. Samples were purchased and weighed by Franklin Associates staff. The PLA water bottle weights were provided by a bottle producer. The weights of all products studied are shown in Table ES-1. In order to express the results on an equivalent basis, a functional unit of equivalent consumer use was chosen for 4 of the 5 products in this analysis. 16-ounce cold cups 10,000 cups 16-ounce 2-piece deli containers 10,000 deli containers Foam meat trays 10,000 meat trays 12-ounce water bottles 10,000 water bottles The envelope window film comparison is based on an equivalent area and gauge (1,000,000 square inches for a gauge of 0.115). 4 Data Sources, Limitations and Assumptions Although PLA resin is readily available in North America, Europe, and Asia, it was assumed that the majority of processes for the life cycles of the products occur in the United States. To make this report as transparent as possible, only publicly available data were used for the resins and product fabrication processes. The PlasticsEurope database was used for the petroleum-based resins as well as the fabrication of the products because there is not yet a publicly available database in the United States for these resins. Dr. Erwin Vink provided a journal paper, currently under peer review, that included NatureWorks 2005 and 2006 PLA data. Jim Nangeroni of NatureWorks provided information on the fabrication of PLA resin into products. Various contacts at product fabrication facilities also provided product fabrication information and product weights. In the 2006 update, NatureWorks reports that as of January 2006 they had purchased wind power derived renewable certificates to offset their entire requirement for electricity at their Nebraska facility. There are large differences in the 2005 versus 2006 PLA datasets as a result of the credit given for this purchase of wind energy vouchers (e.g., a 3
9 Table 1-1 WEIGHTS FOR VARIOUS PRODUCT APPLICATIONS FOR PLA AND PETROLEUM-BASED PLASTIC PRODUCTS Products Weight per unit Weight per functional unit (oz) (g) (lb) (kg) 16-ounce cold drink cup (Basis: 10,000 cups) PLA HIPS PET PP Clear 16-ounce 2-piece deli container (Basis: 10,000 2-piece containers) (1) Light-Weight (2) PLA GPPS Heavy-Duty (2) PLA PET Envelope window film (Basis: 1,000,000 sq. inches) PLA GPPS Foam meat tray (Basis: 10,000 trays) (3) PLA Foam GPPS Foam ounce water bottle (Basis: 10,000 bottles) PLA PET (1) This weight includes both the container and a flat lid. Samples of lids and containers were weighed and averaged separately, then the averages were summed. (2) Light weight deli containers are packed by hand, while heavy duty deli containers are filled using automated packing. The PET resin is commonly used for the automated packing, while the GPPS is commonly used for hand packing. (3) This foam meat tray is commonly used for 1 pound packs of ground beef. Source: Franklin Associates, a Division of ERG reduction of 33% in the life cycle requirement for non-renewable energy as compared to a 2005 baseline). However, NatureWorks does not access this wind power directly; certificates purchased on an open market help finance added wind power capacity that results in reduced dependence on fossil fuels. Any manufacturer of resin can buy these same certificates and achieve equivalent results. Since the conventional polymers data used in this report are generic rather than brand-specific, it is not possible to credit any such purchases by individual companies and it would therefore be misleading to credit the NatureWorks PLA. Moreover, LCI is an environmental decision making tool that accounts for the actual material and energy flows of a product or system; the inclusion of wind energy credits would be a departure from this goal. In view of the foregoing, only the 2005 PLA datasets were used in this analysis. Franklin Associates staff estimated the energy for the drying of PLA resin, a hygroscopic resin, from specifications found on ConAir s website for the dehumidifying dryer, CD1600. Transportation from the resin producer to the product fabrication was estimated using average distances between various locations of actual U.S. resin plants and product fabrication plants. The disposal of the products includes landfilling of post consumer products, as well as a 20 percent waste-to-energy (WTE) combustion energy credit for the incineration of post consumer products in mixed municipal solid waste. The Franklin 4
10 Associates LCI models were used to calculate fuel production and delivery energy and emissions for drying, resin transportation, and disposal steps. There may be small differences between the Franklin Associates model and the PlasticsEurope model. To provide uniformity among the LCI results, atmospheric and waterborne emissions from the Franklin Associates fuel emissions model were limited to the emissions used in the PlasticsEurope database for consistency in reporting. A common practice in the PlasticsEurope database is the use of <1 for emissions with less than 1 mg of emission per kg of product. In this analysis, the value 1 represents all <1 values given by PlasticsEurope. This is the upper limit of these values, and so some emissions values may be overstated by an unknown amount. 5 LCI Results The LCI results include energy consumption, solid waste generation, and environmental emissions to air and water. A summary of the results for the five products is shown in Table ES-2. In addition, we have calculated the global warming potential impact indicator because of the current interest in, and importance of, that specific measure. Appendix D of the detailed technical report presents an analysis of uncertainty considerations. Based on that analysis, the following significance factors should be kept in mind when reviewing the results. If the energy or post consumer solid waste of one system is 10 percent or more different from another, it can be concluded that the difference is significant. If the weight of industrial solid waste, atmospheric emissions or waterborne emissions of a system is 25 percent different from another, it can be concluded that the difference is significant. Percent difference is defined as the difference between two values divided by the average of the two values. 5.1 Energy The total energy requirements for each system include the energy for manufacturing and transporting materials at each life cycle phase, as well as the energy content of fuel resources used as raw materials. Figures 1 through 5 are based on the energy results shown in Table ES-2. The total energy for each system is shown in Figures 1 through 5, as well as the split of energy required for the two life cycle phases of cradle-to-material and fabrication-to-grave. However, in Figures 4 and 5, the results by category are different than for previous figures due to the availability of complete datasets (cradle-tofabricated product) within the PlasticsEurope database for the PS foam thermoformed meat tray and the PET blow-molded bottle. In these cases, only the energy requirements associated with landfilling and combustion are included in the fabrication-to-grave category shown in the figure. All other energy requirements are captured in the cradleto-material category. Considering the categorization of the two life cycle phases (cradle-to-fabrication and fabrication-to-grave), the thermoformed products use approximately 16 to 20 percent of their energy requirements within the fabrication-to-grave category. In these cases, the 5
11 PLA product usually requires one or two percent more than the petroleum-based product. When comparing PLA to PP or PS, the higher fabrication-to-grave energy for the PLA system is due to its higher weight and extra drying step. In comparison to the PET thermoformed products, the PLA fabrication energy is comparable on a weight basis, but the PET product is heavier, which increases the energy requirements for the PET system. The energy required for the fabrication-to-grave category for the envelope window film is a small amount higher for the PLA again due to the extra drying step and higher weight. According to the methodology of the PlasticsEurope database, Feedstock energy represents the energy of the fuel bearing materials that are taken into the system but used as materials rather than fuels. NatureWorks calculates an amount of feedstock energy for the corn they use as a raw material for PLA resin. Although corn is used to manufacture Table 2 TOTAL ENERGY, POST CONSUMER SOLID WASTE, AND GREENHOUSE GASES FOR PLA AND PETROLEUM-BASED PLASTIC PRODUCTS Total Post consumer Greenhouse Products Energy Solid Waste Gases (GJ) (kg) (kg of CO2 equivalents) 16-ounce cold drink cup (Basis: 10,000 cups) PLA HIPS PP PET ounce 2-piece deli container (Basis: 10,000 2-piece containers) Light-Weight PLA GPPS Heavy-Weight PLA PET ,170 Envelope window film (Basis: 1,000,000 sq. inches) PLA GPPS Foam meat tray (Basis: 10,000 trays) PLA Foam GPPS Foam ounce water bottle (Basis: 10,000 bottles) PLA PET Source: Franklin Associates, a Division of ERG fuel (ethanol), it should be noted that less than 7 percent of the corn grown in the U.S. in 2001 was used for that purpose. The energy content of delivered fuel, or the energy that is received by the final operator who consumes energy, accounts for the largest share of total energy for each of the PLA products. The greatest amount of energy required by category for each of the products made from the petroleum-based resins (HIPS, PP, PET) is feedstock energy. In some cases for the petroleum-based resins, the energy content of 6
12 delivered fuel is within a few percent of the feedstock energy amount. This is generally true of PET products and some polystyrene products. For all products and resins, the energy for transportation fuel is less than 6 percent of the total required energy. It should be noted that NatureWorks suggests to all customers that PLA be kept below 105 degrees Fahrenheit or distortion of the products may occur. If the products are sent to the southwest U.S. during the summer months, refrigeration trucks may be needed to prevent distortion of the products. This would increase the transportation energy for the PLA products. However, this would not increase the transportation energy by a significant amount (estimated 1 to 2 percent of the total energy). At least 50 percent of the total energy required for the PLA products comes from fossil fuels. When petroleum-based resins are used for the products, this percentage is greater than 89 percent. 7
13 8

14 Figure 4 Note: An aggregated dataset was available in the PlasticsEurope Ecoprofiles database for thermoformed polystyrene; therefore, fabrication cannot be separated out for the polystyrene foam meat trays. Only disposal is included in the fabrication-to-grave category. Figure 5 Note: An aggregated dataset was available in the PlasticsEurope Ecoprofiles database for PET bottles; therefore, fabrication cannot be separated out for the PET 12-ounce water bottles. Only disposal is included in the fabrication-to-grave category. 5.2 Solid Waste The PlasticsEurope database provides a large number of industrial (including fuel sources) solid waste categories using the empirical system, which shows solid waste generated. These categories are discussed in greater detail in the individual chapters of this report. No solid waste data were provided by Dr. Vink s journal paper for the PLA 2005 resin. The solid waste data shown for the PLA resin in the chapter tables are 9
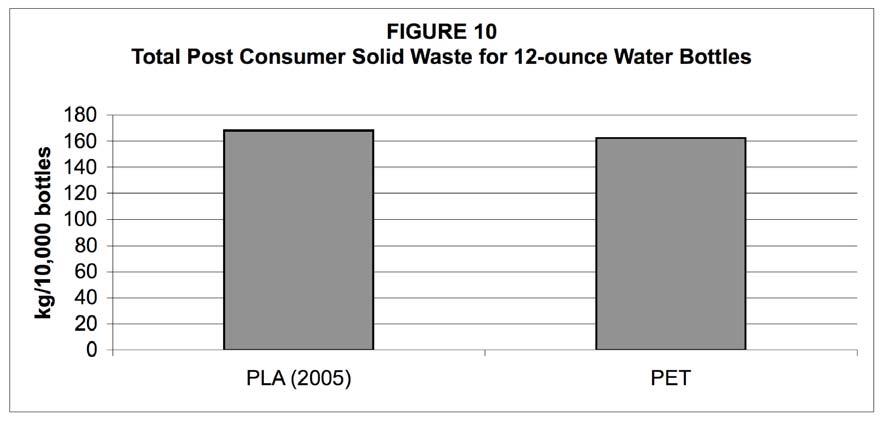
15 estimated from the PLA 2006 dataset and do not include the solid waste credited for the purchase of wind energy credits. Post consumer wastes are the wastes discarded by the final users of the product. As we are including the U.S. average combustion of mixed municipal solid waste, 20 percent of that weight is combusted in waste-to-energy facilities and therefore subtracted out of the total. The total post consumer solid waste for each of the products analyzed are shown graphically in Figures 6 through 10. These figures are based on post consumer solid waste results shown in Table ES-2. The weights of post consumer wastes are directly related to the weight of a product. Therefore, heavier products produce more post consumer solid wastes. If we consider the post consumer solid waste produced by the 16-ounce cold drink cups, the PET cup is the heaviest and so produces the most post consumer solid waste. The PLA cup is lighter than the PET cups, but heavier than the cups made from PP and HIPS. This is true for the deli containers as well. The PLA heavyweight deli container weighs less than the PET deli container; however, the PLA lightweight deli container weighs more than the GPPS deli container. The PLA water bottle does weigh a small amount more than the PET water bottle, and so the PLA water bottle produces more post consumer solid waste; however, this small difference is not considered significant. The PLA envelope window is heavier than the GPPS envelope window and so produces more post consumer solid waste. The weight of the PLA foam meat tray was calculated using the weight of the GPPS foam meat tray after discussions with NatureWorks staff. The PLA foam meat tray was estimated to be 5 percent heavier and so produces more post consumer solid waste. Recycling and composting were not considered in this report. Of the applications analyzed, only the 12-ounce PET bottle would have a recycling rate over two percent. Although PLA is compostable in commercial composting facilities, only a small portion of the U.S. population has access to these facilities and rarely do these facilities accept plastic items. Also, according to literature, PLA is not suitable for backyard composting, thus no credit was given to composting as an end-of-life management practice. 10


16 11

17 12
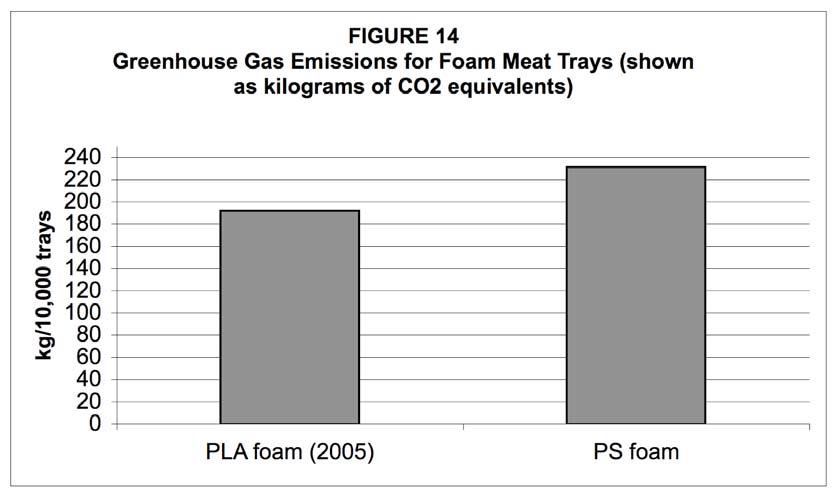
18 5.3 Environmental Emissions Atmospheric and waterborne emissions for each product system are given as individual emission totals of the system. Atmospheric and waterborne emissions arise from both process- and fuel- related activities. The predominant atmospheric emissions from the product systems include greenhouse gases (particularly carbon dioxide, methane, and nitrous oxide), nitrogen oxides, sulfur oxides, particulates (PM10), and hydrocarbons. The predominant waterborne emissions from the container systems include dissolved solids, suspended solids, COD (chemical oxygen demand), BOD (biological oxygen demand), chlorides, and various metals. Comprehensive tables of the atmospheric and waterborne emissions are shown in each product results chapter of the detailed technical report. Greenhouse gas emissions are closely related to system fossil energy, and thus the trends observed for system fossil energy requirements also apply to system greenhouse gas emissions. It should be noted that the PLA (2005) drink cup produces a greater amount of CO 2 equivalents than the PP drink cup. This is due to the fact that much of the fossil fuel used in the PP drink cup is from feedstock energy, which is bound within the product and therefore does not produce greenhouse gases. As noted previously, this analysis is not an LCIA (life cycle impact assessment) and thus the impacts of various environmental emissions are not evaluated. However, we have developed estimates of global warming potential (i.e., green house gas emissions) because of the public interest in this specific measure. Greenhouse gas emissions are expressed as carbon dioxide equivalents, which use global warming potentials (2001 index) developed by the International Panel on Climate Change (IPCC) to normalize the various greenhouse gases to an equivalent weight of carbon dioxide. The carbon dioxide equivalents for the 5 products analyzed are shown graphically in Figures 11 through


19 14

20 15

21 16