Estimation of CO 2 Storage Capacity
|
|
|
- Leonard Hoover
- 5 years ago
- Views:
Transcription


1 Estimation of CO 2 Storage Capacity
2 Assessment Scales and Resolution Country: high level, minimal data Basin: identify and quantify storage potential Regional: increased level of detail, identify prospects Local: very detailed, pre-engineering site selection Site: engineering level for permitting, design and implementation Note: Depending on the size of a country in relation to its sedimentary basin(s), the order of the top two or three may interchange

3 Relationship Between Assessment Scale and Level of Detail and Resolution Bachu et al., IJGGC, 2007
4 Assessment Types Theoretical: physical limit of the system Effective: accounts for geological and engineering cut-offs Practical: accounts for technical, legal and regulatory, infrastructure and economic barriers Matched: obtained by source-sink matching (SSM)


5 Techno-Economic Resource-Reserves Pyramid for CO 2 Storage Capacity Bachu et al., IJGGC, 2007
6 History - 1 Up to 2004, different methods were used by various researchers, based mainly on basin surface area, average basin thickness and an arbitrary fraction for storage, considering CO 2 trapping in free phase or in solution to full saturation, with the following results: Inconsistent methodologies that did not allow comparison Significant discrepancies in assessments Country-scale capacity assessments greater than world-wide assessments Inability to properly advise decision makers about storage potential and resources Deficiencies brought to light during the writing of the IPCC Special Report on CCS (2005) and at the CSLF meeting in 2004, where consequently a Task Force on Estimating CO 2 Storage Capacity was established. First findings of the CSLF Task Force were presented to CSLF (1 st report) and at GHGT-8 in 2006, then published in IJGGC in 2007 (Bradshaw et al., 2007)

7 History - 2 The CSLF Task Force devised consistent volumetric-based methodology for estimating CO 2 storage capacity at the country and basin scales, widely accepted in Europe and elsewhere, for deep saline aquifers, coal beds and hydrocarbon reservoirs, introducing storage efficiency coefficients C but with no numerical values provided (results published in 2 nd CSLF report and in IJGGC, 2007, Bachu et al., 2007) In parallel and independently, the US Regional Partnerships developed similar methodology for the volumetric estimation of CO 2 storage capacity in deep saline aquifers, coal beds and hydrocarbon reservoirs, with values for storage efficiency coefficients E for P15, P50 and P85 developed by using Monte-Carlo simulations. These were used for estimating CO 2 storage capacity in the US, resulting in the first edition of the Atlas of CO 2 Storage Capacity in US and Canada CSLF and USDOE methodologies are equivalent, as shown in the 3 rd report to CSLF in 2008 by the Task Force, with the CSLF methodology providing explicitly for residual gas saturation in the formulae
 Where M is mass, V is the pore space in the rock mass of area A, thickness h and porosity φ, ρ CO2 is CO 2 density and P and T are")
8 CO 2 Storage Capacity Both CSLF and USDOE have shown that CO 2 storage capacity has to be calculated individually for oil and gas reservoirs, coal beds and deep saline aquifers, rather than for full sedimentary basins, according to: M CO2 = E V CO2 ρ CO2 (P, T) Where M is mass, V is the pore space in the rock mass of area A, thickness h and porosity φ, ρ CO2 is CO 2 density and P and T are in-situ pressure and temperature. The irreducible water saturation, S wirr, can be explicitly factored on the above equation (CSLF), but because of lack of data, particularly at the formation scale, it is actually included in the efficiency coefficient E (USDOE). For coal beds, ρ CO2 is at standard conditions of pressure and temperature. The challenge is in estimating the value of the storage efficiency coefficient E!
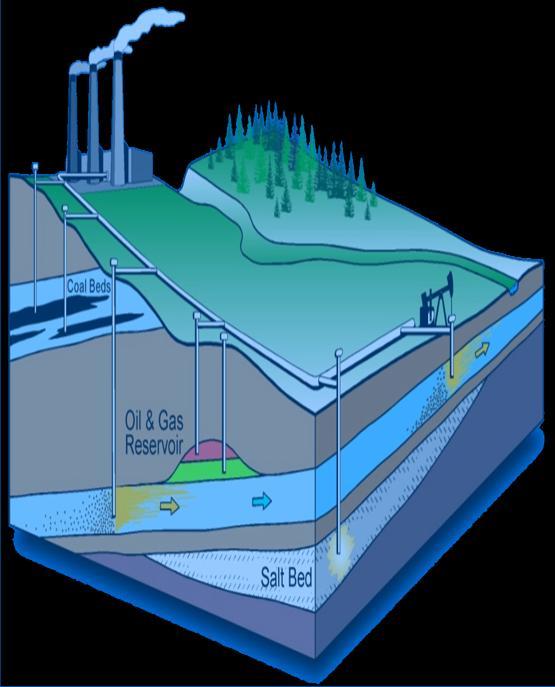
9 Estimation of CO 2 Storage Capacity By storage medium and by scale of assessment: In oil and gas reservoirs In unmineable coal beds In deep saline aquifers
10 Estimation of CO 2 Storage Capacity in Oil and Gas Reservoirs It is done at the reservoir or pool level, which are spatially discrete
11 Theoretical Mass CO 2 Storage Capacity in Depleted Oil Reservoirs Theoretical Capacity or M CO2t = CO2r [ R f OOIP / B f - V iw + V pw ] M CO2t = CO2r [R f A h (1 S w ) V iw + V pw ] M CO2t : Theoretical storage capacity CO2r : CO 2 density at initial reservoir conditions R f : Recovery factor OOIP: Original Oil in Place B f: Formation factor A: Reservoir area h: Reservoir thickness : Porosity S w : Water saturation V iw : Volume of injected water V pw : Volume of produced water
12 Theoretical Mass CO 2 Storage Capacity in Depleted Gas Reservoirs Theoretical Capacity M R (1 F ) OGIP CO2t CO2r f IG P P S r Z Z r S T T r S M CO2t : Theoretical storage capacity CO2r : CO 2 density at initial reservoir conditions R f : Recovery factor OGIP: Original Gas in Place F IG : Fraction of (re-)injected gas P: Pressure T: Temperature ( K) Z: Z-factor (gas compressibility) r,s: reservoir; surface subscripts
13 Effective Mass CO 2 Storage Capacity in Depleted Oil and Gas Reservoirs Effective Capacity M CO2e = C m C b C h C w C a M CO2t C e M CO2t M CO2t : Theoretical storage capacity M CO2e : Effective storage capacity C: Efficiency coefficients Subscripts m: mobility b: buoyancy h: heterogeneity w: water saturation a: aquifer strength t: theoretical e: effective
14 Estimation of CO 2 Storage Capacity in Unmineable Coal Seams It is done at the coalbed level, which is spatially continuous
15 Regional-Scale Mass CO 2 Storage Capacity in Coal Beds Theoretical Capacity Effective Capacity IGIP = ρ CO2 A h ρ coal G c (1 f a f m ) PGIP = R f C IGIP IGIP: Initial Gas in Place (or storage capacity) A: Area of the coal bed (m 2 ) h: Net thickness of the coal bed (m) ρ coal: Coal density, ~1.4 t/m 3 ρ CO2 CO 2 density at STP, = 1.78 kg/m 3 G c : Gas content (cm 3 /g or m 3 /t) f a : Ash fraction f m : Moisture (water) fraction R f : Recovery factor C: Completion factor
16 Coal Gas Content G CS V L P P P L P: Pressure P L : Langmuir pressure V L : Langmuir volume
17 Storage Efficiency Coefficients (%) for Storage in Coal Seams Case P 10 P 50 P 90 When area and thickness are uncertain When area and thickness are certain P x -> there is (1-x)% certainty that this resource exists Goodman et al., IJGGC, 2011
18 Estimation of CO 2 Storage Capacity in Deep Saline Aquifers It is done at the aquifer level, which is spatially discrete in stratigraphic and structural traps, and is spatially continuous in laterally open aquifers


19 Spread of a CO 2 Plume and Storage Efficiency Storage efficiency coefficient E = V CO2 /(πr 2 max)
20 Storage Efficiency Coefficient Dependencies E decreases with increasing buoyancy (low CO 2 density) E decreases with increasing mobility (low CO 2 viscosity) CO 2 density and viscosity increase with increasing temperature E increases with increasing capillary forces E increases with increasing medium heterogeneity Relative permeability and irreducible gas saturation affect storage efficiency
21 Volumetric CO 2 Storage Capacity in Structural and Stratigraphic Traps and Open Deep Saline Aquifers Theoretical Volumetric Capacity V CO2t = V trap (1 S wirr ) A h (1 S wirr ) or, if the spatial variability is known VCO 2t (1 S wirr ) dxdydz Effective Volumetric Capacity V CO2e = E V CO2t V CO2t : Theoretical storage volume V CO2e : Effective storage volume V trap: Trap volume : Porosity S w : Irreducible water saturation A: Average trap area h: Average trap height E: Storage efficiency coefficient
 Zhou et al.")
22 Site-Scale Storage Efficiency Coefficients for Deep Saline Aquifers - 1 No dissolution and precipitation effects are considered over the time scale of CO 2 injection operations (operational or engineering time scale) Zhou et al. (2008), van der Meer and Egbert (2008) and Ehlig-Economides and Economides (2010) considered closed systems, where accommodation space is provided through water and pore compressibility only, arriving at values for the storage coefficient E E = (β p + β w )Δp av < 1% Birkholzer et al. (2009) and Cavanagh et al. (2010) showed that, if caprock permeability is m 2 (0.1 μd) then the system can be considered as being closed, but if caprock permeability is m 2 (1 μd), then E > 1% as a result of additional accommodating space created by the displacement of formation water into the caprock at very low velocity but over a very large area
23 Site-Scale Storage Efficiency Coefficients for Deep Saline Aquifers - 2 Kopp et al. (2009a,b) calculated storage capacity for deep saline aquifers considering relative-permeability, capillary forces, buoyancy and viscosity effects, and the data in the US National Petroleum Council database and arrived statistically at values for E that vary between 1.17% and 3.6% depending on geothermal gradient, depth, and absolute and relative permeability Okwen et al. (2010) developed an analytical expression for the storage efficiency coefficient E in the absence of capillary forces (sharp interface between CO 2 and formation water) and arrived at the following values: o For negligible buoyancy 15%-20% for low mobility ratios between CO 2 and formation water, and 3% to 4% for high mobility ratios between CO 2 and formation water o For non-negligible buoyancy 1% to 17% depending on buoyancy, for low mobility ratios, and 0.1% to 2% depending on buoyancy, for high mobility ratios
, commissioned by IEA-GHG, introduced the concept that the storage efficiency coefficient E has a geological volumetric term E Geol that expresses the pore space available for storage, a")
 displacement processes: E = E geol E v E d Using a database of hydrocarbon reservoir properties for >20,000 reservoirs from around the")
24 IEA-GHG Regional-Scale Storage Efficiency Coefficients Gorecki et al. (2009), commissioned by IEA-GHG, introduced the concept that the storage efficiency coefficient E has a geological volumetric term E Geol that expresses the pore space available for storage, a volumetric displacement term E v that expresses the portion of the pore space occupied by CO 2 as a result of macroscopic displacement in a heterogeneous porous medium, and a microscopic displacement term E d that expresses the effect of microscopic (pore-scale) displacement processes: E = E geol E v E d Using a database of hydrocarbon reservoir properties for >20,000 reservoirs from around the world, Gorecki et al. (2009) calculated probabilistic values P 10, P 50 and P 90 for the storage efficiency coefficient E for various depositional environments using Monte Carlo simulations of CO 2 plume spread for various conditions of depth, pressure, temperature, structure, permeability anisotropy, irreducible water saturation and injection rate.

 arrived at the following values for E Lithology E")

25 IEA-GHG Regional-Scale Storage Efficiency Coefficients for CO 2 Storage in Deep Saline Aquifers At the regional scale, Gorecki et al. (2009) arrived at the following values for E Lithology E P 10 E P 50 E P 90 Clastics Dolomite Limestone P x -> there is (1-x)% certainty that this resource exists
 to arrive at more robust estimates of the value of the CO 2 storage efficiency coefficient E at the formation scale (reproduced below), values used in the 3 rd edition of the National Atlas of")
26 USDOE Efficiency Coefficients for CO 2 Storage in Deep Saline Formations Goodman et al. (2011) used log-odds normal distributions for the data used by Gorecki et al. (2009) to arrive at more robust estimates of the value of the CO 2 storage efficiency coefficient E at the formation scale (reproduced below), values used in the 3 rd edition of the National Atlas of CO 2 Storage Capacity for US and Canada.
27 Storage Efficiency Coefficients (%) for Storage in Deep Saline Aquifers Lithology P 10 P 50 P 90 At regional scale Clastics Dolomite Limestone At local scale Lithology P 10 P 50 P 90 Clastics Dolomite Limestone P x -> there is (1-x)% certainty that this resource exists After Goodman et al., IJGGC, 2011
28 Volumetric CO 2 Storage Capacity in Residual-Gas Traps in Deep Saline Aquifers V CO2t = ΔV trap S CO2t V CO2t : Theoretical storage volume ΔV trap : Volume occupied by CO 2 at irreducible gas saturation : Porosity S CO2t : Saturation of trapped CO 2 It is a time-dependent process, as the CO 2 plume migrates Storage capacity can be determined by numerical simulations only, based on real relative-permeability data

29 Mass CO 2 Storage Capacity in Solution in Deep Saline Aquifers Theoretical Capacity M CO2t A h ( SX CO S 2 0X CO2 0 ) or, if the spatial variability is known CO2 CO2 M CO 2t ( SX S 0 X 0 ) dxdydz Effective Capacity M CO2e = C c M CO2t M CO2t : Theoretical storage capacity A: Aquifer area h: Aquifer thickness : Porosity ρ: Water density X CO2 : Carbon content in formation water C c : Capacity coefficient s,0: saturation and initial, subscripts


30 Applicability of Methodologies for Estimating CO 2 Storage Capacity to Various Assessment Scales
31 Issues The storage capacity coefficients (or storage efficiency coefficients) have been estimated only through numerical simulations and there is debate in regard to their values At actual injection sites, injection limitations and regulatory limits on pressure build-up, CO 2 buoyancy and sweep, and other processes will actually limit the storage capacity to what is called dynamic storage capacity, which is less, sometimes considerably, than the static storage capacity estimated using the methods described Pressure interference between various storage sites may limit injectivity and capacity, or may reduce the space available for a given storage operation Well configurations will affect injectivity, CO 2 behavior in the aquifer or reservoir, and storage capacity Other energy and mineral resources that have primacy over CO 2 storage will limit further storage capacity by excluding pore space from availability
32 Concluding Remarks Any assessment of CO 2 storage capacity should carefully consider the processes involved, their spatial and temporal scales, the resolution of the assessment, and the available data and their quality Proper communication to decision makers of the assumptions made and methodologies used is essential in establishing sound policy and making the best decision regarding CCS implementation
33 Concluding Remarks To the best knowledge of the author, these are the only regional (or formation) scale values for storage efficiency coefficients available in the literature Site-scale storage capacity is/should be evaluated using detailed numerical simulations
34 References Regarding Storage Capacity Estimation 1. CO 2 storage capacity estimation: Issues and development of standards. Bradshaw, J., Bachu. S., Bonijoly, D., Burruss, R., Holloway, S., Christensen, N.P., Mathiassen, O.M. International Journal of Greenhouse Gas Control, v. 1, no. 1, p , doi: /S (07) , CO 2 storage capacity estimation: Methodology and gaps. Bachu, S., J. Bradshaw, D. Bonijoly, R. Burruss, S. Holloway, N.P. Christensen and O-M. Mathiassen. International Journal of Greenhouse Gas Control, v. 1, no. 4, p , doi: /S (07) , A method for quick assessment of CO 2 storage capacity in closed and semi-closed saline formations. Zhou, Q., Birkholzer, J.T., Tsang, C-F., Rutqvist, J., International Journal of Greenhouse Gas Control, v. 2, no. 4, p , doi: /j.ijggc , 2008.
35 References - continued 4. Investigations on CO 2 storage capacity in saline aquifers. Part 1. Dimensional Analysis of flow processes and reservoir characteristics. Kopp., A., Class, H., Helmig, R., International Journal of Greenhouse Gas Control, v. 3, no. 3, p , doi: /j.ijggc , Investigations on CO 2 storage capacity in saline aquifers. Part 2. Estimation of storage capacity coefficients. Kopp., A., Class, H., Helmig, R., International Journal of Greenhouse Gas Control, v. 3, no. 3, p , doi: /j.ijggc , Development of storage coefficients for determining the effective CO2 storage resource in deep saline formations. Gorecki, C.D., J.A. Sorensen, J.M. Bremer, D. S.S. Smith, E. N. Steadman, and J.A. Harju. SPE Paper , 2009.

36 References - continued 7. Analytical solution for estimating storage efficiency of geologic sequestration of CO 2. Okwen, R.T., Stewart, M.T., Cunningham, J.A., International Journal of Greenhouse Gas Control, v. 4, no. 1, p , doi: /j.ijggc , U.S. DOE methodology for the development of geologic storage potential for carbon dioxide at the national and regional scale. Goodman, A., Hakala, A., Bromhal, G., Deel, D., Rodosta, T., Frailey, S., Small, M., Allen, D., Romanov, V., Fazio, J., Huerta, N., McIntyre, D., Kutchko, B., Guthrie, G., International Journal of Greenhouse Gas Control, v. 5, no. x, p , doi: /j.ijggc , 2011.

37 Contact: Dr. Stefan Bachu Alberta Innovates Technology Futures Associate Editor (Storage)