GHG emissions from an Integrated Solid Waste Management System: the case of Dubrovnik-Neretva County/Croatia
|
|
|
- Matilda Harris
- 5 years ago
- Views:
Transcription
1 GHG emissions from an Integrated Solid Waste Management System: the case of Dubrovnik-Neretva County/Croatia E. Ieremiadi 1, C. Tsompanidis 1, T. Lolos 1, G. Lolos 1 1 ENVIROPLAN S.A., Gerakas, Attica Region, 15344, Greece Keywords: GHG emissions, Incremental, Dubrovnik Neretva County, Solid Waste Management System. Presenting author e.ieremiadi@enviroplan.gr ABSTRACT In 2014, Dubrovnik-Neretva County in Croatia launched procurement procedures for technical assistance services in relation to the elaboration of Feasibility Studies and EU project funding applications according to the regulations. The aforementioned project was awarded to a consortium consisted of ENVIROPLAN S.A., Brodarski Institut and Procurator Vastitatis. The project area included Dubrovnik Neretva County with 139,441 citizens / 65,119 t MSW (2013). Within the elaboration of the Feasibility Study and in accordance with the Guide to Cost-Benefit Analysis of Investment Projects ( ), the incremental calculation of greenhouse gas (GHG) emissions (units of CO 2 equivalent) were implemented. Both direct and indirect GHG emissions for the different components of the waste management system and for the alternative waste treatment technologies which were examined calculated. Additionally, GHG emissions, avoided GHG emissions and Net GHG emissions of an incremental approach (with-without project scenario) were calculated. The Carbon Footprint Methodology used provides a series of emissions factors from which greenhouse gas emissions can be calculated. These have been derived from internationally recognized sources. The quantification of GHG emissions for each examined scenario of the project and also for the without project scenario has been implemented taking into consideration the aforementioned methodology. The following table presents the results of incremental approach (with-without project scenario) of each examined scenario. Table 1. GHG emissions for each examined scenario/incremental Approach (Average ), t CO 2 (eq) Scenario 1 Scenario 2 Scenario 3 Scenario 4 t CO 2 (eq) -36,072-36,939-29,023-37,230 KEYWORDS GHG emissions, direct emissions, indirect emissions, waste management system, Croatia, Dubrovnik/Neretva ABBREVIATIONS GHG: Green House Gas Emissions MSW: Municipal Solid Waste WRI: World Resources Institute WBCSB: World Business Council for Sustainable Development MRF: Material Recovery Facility MBT: Mechanical-Biological treatment EIB: European Investment Bank TC: Total Carbon DOC: Degradable organic carbon DOCf: Dissimilable Organic Carbon FC: Fossil Carbon RDF: Refuse Derive Fuel CLO: Compost Like Output SRF: Solid Recovered Fuel) AD: Anaerobic Digestion 1. INTRODUCTION Green house gases that can be included within the footprint include the seven gases listed in Kyoto Protocol, namely: carbon dioxide (CO 2 ), methane (CH 4 ), nitrous oxide (N 2 O), hydrofluorocarbons (HFCs), per fluorocarbons (PFCs), sulphur hexafluoride (SF 6 ) and nitrogen fluoride (NF 3 ). Total emissions of these gases are counted in units of CO 2 equivalent. The potential sources of direct GHG emissions from the activities included in the aforementioned project s proposed waste management system for the Dubrovnik-Neretva County are shown in the following table: 1
2 Table 1. Selected examples of sources of direct GHG emissions by activity type Activity GHG Type Potential sources of emission Transport CO 2 CO 2 from mobile combustion. Biological waste treatment plants CH 4 CH 4 from anaerobic digestion of biodegradable waste. Municipal solid waste landfills CH 4 CH 4 from anaerobic digestion of biodegradable waste. 2. PROJECT BOUNDARIES The first step was the definition of the project boundaries and more specific what had to be included in the calculation of the absolute, baseline and relative emissions. For the definition of the scope of GHG emissions that were taken into account in the carbon footprint calculation, the literature has generally accepted the approach developed by the WRI/WBCSD GHG Protocol, which differentiated between the following types of emissions: Scope 1: Direct GHG emissions. Direct GHG emissions physically occur from sources that are operated by the project within the project boundary. For example emissions produced by industrial processes and by fugitive emissions inside the project boundary. Scope 2: Indirect emissions. Scope 2 accounts for GHG emissions from the generation of electricity that is consumed by the project. The indirect emissions are produced outside the project boundary (i.e. at power plant level) but since a project has control over consumption and can improve it with energy efficiency measures, emissions should be allocated to the project. Scope 3: Other indirect GHG emissions. Scope 3 emissions are a consequence of the activities of the project but that occur from sources not operated by the project (i.e. indirect emissions outside the control of the operator, such as emissions by suppliers). According international standards and methodologies for the assessment of Project GHG emissions and emission variations, only scope 1 and scope 2 GHG emissions of projects are normally included in the footprint exercise. The following table provides an overview of the scope of GHG emissions produced by different waste management activities. Activity Material Recovery Facility (MRF) Biological treatment (compostinganaerobic digestion) ΜΒΤ Landfill Table 2. Scope of GHG emissions produced by different waste management activities Net direct GHG emissions Indirect GHG (scope 1) emissions (scope 2) Avoided GHG emissions CO 2 from grid CO 2 avoided through material collection and transportation to and from electricity recovery from waste and recycling the facility consumption collection and transportation to and from the facility collection and transportation to and from the facility CH 4 and N 2 O released in anaerobic processes during waste treatment treatment facility (i.e. by vehicles) collection and transportation to and from the facility CH 4 and N 2 O released in anaerobic processes during biological treatment treatment facility (i.e. by vehicles) CO 2 released from fuels consumption in waste collection and transportation to and from the facility CO 2 from grid electricity consumption CO 2 from grid electricity consumption CO 2 from grid electricity CO 2 avoided through energy recovery from combustion of biogas produced in anaerobic digestion CO 2 avoided through material recovery from waste and recycling CO 2 avoided through energy recovery from incineration of RDF/SRF produced from mixed waste CO 2 avoided through energy recovery from combustion of biogas produced in anaerobic digestion CO 2 avoided through energy recovery from landfill gas CH 4 released from landfill CO 2 released from fuels consumed on the landfill site (i.e. by vehicles) Source: Calculation of GHG emissions in waste and waste to energy projects (Jaspers staff working papers, November 2013) 2
3 In order to quantify GHG emissions released and avoided in the waste management system, the system is separated into its individual components, which are facilities such as: Material Recovery Facility (MRF) Anaerobic Digestion Composting Mechanical-Biological treatment (MBT) Landfill Specific emission factors taken from the literature are applied to calculate the GHG emissions that are characteristic for the individual processes that take place in these facilities. 3. QUANTIFICATION PROCESS AND METHODOLOGIES The Carbon Footprint Methodology used provides a series of emissions factors from which greenhouse gas emissions can be calculated. These have been derived from internationally recognized sources, e.g. WRI/WBCSD GHG Protocol and IPCC Guidelines for National GHG Inventories. The following figure illustrates the overall series of activities to quantify the European Investment Bank (EIB) carbon footprint for investment projects and the associated relative emissions compared to the baseline. Define project Boundary Emission scopes to include Quantify absolute project emissions (Ab) Identify & quantify baseline emissions (Be) Calculate relative emissions Re=Ab-Be 4. SPECIFIC ASSUMPTIONS USED FOR GHG EMISSIONS CALCULATION Assumptions regarding carbon contents of MSW In order to estimate the GHG emissions released from different waste management practices, assumptions are necessary as regards the carbon contents of the different waste fractions treated in the different projects. Different waste fractions were considered in the model as well as their carbon contents (total carbon, degradable/dissimilable organic carbon and fossil carbon). Assumptions regarding GHG emissions from waste collection and transportation The GHG emissions due to waste collection and transportation depend on the distance travelled by waste collection and transport vehicles, the vehicle type and size of payload. The AEA study provides a simplified method to quantify GHG emissions from collection and transportation of waste, which uses general, fixes assumptions on vehicle types used, payloads and km travelled. Assumptions regarding GHG emissions from waste treatment Different emission factors and assumptions were taken into consideration for the calculation of GHG emissions released from different waste treatment processes included in the project: Anaerobic Digestion, Landfilling. Assumptions regarding avoided GHG emissions through recycling of recovered materials Specific emission factors were applied to calculate avoided GHG emissions through recycling of materials recovered from waste. Assumptions regarding avoided GHG emissions through recovery of energy from waste Due to the fact that the proposed technology treatment that will be established in the future WMC, include energy production (heat or electricity) from waste, in the GHG calculator has been used the Electricity country grid emission factor including grid losses for electricity imported from grid and the Electricity - Country grid emissions factor excluding grid losses for electricity exported to grid. 5. RESULTS FROM GHG EMISSION CALCULATIONS In order to support decisions regarding future solutions for the Waste Management in Dubrovnik-Neretva County, reliable strategies and concepts are needed. For this purpose, an option analysis for the Waste Management Centre Technology was performed; four main waste management scenarios have been defined. The scenarios were based on objectives and recent national legislation for waste management and took into consideration the production and composition of the County s waste. The Scenarios were: 3
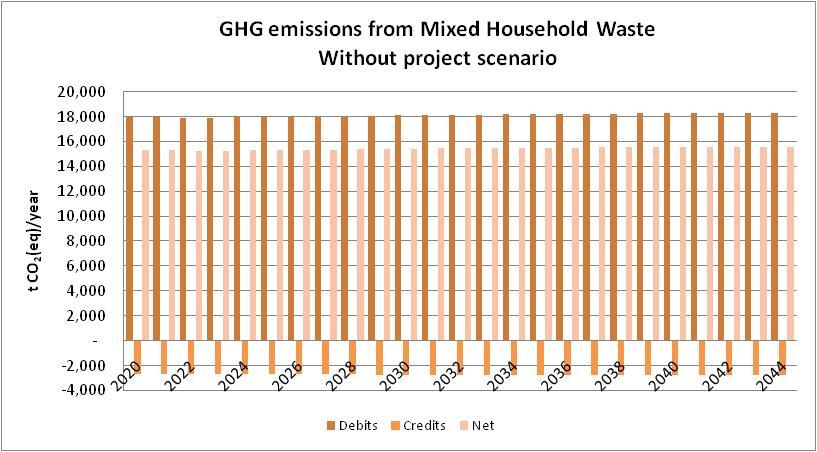
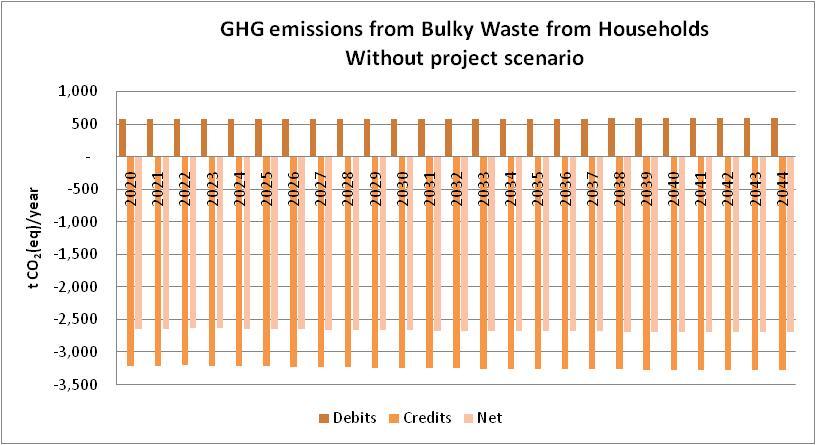
4 Proposed Scenarios Scenario 1 Scenario 2 Scenario 3 Scenario 4 Description Mechanical separation with recovery of Recyclables and RDF and biological treatment (aerobic composting) for CLO production Mechanical separation with recovery of Recyclables and RDF, wet AD with electricity production and dewatering of digestate Biological treatment (Biodrying) for production of low quality SRF and mechanical separation with recovery of Fe/Al Mechanical Separation with recovery of recyclables and RDF, dry fermentation with electricity and heat production and bio-stabilization of digestate (Hybrid MBT) As part of the option analysis, and taking into consideration the aforementioned methodology and assumptions, the quantification of GHG emissions for each examined scenario was performed. The following tables present the quantification of GHG emissions for each examined scenario, the quantification of GHG emissions in without project scenario and the incremental calculations for each scenario. Total t CO 2 (eq) /year (Net) Total t CO 2 (eq) /year (Net) Total t CO 2 (eq) /year (Net) Table 3. GHG emissions for each examined scenario Scenario 1 Scenario 2 Scenario 3 Scenario 4 Quantification of GHG emissions in all scenarios (With project) -23,274-24,142-16,225-24,432 Quantification of GHG emissions in all scenarios (Without project) 12,797 12,797 12,797 12,797 Quantification of GHG emissions in all scenarios (Incremental approach=with-without project) -36,072-36,939-29,023-37,230 The option analysis concluded that the recommended Waste Management System is Scenario Sc4, which includes mechanical separation with recovery of Recyclables and RDF, dry fermentation with electricity and heat production and biostabilization of digestate. 6. ANALYTICAL GHG EMISSION CALCULATIONS IN WITHOUT PROJECT SCENARIO The following table summarizes the net average GHG emissions, in t CO 2 (eq), for the different components of the waste management system in the baseline (without-project) scenario. Table 4: GHG emissions, avoided GHG emissions and Net GHG emissions (average ), in t CO 2 (eq) in without project scenario WITHOUT PROJECT SCENARIO Mixed Waste from Households GHG emissions from waste collection and transport (t CO 2 (eq)) 454 GHG emissions from waste treatment (t CO 2 (eq)) 19 GHG emissions from landfills (t CO 2 (eq)) 17,673 GHG emissions avoided through recycling of materials recovered from waste (t CO 2 (eq)) -2,422 GHG emissions avoided through recovery of energy from waste (t CO 2 (eq)) -260 Total net GHG emissions (t CO 2 (eq)) 15,463 Bulky waste from households GHG emissions from waste collection and transport (t CO 2 (eq)) 27 GHG emissions from waste treatment (t CO 2 (eq)) 536 GHG emissions from landfills (t CO 2 (eq)) 12 GHG emissions avoided through recycling of materials recovered from waste (t CO 2 (eq)) -2,957 GHG emissions avoided through recovery of energy from waste (t CO 2 (eq)) -285 Total net GHG emissions (t CO 2 (eq)) -2,666 Green waste from parks and gardens * Mixed waste from markets * TOTAL WITHOUT PROJECT SCENARIO GHG EMISSIONS (t CO 2 (eq)) 12,797 * Note: According CEA data for year 2013, in DNC there were no quantities of green waste and market waste The following diagrams depict the GHG emissions for the mixed household waste and the bulky waste from households in Without Project Scenario. 4
5 5

6 7. ANALYTICAL GHG EMISSION CALCULATIONS IN WITH PROJECT SCENARIO (SC4) The following table summarizes the net average GHG emissions, in t CO 2 (eq), for the different components of the waste management system in the with-project scenario. Table 5: GHG emissions, avoided GHG emissions and Net GHG emissions (average ), in t CO 2 (eq) in with project scenario WITH PROJECT SCENARIO Mixed Waste from Households GHG emissions from waste collection and transport (t CO 2 (eq)) 362 GHG emissions from waste treatment (t CO 2 (eq)) 1,128 GHG emissions from landfills (t CO 2 (eq)) 1,745 GHG emissions avoided through recycling of materials recovered from waste (t CO 2 (eq)) -23,519 GHG emissions avoided through recovery of energy from waste (t CO 2 (eq)) -1,483 Total net GHG emissions (t CO 2 (eq)) -21,767 Bulky waste from households GHG emissions from waste collection and transport (t CO 2 (eq)) 27 GHG emissions from waste treatment (t CO 2 (eq)) 253 GHG emissions from landfills (t CO 2 (eq)) 12 GHG emissions avoided through recycling of materials recovered from waste (t CO 2 (eq)) -2,957 GHG emissions avoided through recovery of energy from waste (t CO 2 (eq)) -2 Total net GHG emissions (t CO 2 (eq)) -2,666 Green waste from parks and gardens * Mixed waste from markets Total net GHG emissions (t CO 2 (eq)) * 0 TOTAL WITH PROJECT SCENARIO GHG EMISSIONS (t CO 2 (eq)) -24,432 * Note: According CEA data for year 2013, in DNC there were no quantities of green waste and market waste The following diagrams depict the GHG emissions for the mixed household waste and the bulky waste from households in With Project Scenario. 6

) -15,928 GHG emissions avoided through recycling of materials recovered from waste (t CO 2 (eq)) -21,097 GHG emissions avoided through recovery of")
7 8. ANALYTICAL GHG EMISSIONS INCREMENTAL CALCULATION Incremental GHG emissions can be calculated if we subtract the GHG emissions in with project scenario from GHG emissions without project scenario. The following table presents the incremental GHG emissions for the different components of the waste management system. Table 6: Incremental Approach INCREMENTAL APPROACH Mixed Waste from Households GHG emissions from waste collection and transport (t CO 2 (eq)) -92 GHG emissions from waste treatment (t CO 2 (eq)) 1,109 GHG emissions from landfills (t CO 2 (eq)) -15,928 GHG emissions avoided through recycling of materials recovered from waste (t CO 2 (eq)) -21,097 GHG emissions avoided through recovery of energy from waste (t CO 2 (eq)) -1,223 Total net GHG emissions (t CO 2 (eq)) -37,231 Bulky waste from households GHG emissions from waste collection and transport (t CO 2 (eq)) 0 GHG emissions from waste treatment (t CO 2 (eq)) -283 GHG emissions from landfills (t CO 2 (eq)) 0 GHG emissions avoided through recycling of materials recovered from waste (t CO 2 (eq)) 0 7

8 GHG emissions avoided through recovery of energy from waste (t CO 2 (eq)) 283 Green waste from parks and gardens * Mixed waste from markets * TOTAL INCREMENTAL GHG EMISSIONS (t CO 2 (eq)) -37,230 * Note: According CEA data for year 2013, in DNC there were no quantities of green waste and market waste 9. CONCLUSIONS Ιn the context of the Feasibility Study for Development of the integrated and sustainable waste management system in Dubrovnik-Neretva County an option analysis for the Waste Management Centre Technology was performed was performed. As part of the analysis the GHG direct and indirect GHG emissions for the different components of the waste management system and for the alternative waste treatment technologies which were examined calculated. The quantification of GHG emissions for each examined scenario of the project and also for the without project scenario has been implemented taking into consideration the aforementioned methodology. The scenario that ranked as the better solution had the best performance regarding GHG emissions. The following table presents the total net GHG emissions from 2013 to 2044, from the present project which have been calculated by Jasper s calculation model. With Project Scenario Net GHG emissions, t CO 2 -eq Table 7: Project s Net GHG emissions ,039 9,909-24,222-24,224-24,405-24,527-24,638-24,678 The percentage of reduction in year 2020 in greenhouse gas (GHG) emissions with the scenario of the implementation of the project, compared by year 2013 year, has been calculated to 301%. REFERENCES [1] ΕΙΒ Induced GHG Footprint, The carbon footprint of projects financed by the Bank, Methodologies for the Assessment of Project GHG Emissions and Emissions Variations, Version 10.1 [2] JASPERS Staff Working Papers, Calculation of GHG Emissions in Waste and Waste-to-Energy Projects, Dorothee Teichmann & Christian Schempp, November 2013 (revised version). [3] Document: Guide to CBA Analysis of Investment Projects, [4] ΑΕΑ Study (Waste Management Options and Climate Change, 2001) 8