Harmful Algal Blooms in Lake Erie
|
|
|
- Shawn Simpson
- 5 years ago
- Views:
Transcription


1 An update on Harmful Algal Blooms in Lake Erie Thomas Bridgeman University of Toledo November 8, 2013
2 Outline Introduction, History and Lake Erie HABs HAB forecast and early warning tools Ohio Phosphorus Task Force 1 and 2
3 1 Introduction, History and Lake Erie HABs
4 What is a Harmful Algal Bloom?


5 Major Algae groups in Lake Erie Diatoms Greens Blue-greens (Cyanobacteria)
")

6 Common Harmful Algae (Cyanobacteria) Anabaena Aphanizomenon Microcystis Planktothrix Lyngbya


7 Why are harmful algae harmful? Microcystis toxins Microcystin Planktothrix toxins Anatoxin Lyngbyatoxin Aplysiatoxin Anabaena toxins Microcystin Cylindrospermopsin Anatoxin Saxitoxin Lyngbya toxins Saxitoxin Lyngbyatoxin Aplysiatoxin Aphanizomenon toxins Cylindrospermopsin Anatoxin Saxitoxin


8 Harmful algal blooms are increasing worldwide Lake Taihu, China Lake Winnipeg Baltic Sea


9 Lake Erie
10 The Greening of Lake Erie (Eutrophication) Between1920 and 1964 Lake Erie algae biomass increased nearly 6 fold. Diatoms were replaced by cyanobacteria. Harmful algal blooms led to passage of the GLWQA Mandate on Phosphorus control Davis
11 Focus on Phosphorus High Phosphorus concentration leads to -high algal biomass -dominance by cyanobacteria Golden algae Diatoms Green algae (Kalff 2001)


12 Total Phosphorus Loads: A success story Ohio Lake Erie Phosphorus Task Force II Final Report
13 1970s-1990s: Phosphorus controls led to Recovery Algae Conroy & Culver 2005
14 Mid-1990s: Return to eutrophic conditions and harmful algal blooms Algae Conroy & Culver 2005


15 2003: Return of HABs in Lake Erie August 2002 August 2003

16 What Happened? Dissolved phosphorus loads have been increasing Ohio Lake Erie Phosphorus Task Force II Final Report
17 Microcystis in Lake Erie All years following 2002 have had moderate to intense Microcystis blooms. The bloom of 2011 was the largest bloom ever recorded.


18 2011 bloom from the Space Station 2003 Michalak et al. 2013

19 High spring P loads Long water residence time
20 2013 Microcystis open water bloom 2013 open water bloom was second only to 2011 over last 12 years
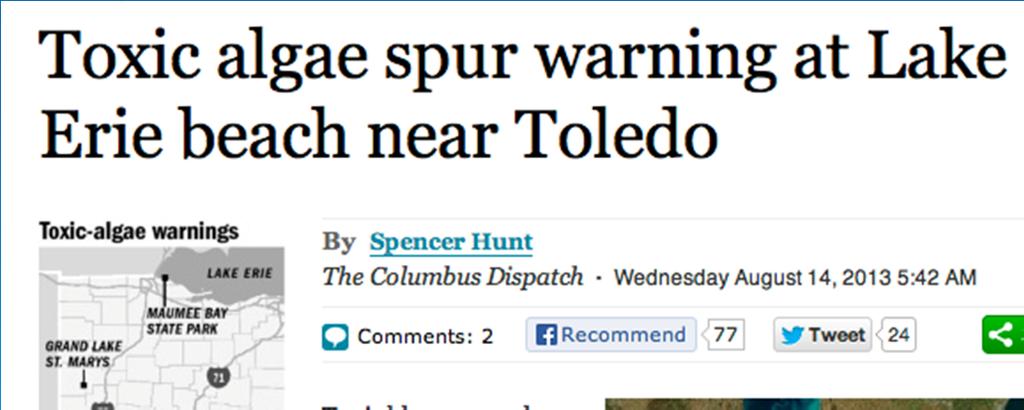
21 2013 Microcystis Maumee Bay More Microcystis in Maumee Bay and south shore areas in 2013


22 October 2, 2013

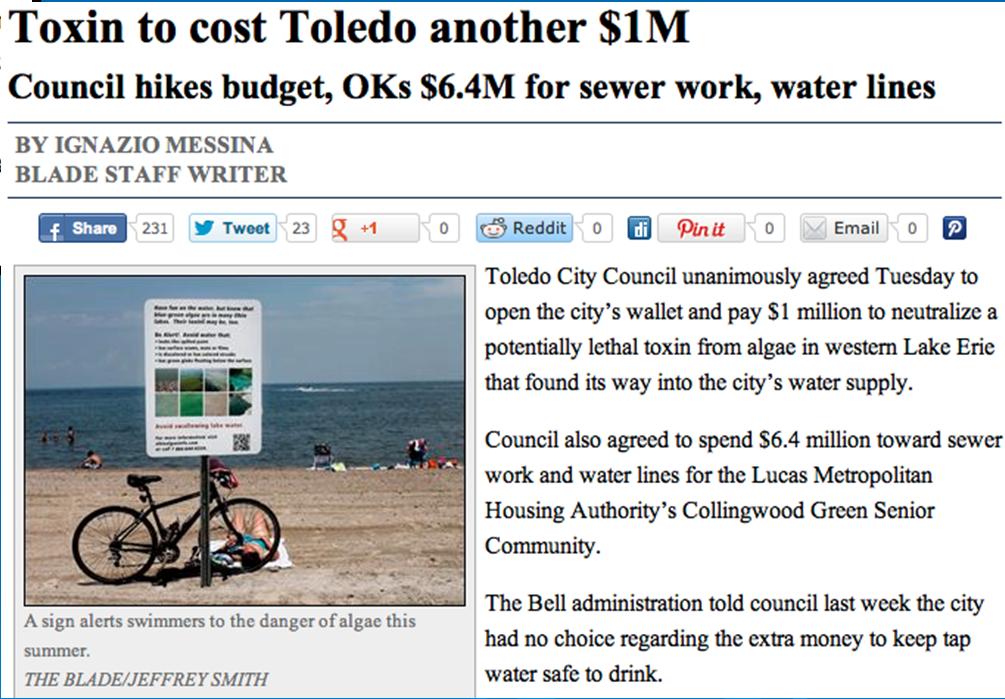
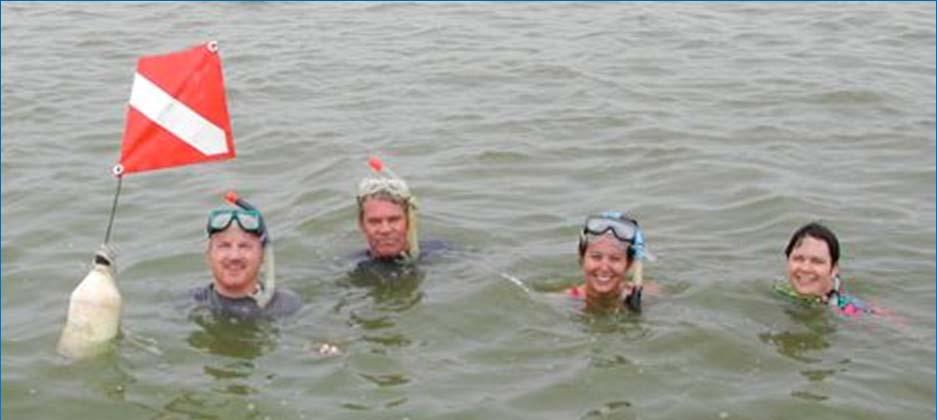
23 Effects of 2013 Bloom


24 Satellites and sensors give SURFACE cyanobacteria concentration However, HABs mixed downward may cause more problems for utilities Mixed plankton After 1 Hour After 1 Day
25 2 HAB Forecast and Early- Warning Tools
26 HAB Forecast and Early- Warning Tools Springtime (March-June) TP load is the best predictor of summer blooms Spring TP load, Maumee R. (NCWQR) TP loading during March-June 2011 was the highest on record, resulting in greatest bloom on record

27 2012 TP loading during March-June 2012 was one of the lowest on record. Spring TP load, Maumee R. (NCWQR)

28 HAB Forecast and Early- Warning Tools NOAA annual forecast (July 5, 2012)

29 Spring TP load, Maumee R NOAA HAB forecast for 2012 was on target.

30 HAB Forecast and Early-Warning Tools 2013 Forecast

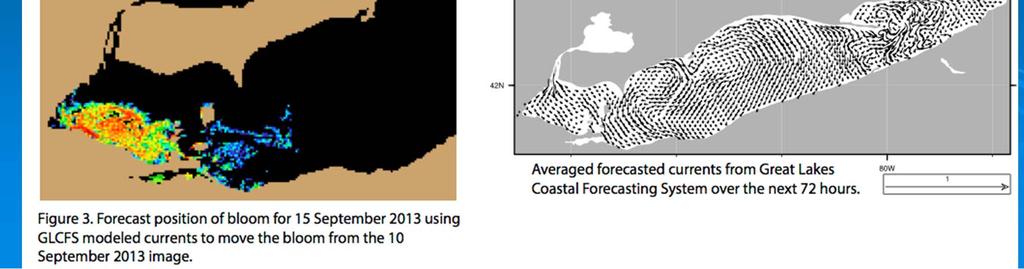
31 HAB Early-Warning Tools

32 October 12, 2013 R. Stumpf, NOAA National Center for Coastal Ocean Science

33 HAB Early-Warning Tools
34 3 Ohio Phosphorus Task Force 1 and 2 (Courtesy Gail Hesse, Ohio L. Erie Commission)


35
36 P Task Force Phase I (2010) Comprehensive analysis of possible sources Identified relative contribution of dissolved phosphorus Point sources have remained relatively constant, other sources contribute Agriculture is the prevailing source (>80% land use) in the Maumee River basin Management of land application of fertilizer is key (how it is applied: timing and placement) Exacerbated by changing weather patterns
")
37 Phase II report is due to be released very soon (110 pgs)
38 P Task Force Phase II: Content Updated water quality and algal bloom information (2011 and 2012 contrast) Reviewed status of Task Force I recommendations Targets for load reductions Progress & costs of point source reductions Nutrient management and mitigating practices
39 Phosphorus Loading Target Spring loads defined as 1 March 30 June Proposing targets based on reduction in multi-year average loads rather than acceptable peak loads. The time period was selected to better address predicted increases in the frequency of severe storms Recommended actions for reduction apply to watersheds between Monroe, MI and Sandusky, OH
40 Phosphorus Loading Target Dissolved Reactive P Average for : Spring: 256 tons Recommended target: Spring: 150 tons 41% reduction from the average No annual loading target recommended Total P Average for : Spring: 1275 tons Annual: 2630 tons Recommended target: Spring: 800 tons Annual: 1600 tons 37% - 39% reduction from the average No phosphorus concentration recommendations at this time
41 Summary HABs in Lake Erie are linked to spring TP loading and seem to be getting even larger in recent years. There are a variety of forecasting and early warning tools available. In order to prevent large HABs, the Phosphorus Task Force is recommending a 40% reduction in Phosphorus loading during the critical spring months.


42 Thank you