Construction & Materials Outlook. March 9, 2009 Ken Simonson, Chief Economist AGC of America USA
|
|
|
- Marjorie Farmer
- 5 years ago
- Views:
Transcription
1 Construction & Materials Outlook March 9, 2009 Ken Simonson, Chief Economist AGC of America USA
2 Current economic influences Credit market freeze affecting private, state and local borrowers Weak demand for income-producing properties Falling state spending No job growth, rising unemployment Stimulus (details: Source: Author 2
3 Economic Stimulus Package Total of $787 billion in spending and tax cuts $308 billion in appropriated spending $269 billion in direct spending (refundable portion of tax credits, unemployment benefits, Medicaid reimbursement to states, etc.) $211 billion in tax cuts Source: Author 3
4 Economic Stimulus Package $49 billion up to $38 billion $30 billion $21 billion Source: Author 4
5 Stimulus tax provisions affecting construction 1-year delay (to 2012) in 3% withholding on gov. contracts Increased expensing Net operating loss: 5 year carryback of NOL for small business (<$15 mil. in gross receipts) Qualified school construction bonds Build America bonds Bonds for recovery zones, tribal areas, renewable energy, energy conservation Modified renewable energy, conservation credits Source: Author 5
6 Stimulus timing, strings Timing highways States must obligate ½ of their total by June 30 States must obligate remainder by Feb. 17, 2010 Timing other construction: language varies Conditions Davis-Bacon Buy American No E-Verify requirement or broad-based FAR No project labor agreement mandate, but Source: Author 6
7 The shifting construction market (construction spending, seasonally adjusted annual rate) (+0.3%) (+4%) (-28%) Source: Census Bureau 7
 vs.")


8 Single-family (SF) vs. multifamily (MF) vs. 12/08 vs. 1/08-9% -46% -1% -9% +4% -1% vs. 12/08 vs. 1/08-8% -50% -2% -51% vs. 12/08 vs. 1/08-8% -50% -2% -51%
9 Housing outlook SF: No relief yet for decline in permits, starts or spending, but sales could pick up by mid- 09 Starts won t improve until late- 09 at best MF: Rental construction cushioned the fall in condo starts but now many owners are trying to rent out houses and condos Foreclosures will add to inventories, drag down both sales and rentals Source: Author 9
10 Nonres totals, share, 1- & 12-month change 1/09 Total Share vs. 12/08 vs. 1/08 Nonresidential total $687 billion 100% - 4% + 2% Educational Highway and street Commercial Manufacturing Power Office Health care Lodging Transportation Sewage and waste disposal Amusement and recreation Other (communication; public safety; relig.; conservation): 9% of total Source: Census Bureau 10 10
11 Public construction (seas. adj. annual rate) 1/09 Total $304 billion State/Local $277 billion Educational Highway and street Sewage and waste disposal Transportation Water supply Office Public safety Amusement and recreation Power Other (health care; residential; conservation; commercial): $24 billion Federal $27 billion Source: Census Bureau 11
12 Spending outlook for 2009 Actual 2008 Forecast 2009 Residential - 27% -2 to +2% Nonresidential +12% -3 to -9% Total -5% -1 to -7% Source: Census (2008); Author (2009) 12
13 Materials and components Higher increases for construction inputs than for overall economy Cumulative change double the CPI since 12/03: Const PPI: 32% CPI-U: 15% Producer price index drivers: steel, gypsum, diesel, asphalt, concrete, copper, plastics, aluminum, wood Source: BLS (CPI, PPI) 13
 Jan.")
14 Change in Producer Prices for Construction vs. Consumer Prices, (December 2003 = 100) Jan Source: BLS (CPI, PPI) 14


15 Producer Price Indexes, Inputs to construction industries Change from 1/08-1/09: 1.8% Highway & street construction Change from 1/08-1/09: -1.4% Other heavy construction Change from 1/08-1/09: 0.1% Nonresidential buildings Change from 1/08-1/09: 1.2%


16 Producer Price Indexes, No. 2 Diesel Fuel Change from 1/08-1/09: -41.0% Steel Mill Products Change from 1/08-1/09: -2.2% Asphalt Paving Mixtures & Blocks Change from 1/08-1/09: 23.1% Concrete Products Change from 1/08-1/09: 5.0%


17 Producer Price Indexes, Copper & Brass Mill Shapes Change from 1/08-1/09: -28.7% Aluminum Mill Shapes Change from 1/08-1/09: -12.4% Gypsum Products Change from 1/08-1/09: 8.7% Lumber and Plywood Change from 1/08-1/09: -7.3%
18 Outlook for materials in 09 compared to 08 Lower average prices: diesel, asphalt, steel Possible increases: concrete, gypsum, copper, wood products Year-over-year PPI change: -4% to 0% Source: Author s forecasts 18
19 Outlook for materials (beyond 2009) Industry depends on specific materials that: are in demand worldwide have erratic supply growth are heavy, bulky or hard to transport Construction requires physical delivery Thus, industry is subject to price spurts, transport bottlenecks, fuel price swings Expect 6 to 8% PPI increases, higher spikes Source: Author s forecast 19
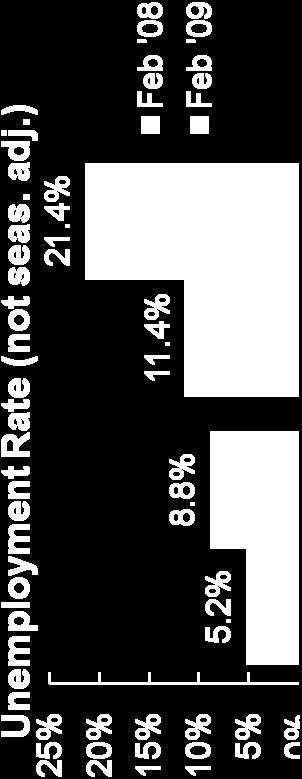


20 Construction jobs fall, but wages rise (seasonally adjusted) 20
21 State construction employment, 12/07 12/08 WA OR MT ND MN VT NH ME CA NV ID UT AZ WY CO NM SD NE KS OK WI IA IL MO AR MI OH IN KY TN NY PA WV VA NC SC MA RI CT NJ DE MD DC AK TX LA MS AL GA 0% to 4% HI FL -0.1% to -8.5% -8.8% to -22% Source: BLS 21
22 State construction employment, 12/07 12/08 AL - 4% FL -16% LA + 4% NE - 1% OK + 4% VT -13% AK - 1 GA -10 ME -10 NV -15 OR -13 VA - 6 AZ -21 HI - 8 MD - 6 NH - 8 PA - 5 WA -10 AR - 3 ID -15 MA - 9 NJ - 5 RI -12 WV - 6 CA -11 IL -13 MI -16 NM - 2 SC -17 WI - 7 CO - 5 IN -13 MN -10 NY - 5 SD - 5 WY - 1 CT - 8 IA - 5 MS - 1 NC - 7 TN - 4 DE -11 KS - 3 MO - 1 ND - 1 TX + 1 DC + 2 KY -12 MT - 8 OH - 9 UT
23 State construction employment, 12/07 12/08 (U.S. total: -8.5%) 5 biggest losses States with gains Source: BLS 23
24 Summary for 2009 Nonres spending: -3 to -9% Res: -2 to +2% (SF up in 2d half, MF down all year) Total construction spending: -1% to -7% Materials costs: -4% to 0% Labor costs: +3% to +4% 24