The History and Lessons of Portland: What Has Worked and What Has Not. Michael Armstrong City of Portland. May 2013
|
|
|
- Henry Booth
- 5 years ago
- Views:
Transcription
1 The History and Lessons of Portland: What Has Worked and What Has Not Michael Armstrong City of Portland May 2013
2
3
4
5
6

7

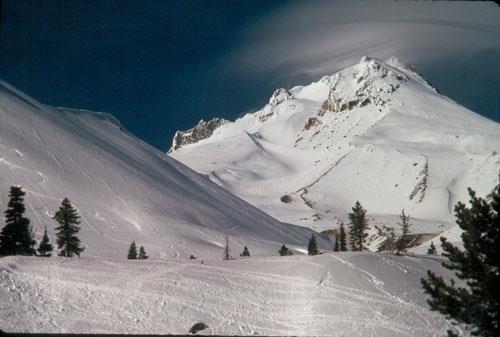
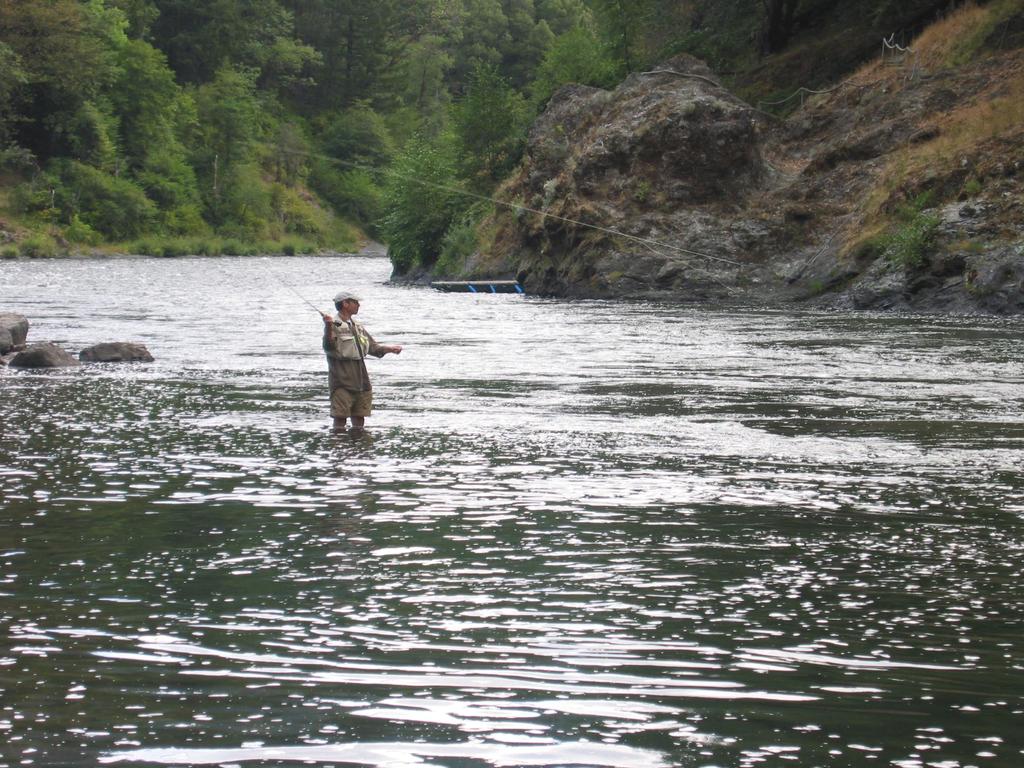
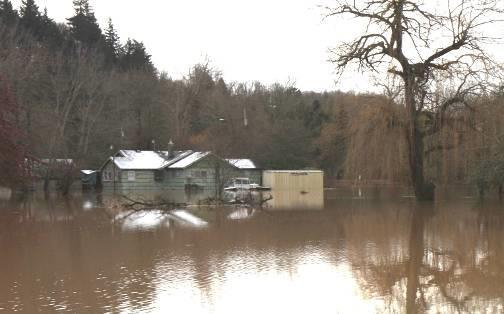
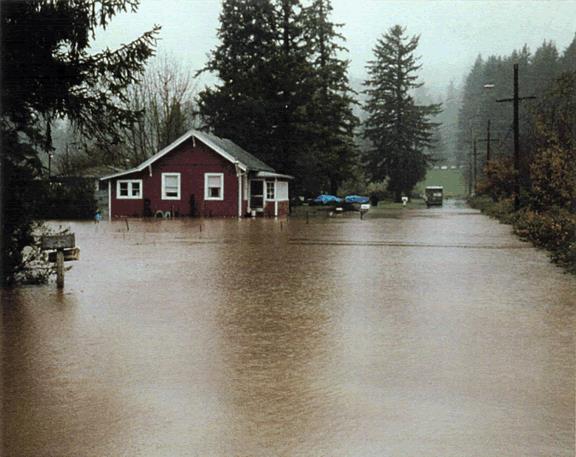
8 Photo: US Geological Survey

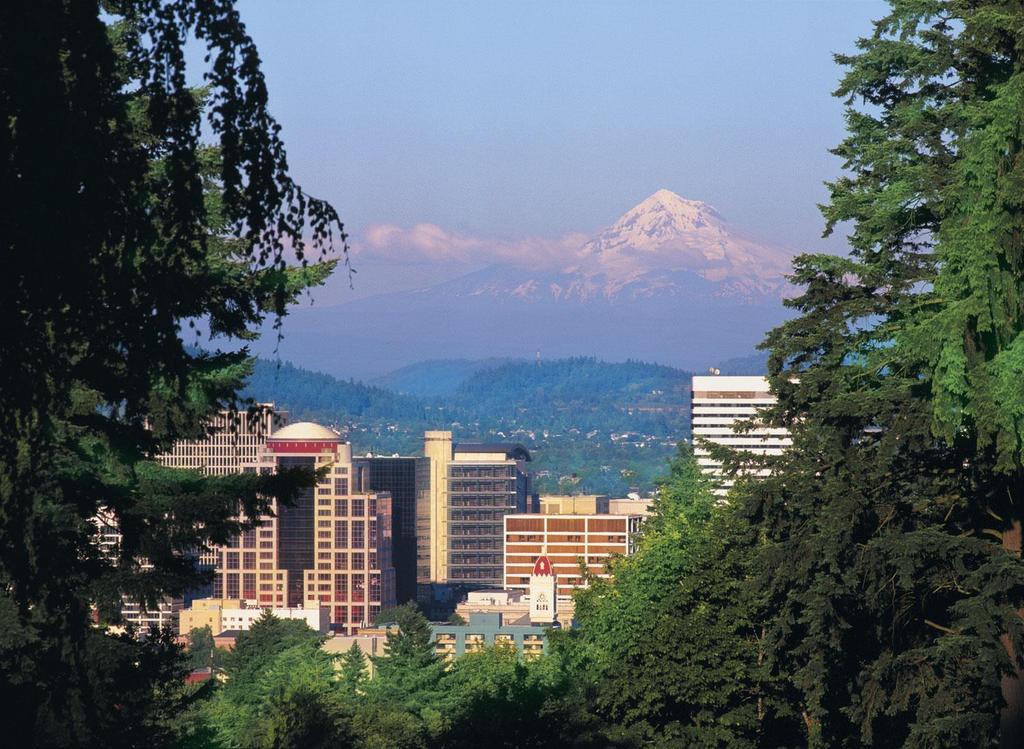
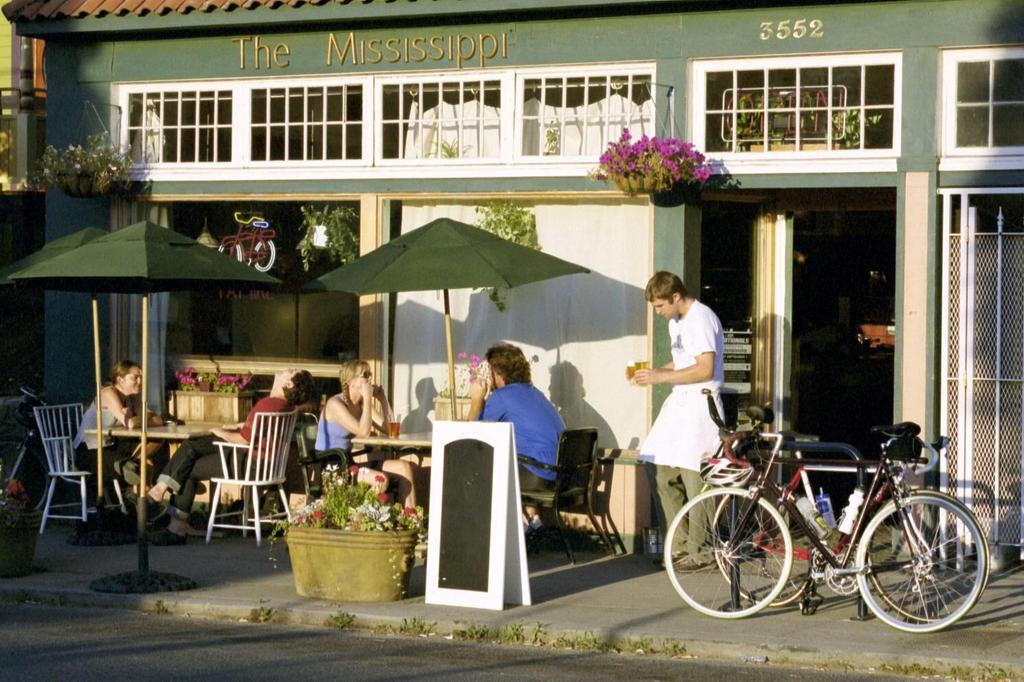
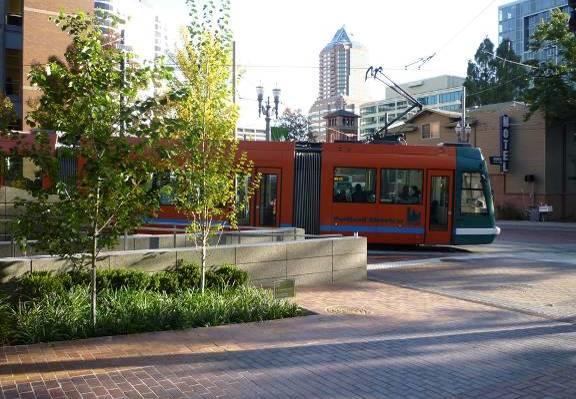
9 Photo: Matt Kennedy
10
11
12
13
14
15
16
17
18
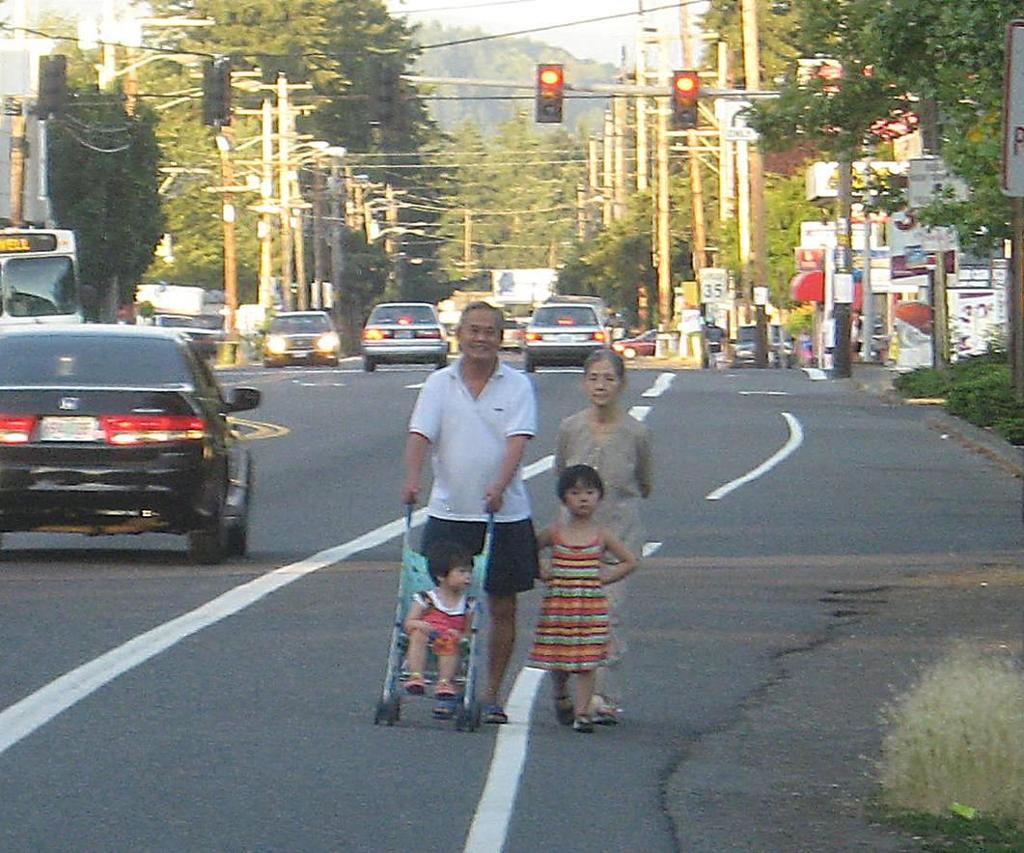
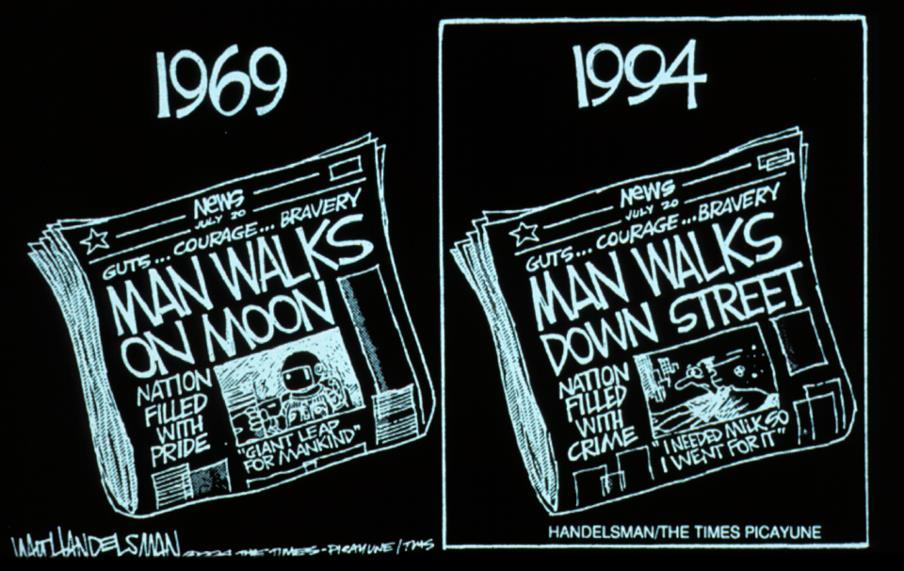
19 But...

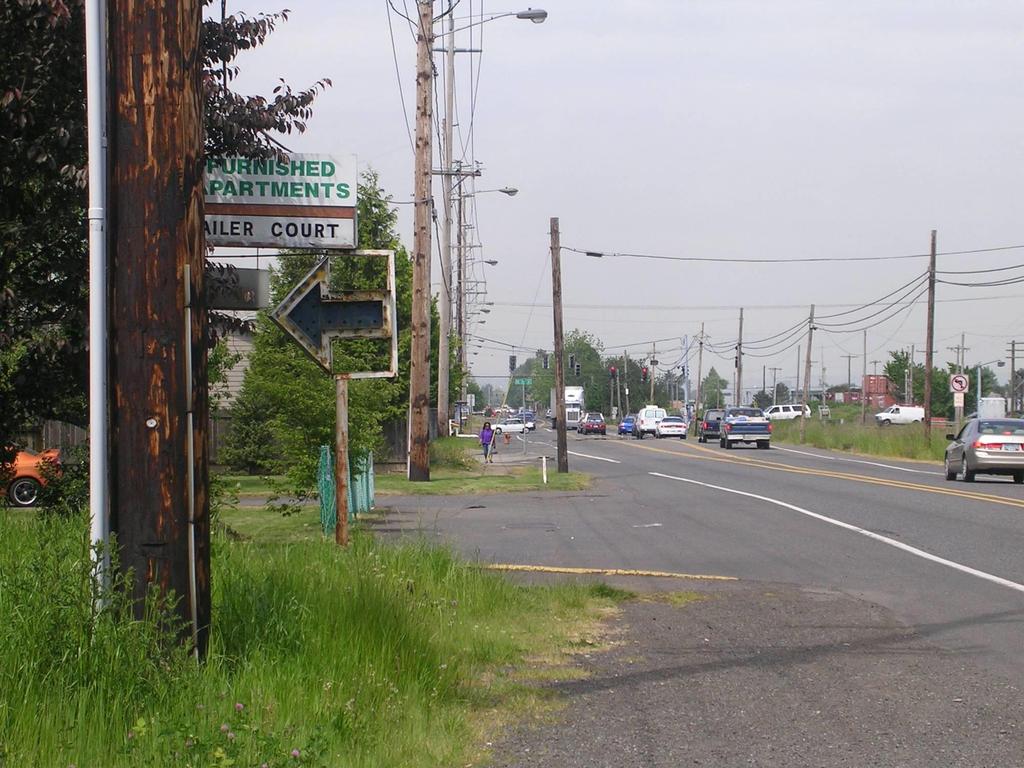
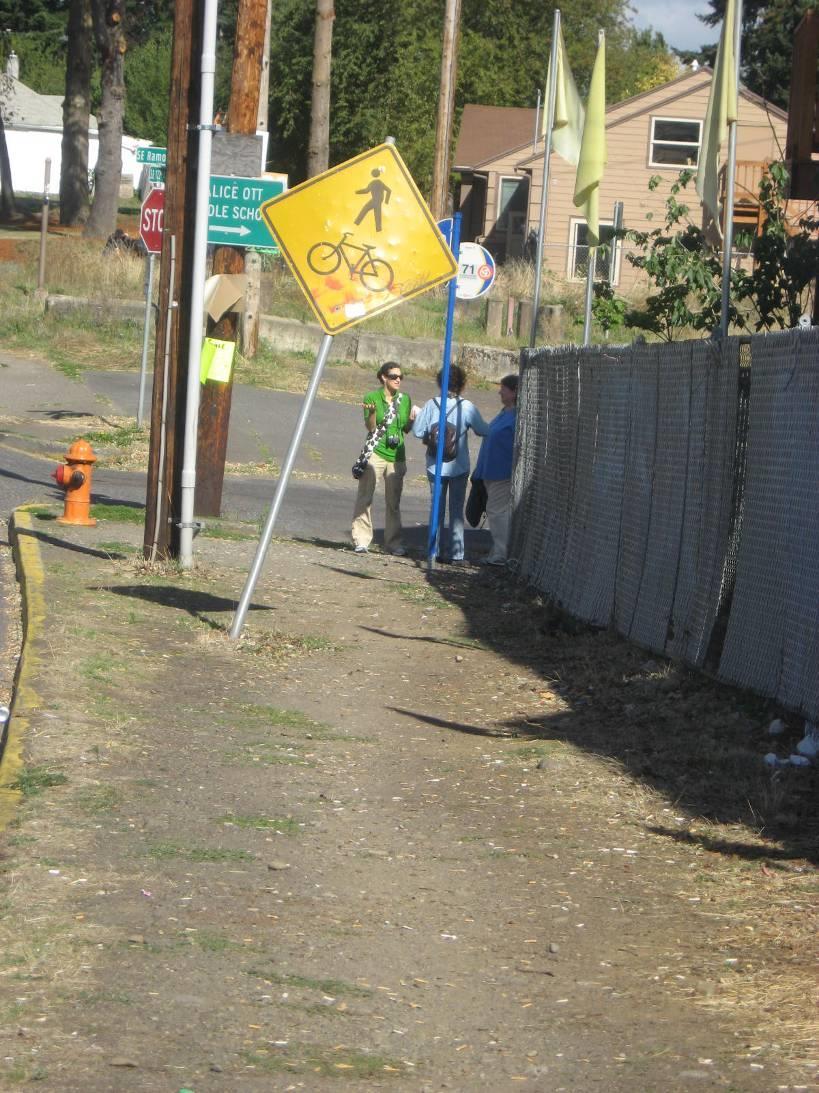
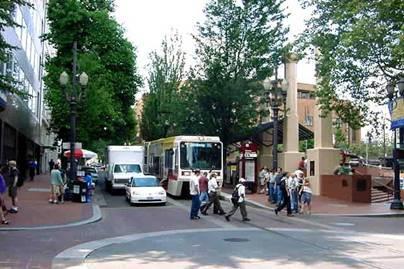
20 Be careful crossing street

21 In the 1970s, we had 180 days of air quality violations per year
22

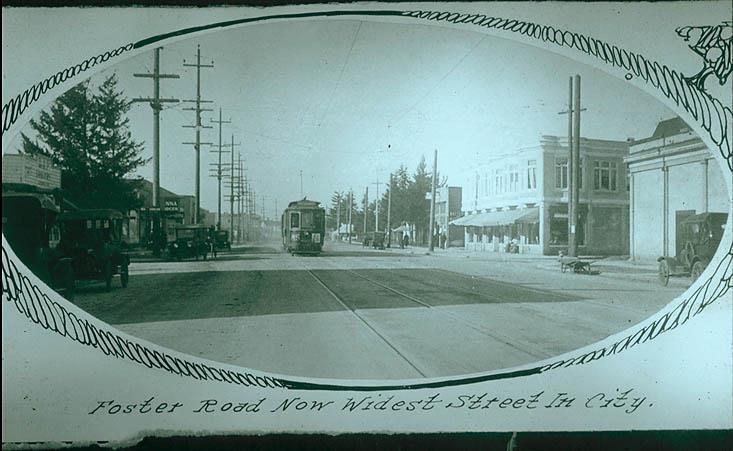
23 Burnside 1930s
24

25 Lloyd District 1960's

26 I-5 Construction (Minnesota Freeway)

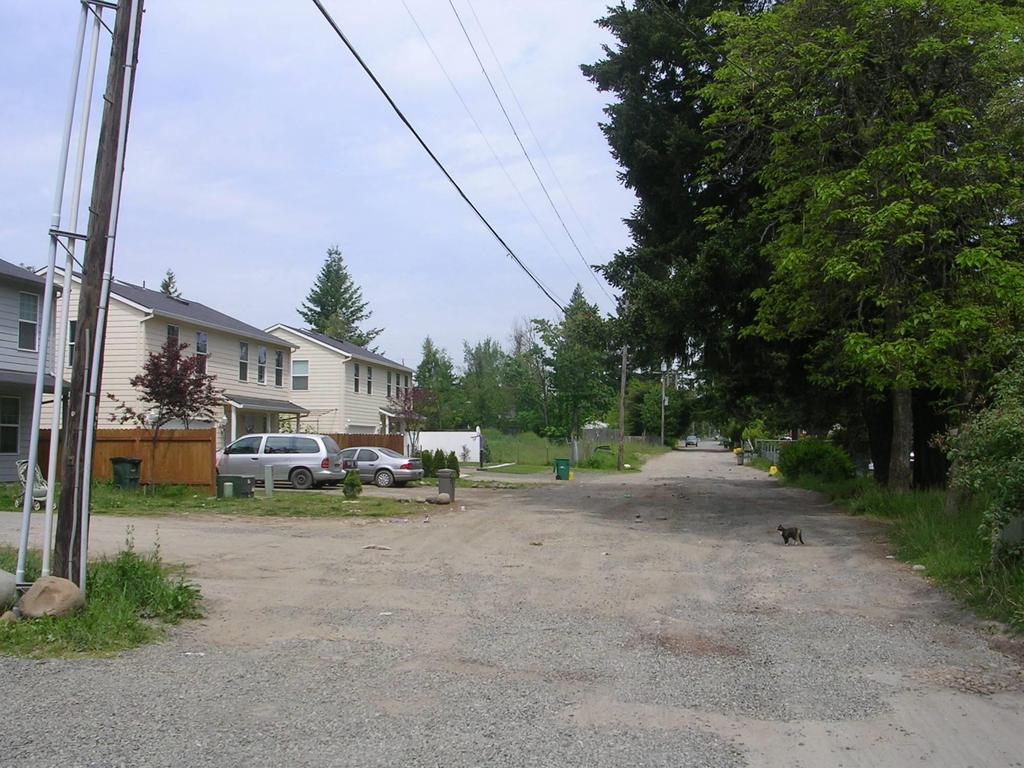
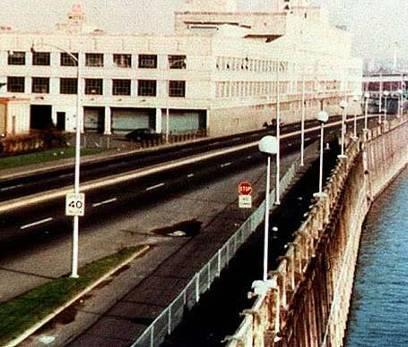
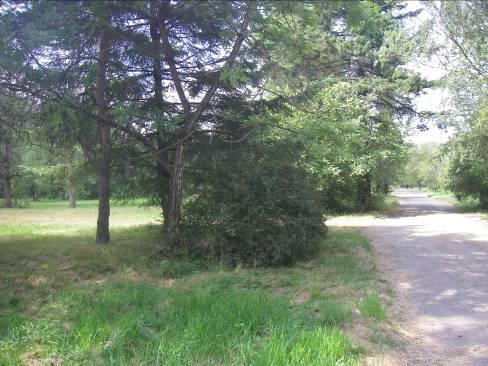
27 Where the sidewalks end
28
29
30
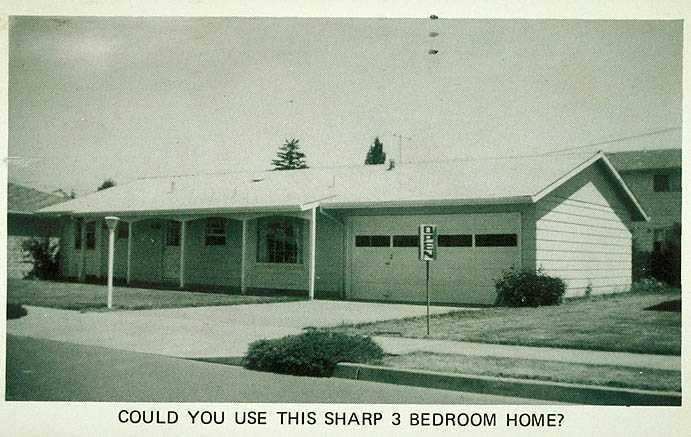
31 The working poor made up 23% of Multnomah County households in
32 The median household income for households that identify as Black or African-American is about half of the citywide median for all groups.
33 53% of Portland's high school students graduate in four years. 23% drop out.
34 Graduation rates for youth of color and youth in poverty are significantly lower. The four-year graduation rate for Native American youth is 39%.
35 Chronic disease rates have increased. 53% of Multnomah County residents are overweight or obese.


36 Portland has made choices before
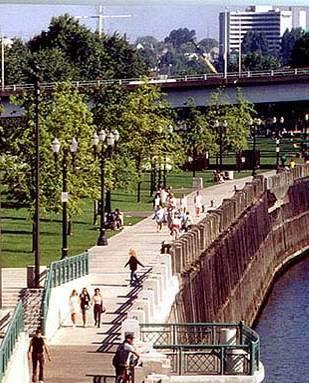
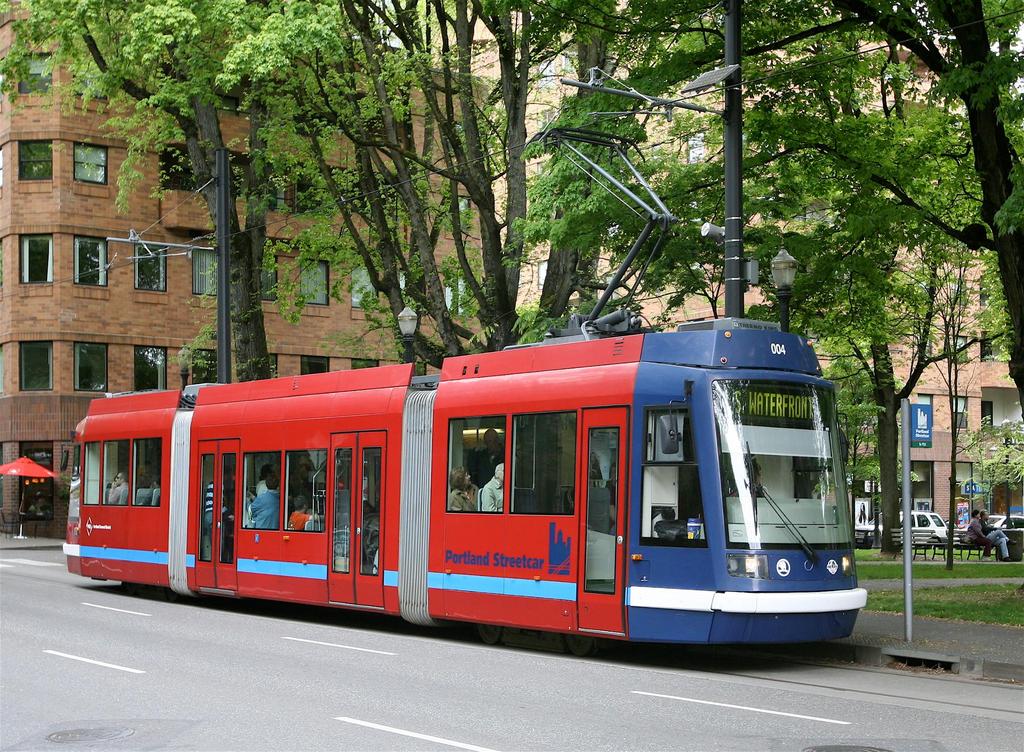
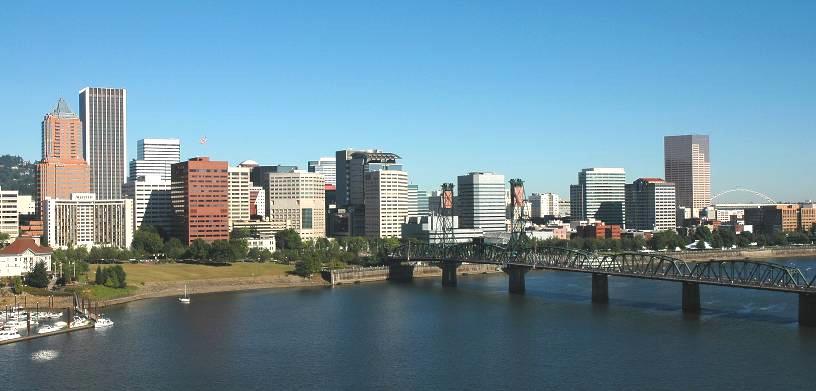
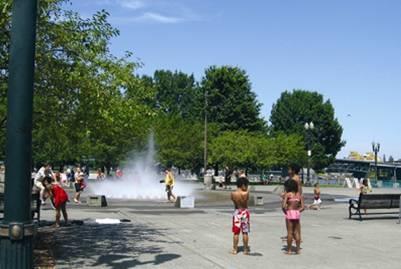
37 Waterfront Park

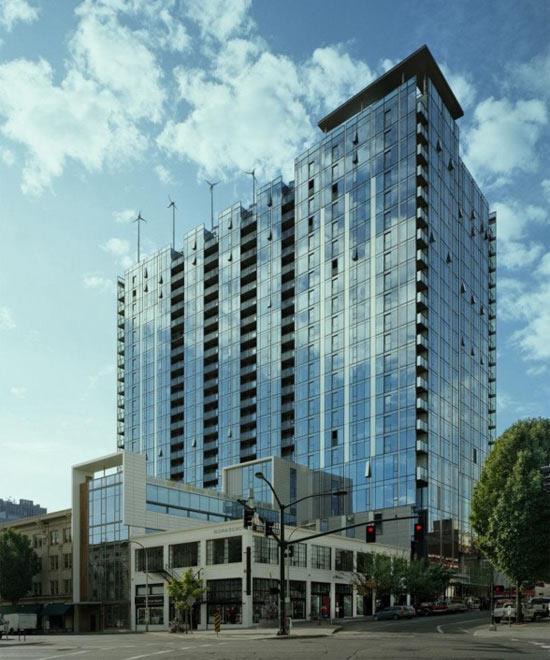
38 In the 1960s downtown was in decline Freeways focusing growth in suburbs Downtown buildings razed to construct more parking lots Urban renewal replaces vibrant neighborhoods with sterile high-rise apartments

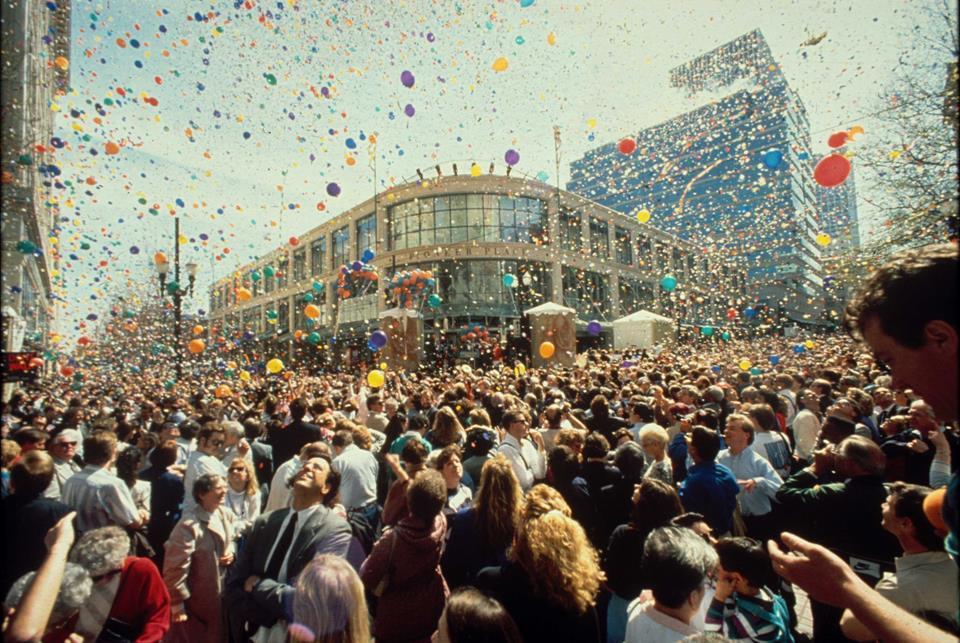
39 Plans to expand this parking lot to 10 floors in the heart of downtown...

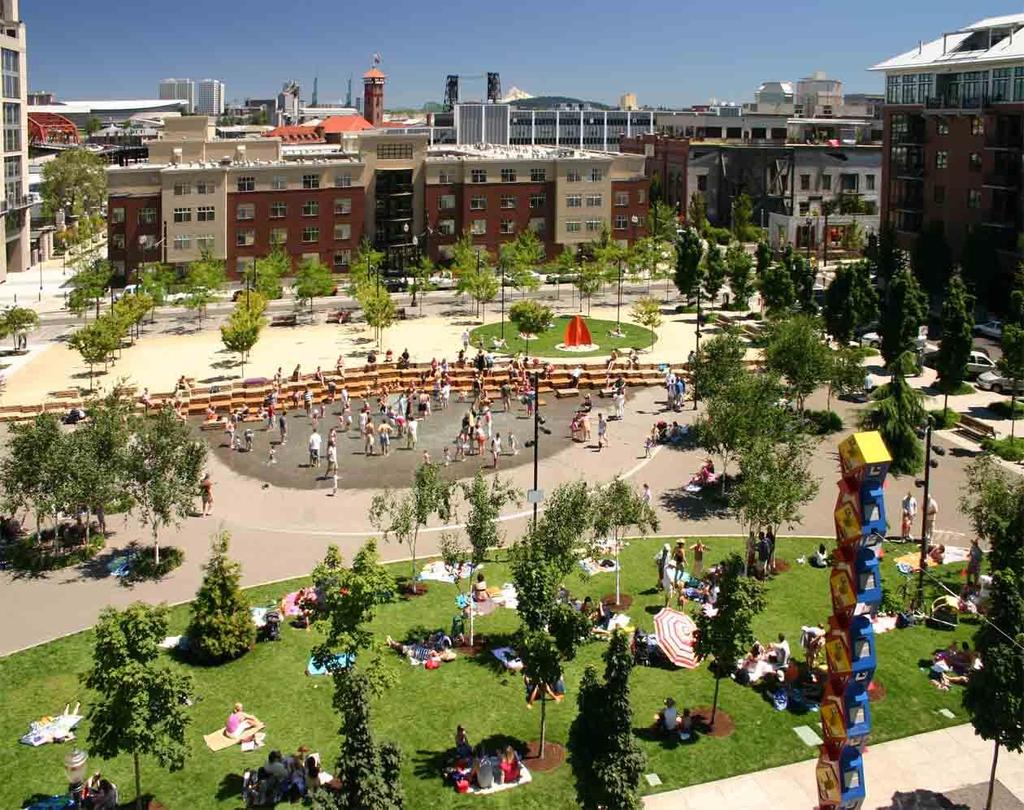
40 produced community demand for the construction of Pioneer Courthouse Square

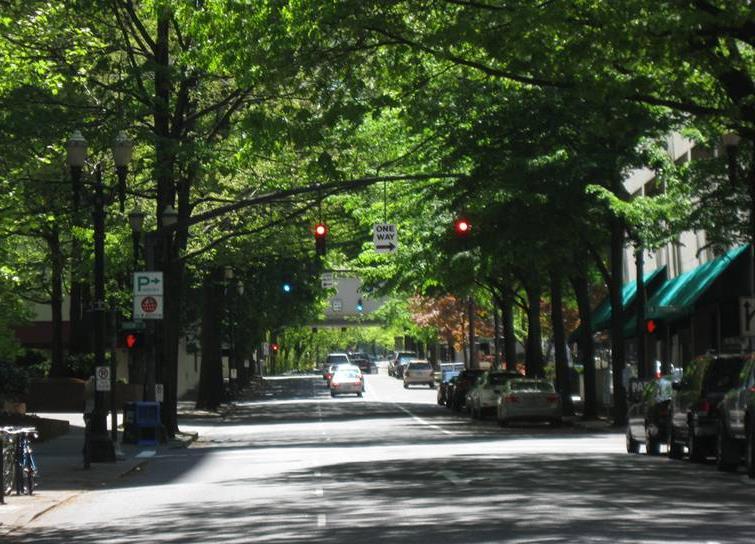
41 Stumptown to urban forest

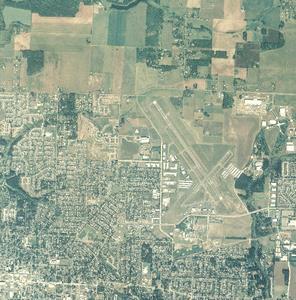
42 Urban growth boundary

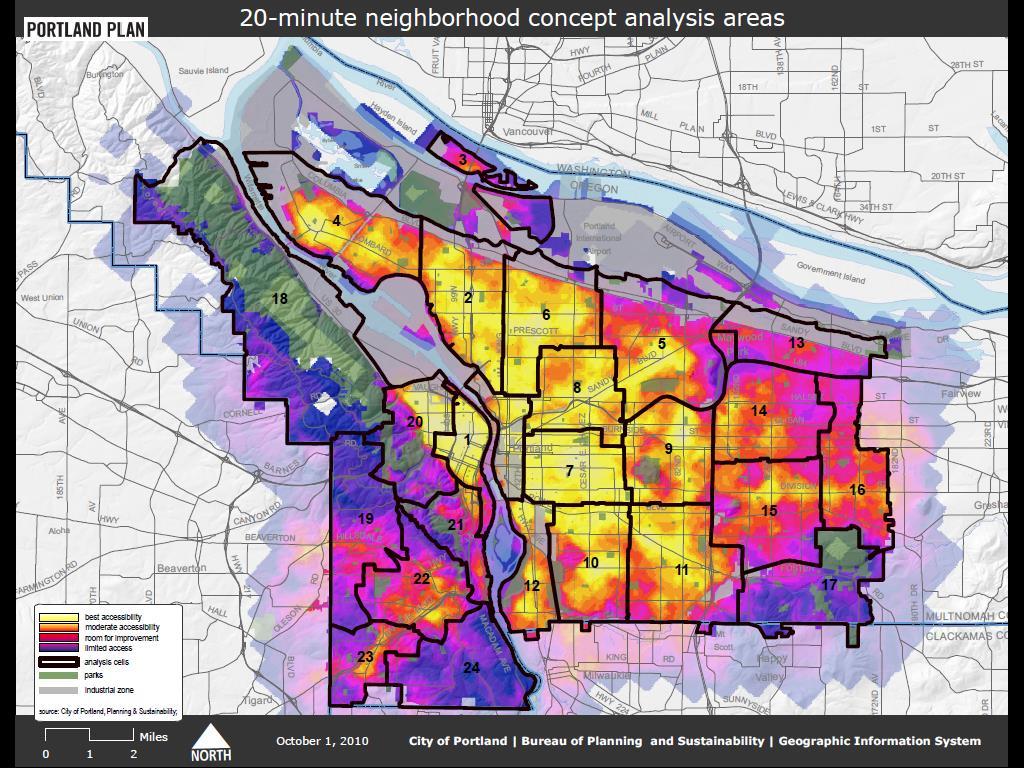
43 THE PORTLAND PLAN

44 One size does not fit all.

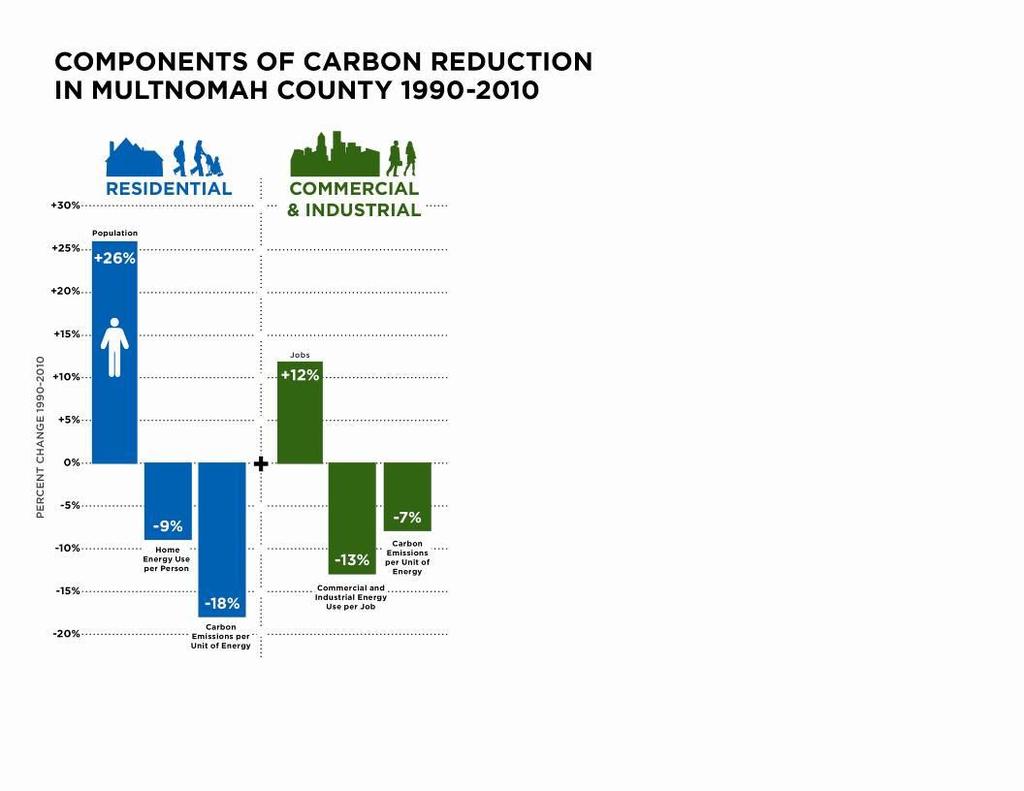
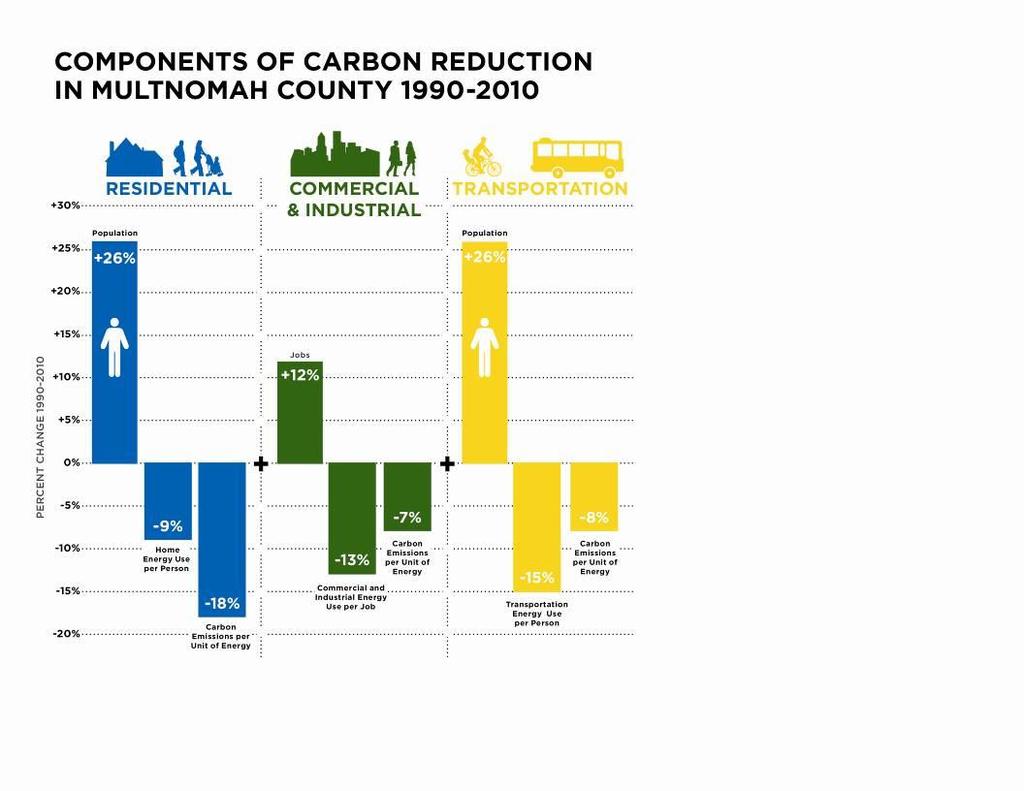
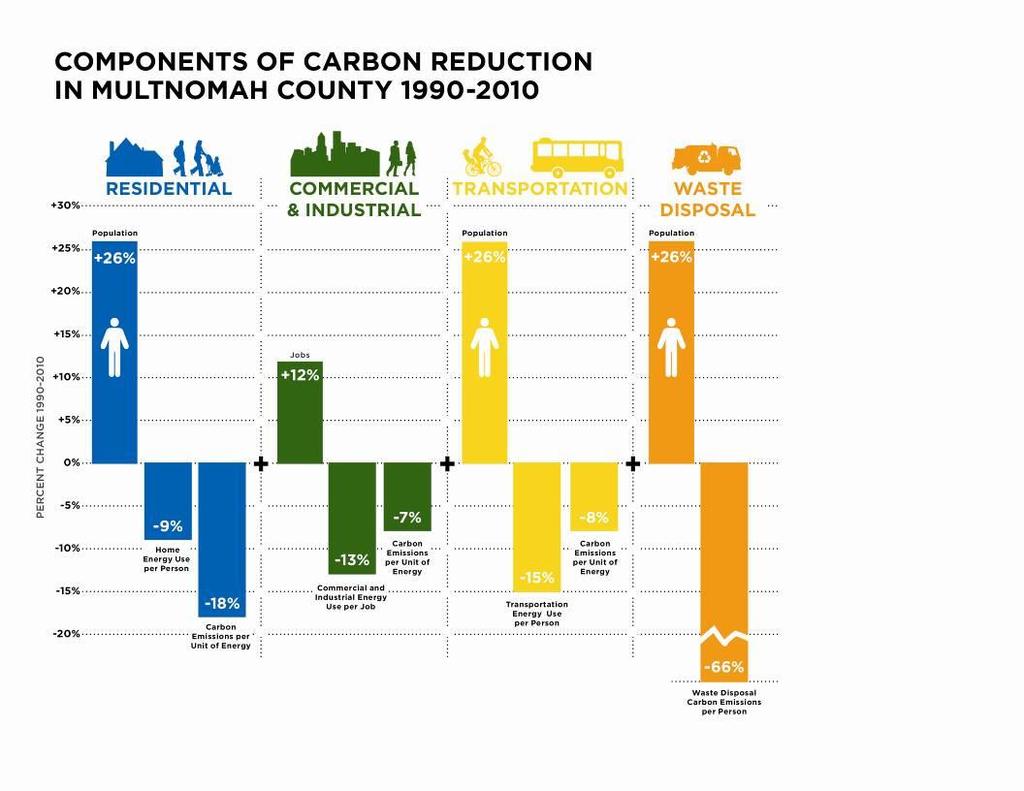
45 24 Local Sub-areas
46 Partners City of Portland Metro Multnomah County Portland State University Oregon Health & Science University Portland Public Schools Parkrose School District Centennial School District David Douglas School District Reynolds School District Worksystems, Inc. Portland Community College TriMet ODOT Mt Hood Community College University of Oregon Portland Development Commission Home Forward Port of Portland East Multnomah Soil & Water Conservation District West Multnomah Soil & Water Conservation District Multnomah County Drainage District No. 1
47

48 The Portland Plan


49 Climate Action Plan 2050 Goal: 80% emissions reduction 2030 Interim Goal: 40% emissions reduction 2030 Objectives 2012 Actions Climate Action in Portland 49

50 Success is not just about energy and carbon The Climate Action Plan aligns with other City of Portland efforts... Economic Development Strategy Watershed Management Plan Bicycle Plan & Streetcar System Plan Efforts to advance social equity and diversity...and helps carry out the Portland Plan.
51 Local energy policies 1973 Oregon Senate Bill and 1990 Energy Policies 1980 Portland Comprehensive Plan 1992 Recycling and Waste Reduction Strategy 1993 CO 2 Reduction Strategy 2000 Green Building Policy 2001 Local Action Plan on Global Warming 2006 Renewable Fuel Standard 2007 Peak Oil Task Force recommendations 2008 Portland Recycles Plan 2009 Climate Action Plan 2012 Portland Plan
52 Accomplishments since 1990 Household energy down 10% per capita Vehicle miles traveled down 8% per capita (since 1995) Gasoline sales down 21% per capita Highest hybrid ownership in US per capita Transit ridership doubled Bike commutes increased five-fold Recycling rate more than tripled Among the most LEED Platinum buildings in U.S. City facilities save more than $5.5M per year
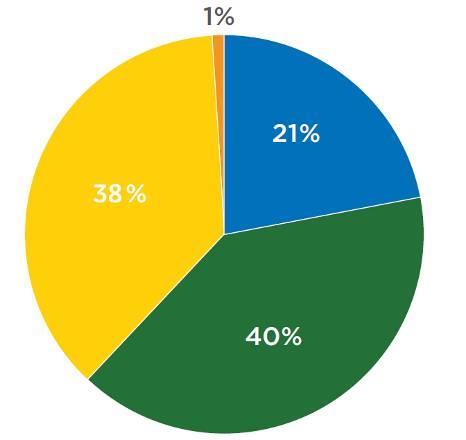
53 Portland's carbon emissions diverge from the national trend 25% 20% Percent change since % 10% 5% 0% -5% -10% -15% United States Multnomah County
54
55
56
57
58

59 Climate Action in Portland 59
60 Multnomah County Carbon Emissions Commercial Buildings 24% Industry 16% Homes 20% Transport 39% Waste Disposal 1%
61 Eight Climate Action Areas


62 Reduce building energy use Produce more on-site renewable energy Work with utilities to shift to low-carbon energy sources Climate Action in Portland 62

63 Green building incentives Green Investment Fund for innovation LEED standards for any building that receives public funding Technical assistance, training and outreach


64 Clean Energy Works Residential energy retrofit program No up-front cost to homeowner Low-income households receive lowest interest rate Loan repaid on utility bill over 20 years Strong workforce agreement to ensure quality jobs and equity in hiring and training


65 Renewable Energy Goal: 10 MW Solar by 2012 Achieved 15 MW Climate Action in Portland 65
66 By end of 2011, 15 MW installed Since 2003, 2,151 total installs 400 % increase from Solarize Campaign

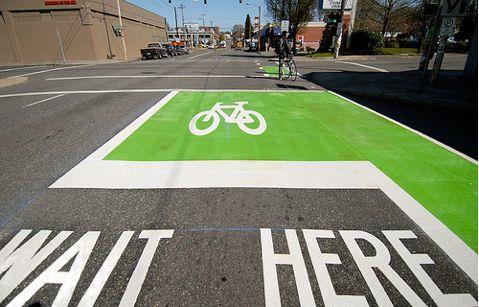
67 2030 Goals 90% residents can easily walk or bike to meet all basic daily non-work needs. Reduce daily vehicle miles travelled by 30% below 2008 levels. Shorter Trips More Transit More Biking More Walking Climate Action in Portland 67
68 2012
69
70 Percent commute by bicycle 7% 6% 5% 4% 3% 2% 1% 0% Portland Minneapolis Seattle San Francisco Denver Chicago Source: American Community Survey
71 Mode Share Change
72 Daily vehicle miles per capita United States Portland Source: Metro

73 Portland's Green Dividend from economist Joe Cortright

74 New service began October 31, 2011 Weekly curbside collection of food scraps, compost and recycling Every-other-week garbage collection Climate Action in Portland 74
 -38% 50,000 25,000 94,100 58,300 - Nov 2010 - Oct 2011 Nov 2011 -")
75 Reduction in garbage 100,000 75,000 Residential Garbage (tons collected curbside) -38% 50,000 25,000 94,100 58,300 - Nov Oct 2011 Nov Oct 2012

76 Increase in composting 100,000 Residential Composting (tons collected curbside) 75,000 50, % 85,400 25,000-30,600 Nov Oct 2011 Nov Oct 2012
77 Green cart participation 84% of households set out green composting cart


78 Food scrap participation Food scraps are in about 90% of green composting carts at the curb


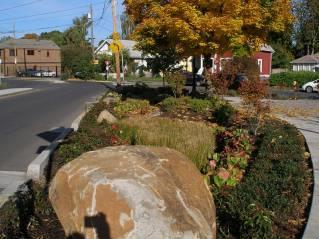
79 Trees Watershed restoration Green infrastructure Climate Action in Portland 79


80 Green Infrastructure Ecoroofs Green Streets Basins Protect water quality Reduce peak flows Reduce flow volume Protect pedestrians Improve urban design
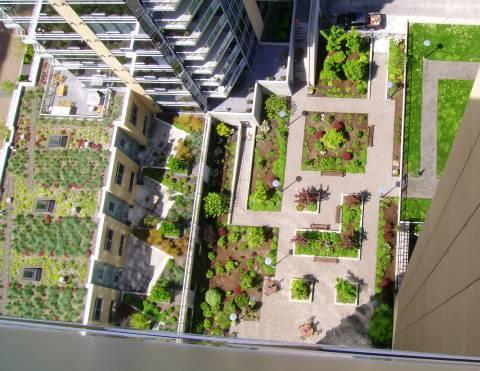
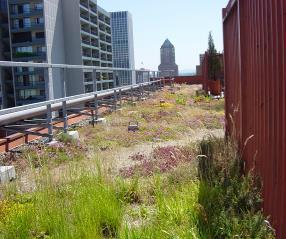
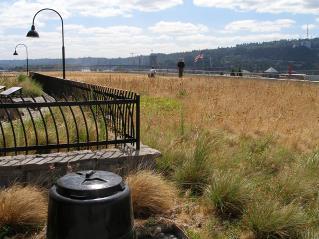
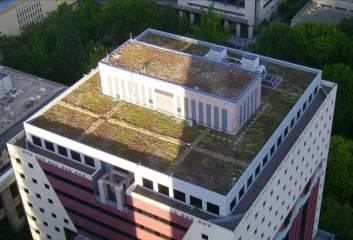
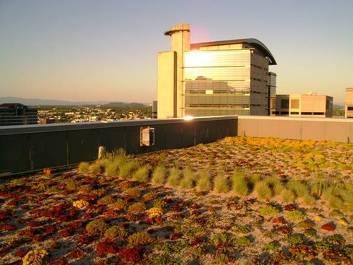
81 Ecoroofs


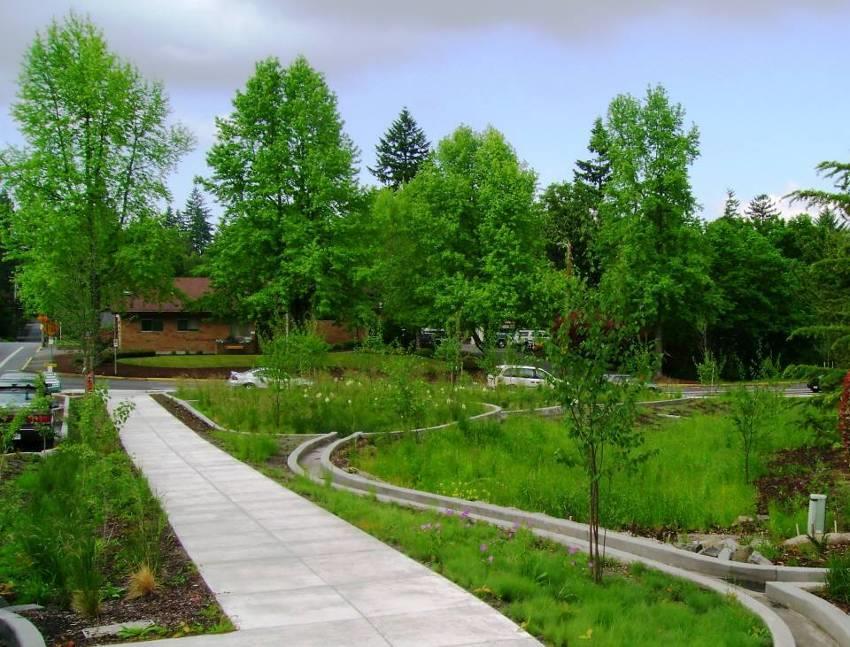
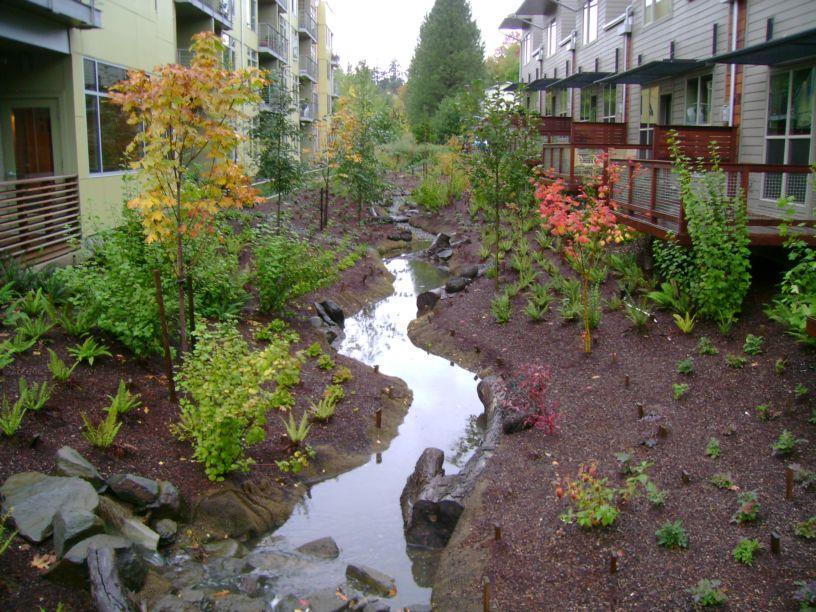
82 Green Streets Behind the curb swale / basin Curb extension swale / basin Planter Rain garden / basin

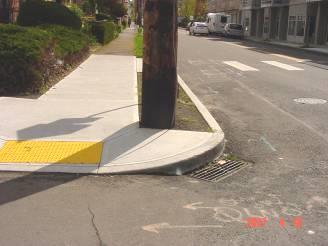
83 Green Streets


84 SE 12 th and Clay Street Green Streets
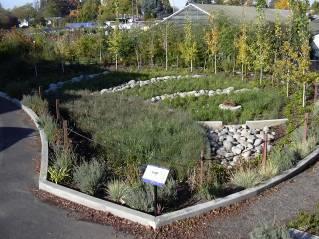
85 Basins

86 Urban Design


87 What impacts do we expect? What risks do we need to address? Climate Action in Portland 87
88
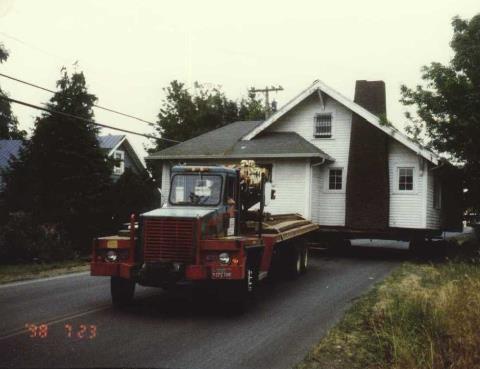
89 Flood plain: retreat and restore Before After


90 Energy efficiency projects completed since 1990 now save ~$5.5 million annually Traffic signals switched to LED in 2001; 2 nd generation in 2009 LED streetlight conversion now underway (50,000 lamps) Lighting retrofits at community centers LEED for Existing Buildings Climate Action in Portland 90

91 Wastewater treatment plant = biogas opportunities Early demonstration of fuel cell and microturbines Now two 875-kW turbines generate $775,000 in power annually Renewable energy = 10% Electric vehicles Climate Action in Portland 91
92 Sustainability
93

94 IN A CITY OF 575,930 WHO GIVES A RIP WHAT YOU THINK?
95

96 Quality of life matters

97 People matter
98