Bathing water results 2010 Slovenia
|
|
|
- Tobias Arnold
- 5 years ago
- Views:
Transcription
1 Bathing water results 2010 Slovenia 1. Reporting and assessment This report gives a general overview of water quality in Slovenia during the 2010 season. In 2010 Slovenia reported under the Directive 2006/7/EC. Before the necessary data set for assessment of water quality under the Directive 2006/7/EC is compiled (data for three or four consecutive years) the rules for transition period assessment are applied. This means that the classification of is defined on the basis of concentrations of intestinal enterococci and Escherichia coli that are reported under the Directive 2006/7/EC. The limit values for the classification are taken from the Directive 76/160/EEC. For the conversion of reported parameters under the Directive 2006/7/EC, Article 13.3 of the Directive 2006/7/EC foresees that the parameter Escherichia coli, reported under the Directive 2006/7/EC, is assumed to be equivalent to the parameter faecal coliforms of the Directive 76/160/EEC. The parameter intestinal enterococci reported under the Directive 2006/7/EC is assumed to be equivalent to the parameter faecal streptococci. The results are classified in the following categories: Class CI: Compliant with the value of the Directive 76/160/EEC for Escherichia coli and not compliant with the guide values of the Directive 76/160/EEC for Escherichia coli or intestinal enterococci; Class CG: Compliant with the value of the Directive 76/160/EEC for Escherichia coli and the more stringent guide values for the Escherichia coli and intestinal enterococci; Class NC: Not compliant with the value of the Directive 76/160/EEC for Escherichia coli; Class B: Banned or closed (temporary or throughout the season); Class NF: Insufficiently sampled; Class NS: Not sampled. In the assessment of water quality in 2010 the maximum days between two samples considered were 32 days. The new directive also requires that the first sample must be taken shortly before the start of a season. However, in the assessment of water quality in 2010, the first sample could be taken not later than 10 days after the start of the season. If this was a case, the second sample should have been taken no later than 32 days after the start of the season. The water is classified as insufficiently sampled or not sampled when the pre-season sample is missing or when the difference between two consecutive samples is larger than 32 days. 2. Length of season and number of The season lasted 3.5 months, from 1 June to 15 September 2010, for coastal and 2.5 months, from 15 June to 31 August 2010, for inland. A total of 46 were monitored in Slovenia during the 2010 season, of which 21 were coastal and 25 inland (17 on rivers; eight on lakes). With 46 Slovenia accounts for about 0.2 % of the reported of the European Union. The evolution of the reported number of since monitoring of the water quality began under the Directive 76/160/EEC and the Directive 2006/7/EC is presented in Table 1. The number of coastal remained stable since the start of the reporting in It started with 19 and increased to 21 in 2010, when one new water was added to the list. The number of inland increased from 18 in 2004 to 25 in 2009 and
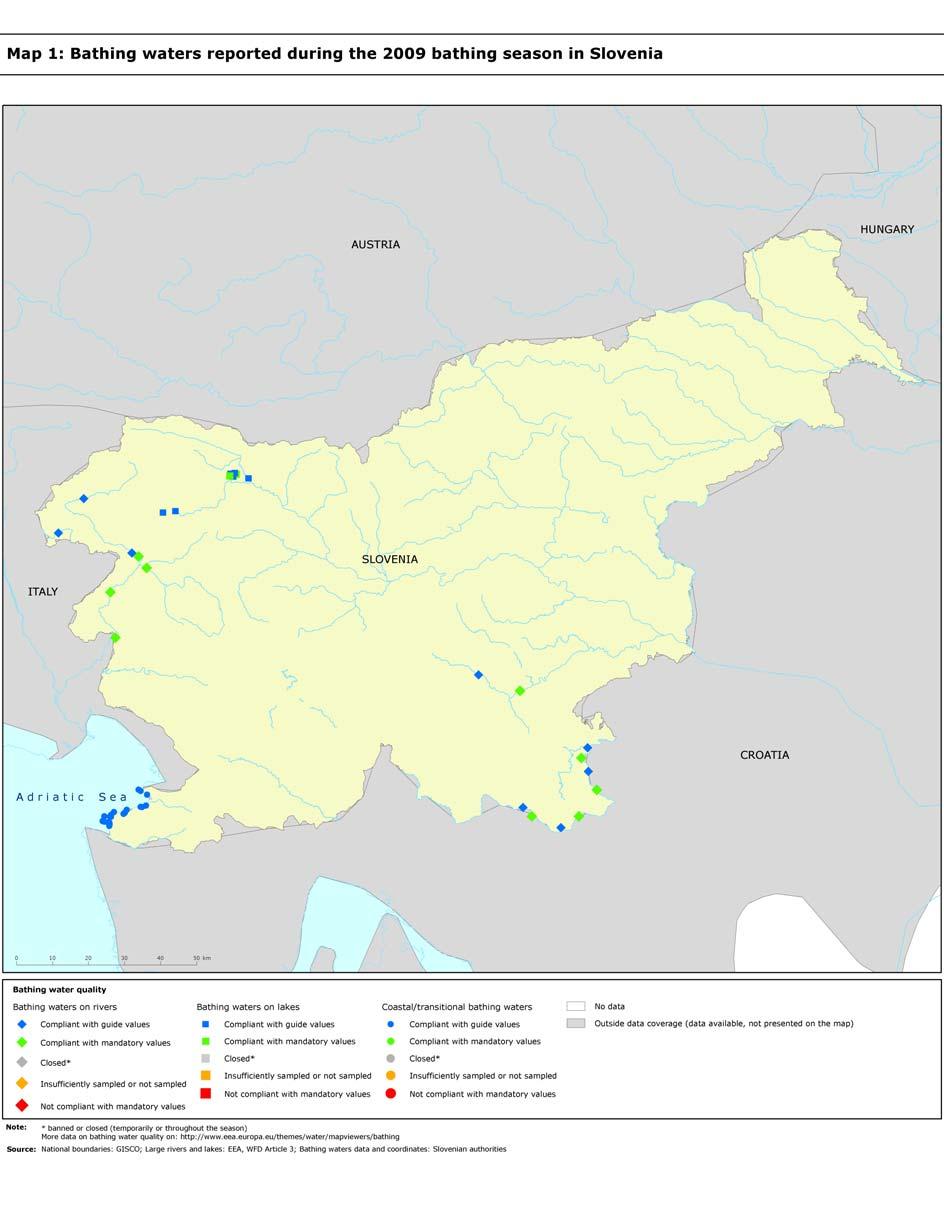
2 3. Bathing water quality The results of the water quality in Slovenia for the period as reported in the past reporting years and for the season of 2010 are presented in Figure 1. The previous reports are available on the European Commission s water quality website ( Water and Health/Bathing Water/ reports) and the European Environment Agency s water website ( reports for the 2008 and 2009 seasons). The graphs show, for coastal and inland separately: The percentage of that comply with the guide values (class CG, blue line); The percentage of that comply with the values (class CI, green line); The percentage of that do not comply with the values (class NC, red line); The percentage of that are banned or closed (temporarily or throughout the season) (class B, grey line). Table 1 shows the same information in absolute numbers and in percentages separately for coastal and inland. The numbers and percentages of insufficiently sampled or not sampled are also presented. Table 2 shows the water quality results for the 2009 and 2010 seasons in Slovenia for all. Map 1 shows the location of the reported in Slovenia. The location of the is based on the geographic coordinates reported by the Slovenian authorities. Coastal In Slovenia, 100 % of the coastal met both the water quality and the more stringent guide values in 2010, the same as in the previous year. Since the start of the reporting in 2004, no coastal water had to be closed during the season. Since 2004, there was an improvement in the quality of the coastal, both in terms of compliance with the values and the guide values, with a drop below 70 % in Total compliance was reached in 2006 for the values and in 2009 and 2010 for both the and guide values. Inland All inland met the water quality in This is an increase of 4 % compared to the previous year, when one water was non-compliant with the values. The rate of compliance with the guide values increased from 36 % to 56 %. Since the start of the reporting in 2004, no inland water had to be closed. There was an improvement in compliance with the values since 2004, reaching 100 % in 2010, with a drop in The compliance with the guide values fluctuated between 27.8 % in 2004 and 56 % in
3 Figure 1: Results of water quality in Slovenia from 2004 to
4 Table 1: Results of water quality in Slovenia from 2004 to 2010 SI Coastal Inland Total number of guide and values* values Not compliant Banned/closed temporarily or throughout the season Insufficiently sampled or not sampled number % number % number % number % number % *Bathing which were compliant with the guide values were also compliant with the values for five parameters under the Directive 76/160/EEC ( ) or the value for Escherichia coli (2010). Table 2: Results of water quality for all in Slovenia in 2009 and 2010 SI All Total number of guide and values* values Not compliant Banned/closed temporarily or throughout the season Insufficiently sampled or not sampled number % number % number % number % number % *Bathing which were compliant with the guide values were also compliant with the values for five parameters under the Directive 76/160/EEC (2009) or the value for Escherichia coli (2010). 4
5 5
6 4. Important information as provided by the Slovenian authorities The report by the Slovenian authorities to the European Commission in regard to water quality in Slovenia for the 2010 season (in Slovene) can be obtained from Further information including national reports on the quality of water and reports to the European Commission is available on the following websites: Ministry of the Environment and Spatial Planning: ( water profiles included) Environmental Agency of the Republic of Slovenia: National Institute of Public Health: 5. More information on water quality in Europe Of the more than areas monitored throughout the European Union in 2010, two-thirds were in coastal and the rest in rivers and lakes. The largest number of coastal can be found in Italy, Greece, France, Spain and Denmark, while Germany and France have the highest number of inland. During recent years, including the 2010 season, majority of Member States have adjusted their monitoring programmes to meet the requirements of the new water directive (2006/7/EC). Luxembourg was the first country to report under this Directive in Cyprus, Denmark, Estonia, Finland, Germany, Hungary, Latvia, Lithuania, Slovakia, Spain and Sweden started to report under the new directive in Malta and the Netherlands started to report in 2009, while Austria, Belgium - Walloon Region, France, Greece, Italy, Portugal and Slovenia reported under this Directive for the first time in Historical data of two microbiological parameters, Escherichia coli and intestinal enterococci were sent by Sweden (since 2005), Luxembourg and Malta (since 2006), Belgium - Walloon Region, Greece, Hungary and Portugal (since 2007), and France (since 2009). To conclude, 20 Member States and the Walloon Region of Belgium monitored and reported under the new directive (Directive 2006/7/EC) in Assessment of the status of all in 2010 under the rules of the new directive (Directive 2006/7/EC) is made for Luxembourg, Malta and Hungary. Assessment of the water quality on a country level for the other countries that reported under the new directive has been done using transition rules. Bathing water quality for individual having four year set of data can be seen on the interactive maps and data viewer that are described below. Three non-eu countries, Croatia, Montenegro and Switzerland have reported monitoring results under the new directive. Switzerland sent data on Escherichia coli for all but only for some data on intestinal enterococci. Overall in 2010, 92.1 % of Europe's coastal and 90.2 % of inland met the minimum water quality standards set by the water directives. During recent years there has been deterioration in water quality but still more than nine in ten meet the minimum quality standards. The share of non compliant was 1.2 % for coastal and 2.8 % for inland. The decrease reflects in part year to year variation but also indicates that further work is necessary to ensure that the quality of is constantly improved and maintained. More information on water quality in the European Member States, including the EU summary report, the reports for 27 Member States, Croatia, Montenegro and Switzerland, can be found on the European Commission s water quality website ( and the European Environment Agency s water website ( The Institute for Water of the Republic of Slovenia (IWRS), a partner in the EEA European Topic Centre on Inland, Coastal and Marine Waters (ETC/ICM) has produced the reports for the seasons from the 6
7 2008 season on. Countries have collaborated in the assessment of water quality and supplied additional information when needed. Interactive information on water quality The water section of the Water Information System for Europe (WISE), which is accessible at the EEA water website, allows users to view the quality of the water at more than coastal beaches and inland across Europe. Users can check water quality on an interactive map or can download data for a selected country or region and make comparisons with previous years. The WISE map viewer ( is an online map viewer for visualisation of European spatial water data. It includes a lot of interactive layers, allowing water themes to be visualised at different scales. Broad resolutions display the aggregated data by Member State. At finer resolutions the locations of monitoring stations are displayed. The WISE Bathing Water Quality data viewer ( combines text and graphical visualisation, providing a quick check on locations and statistics on the quality of coastal and freshwater. It also documents how have changed throughout Europe in recent years and provides a full summary of Europe's water quality. Users can search information at three spatial levels - country, region and province - and observe specific water locations on the Google Earth, Google maps or Bing maps. The Eye On Earth - Water Watch application ( allows users to zoom in on a given section of the coast, riverbank or lake, both in street map or, where available, bird's eye viewing formats. A 'traffic-light' indicator (red, amber, green) of water quality, based on the official water data, is put alongside the ratings of people who have visited the site, including any comments users wish to make. For historical data Water Watch uses a simplified index of water quality data. The Czech Republic, Estonia, Finland (one municipality), Hungary, Lithuania, Luxembourg, Malta, the Netherlands, Norway (one municipality), Slovenia, Slovakia and England and Wales were also sending near real time information on water quality to the Eye On Earth application. The water quality from Austria, Belgium, Bulgaria, Croatia, Denmark, France, Germany, Ireland, Italy, Poland, Portugal, Spain, Sweden and Scotland and Northern Ireland was also presented on Eye on Earth Water Watch. National and local information on water quality In order to make information to the public more effective, all EU countries have national or local web portals with detailed information for each water. Websites generally include a map search function and public access to the monitoring results both in real time and for previous seasons. Information on EU water legislation EU Member States will have to comply with the stricter and more ambitious requirements laid out in Directive 2006/7/EC by 2015 at the latest. The new legislation requires more effective monitoring and management of, greater public participation and improved information dissemination. By March 2011 Member States have to have established water profiles. More on the new legislation can be found on the European Commission's websites and on 7