Simulation of Seawater Intrusion Due to Climate Change Impacts in North Gaza Aquifer Using SEAWAT
|
|
|
- August Carpenter
- 5 years ago
- Views:
Transcription
1 Simulation of Seawater Intrusion Due to Climate Change Impacts in North Gaza Aquifer Using SEAWAT Reem Fathi Sarsak, MSc UNRWA- Environment Health Department Nablus-Palestine Mohammad N. Almasri, PhD Najah National University- Faculty of Civil Engineering
2 Overview Management of groundwater in coastal areas is very important. Over pumping and climate change cause seawater intrusion. Seawater intrusion should be controlled to protect G.W resources.
3 Objective This research deals with the groundwater resources assessment and future forecasting under various scenarios. These scenarios are related to human stresses and climate changes in order to increase our understanding of the seawater intrusion in the North Gaza aquifer using SEAWAT.
4 Regional Location of Gaza Strip 4
5 Study Area Study Area Boundary The Coastal Aquifer Boundary
6 Why choosing North GAZA? North Gaza total area 109 Km 2 (~ 30% of total Gaza area) Total population at 2010 is 840,000 ~ 40% of Gaza population Over pumping Seawater intrusion Geographical location Contamination from agricultural and domestic wastes


7 Land Use 26% Built Up Area 56% Agricultural Lands 18% Open Areas Almond Built-up area Citrus Dates Field crops Fruits Grapes Greenhouse Horticulture Olives Open area Settlements Vegetables

8 Domestic Wells and C.H.B. Sea Shore Line North Gaza Boundary m

9 Over pumping results Steady State Water Level Contour Map Mediterranean Sea
")
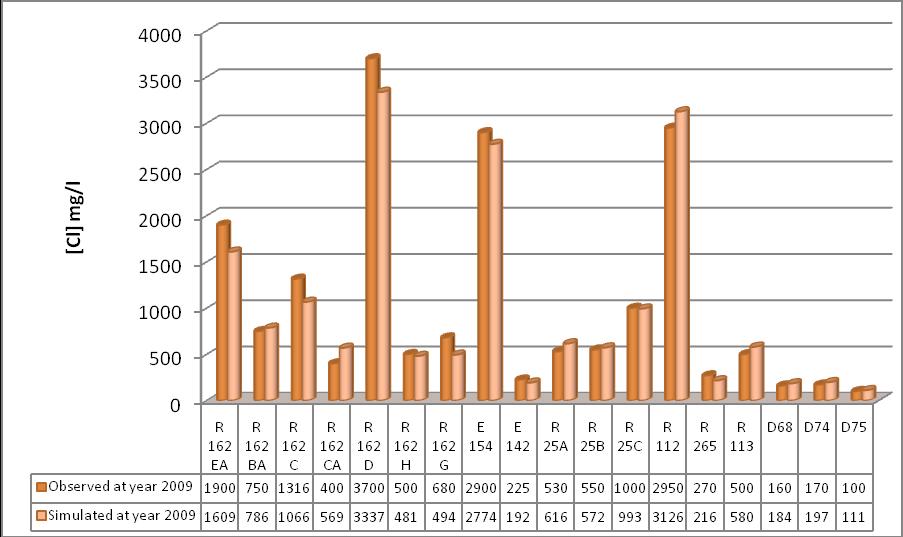
10 Water Quality 250 (Source: Palestinian Water Authority (PWA) reports, 2009)
11 Water Balance Inflow (MCM) Outflow (MCM) Rainfall Recharge 27.7 Municipal Abstraction 62.8 Lateral Inflow 26.6 Agricultural Abstraction 28.9 Return Flows 17.7 Lateral Outflow 1.92 Total 72 Total Net Balance
12 SEAWAT Model Basic Groundwater Flow Model (MODFLOW) Groundwater Transport Model (MT3D) SEAWAT Model Scenario Assessment


13 Temperature Climate Change Scenarios Sea Level Rise Precipitation
,")
14 Warming World Indicators (Source: National Oceanic and Atmospheric Administration (NOAA), July 2010)
 seasonal precipitation (mm) Source: The Intergovernmental Panel on Climate Change,")
15 Precipitation Predictions for Mediterranean Region A2- Control DJF B2- Control DJF seasonal precipitation (mm) seasonal precipitation (mm) Source: The Intergovernmental Panel on Climate Change, (IPCC, 2007) 15
 Max.")
16 Temperature Predictions for Mediterranean Region A2- Control JJA B2- Control JJA Max. Temp (C o ) Max. Temp (C o ) 16 Source: The Intergovernmental Panel on Climate Change, (IPCC, 2007)
17 Climate Change Predictions Indicator Description Magnitude Temperature Increase 4 to 6 C Precipitation Decrease -10% to -30% Evapotranspiration Increase 10% Winter Rains Delay -- Rain Intensity Increase -- Rainy season Shortened -- Seasonal temperature variability Greater -- Sea level rise Increase cm/100yr
18 The Studied Scenarios ID Description Q R S Sc. 1 Existing conditions: (reference scenario): continue pumping at the current rate with no consideration of climate change in Q, R and S No change No change No change Sc. 2 Sensitivity to pumping: take a range for changing pumping rates between -30% and +30% with no consideration of climate change. Varies by a constant factor No change No change Sc. 3 Impact of sea level rise: take the maximum increase in sea level with the assumption that there is no change in both recharge and pumping rates. No change No change Max. rate
19 The Studied Scenarios ID Description Q R S Sc. 4 Sensitivity to recharge: take a range for changing recharge rates between -30% and+30% with no consideration of climate change. No change Varies by a constant factor No change Sc. 5 Extreme impacts of climate change: take the maximum rate of sea level rise and the minimum rate of recharge. No change in pumping rate is considered. No change Min. rate Max. rate Sc. 6 Management Scenario: decreasing pumping due to the reuse of treated wastewater and desalination to cover agricultural and municipal abstraction, respectively. decrease Min. rate Max. rate
20 Model Verification
21 Results Indicator Sc. 1 (Existing condition) Sc. 2 (variable pumping rates) Sc. 3 (Max. SLR) Sc. 4 (variable recharge rates) - 30% + 30% - 30% + 30% Sc. 5 (Max. CC impact) Sc. 6 (Manag. Sc.) [Cl] extent (m) at year ,200 4,000 4,300 4,300 4,500 3,900 4,300 2,900 Seawater intrusion (m/yr) at year [Cl] (+ %) at wells compared to Sc. 1 at year % to -43% 7% to 24% 0.2% to 0.5% 8% to 20% -17% to -30% 3% to 8% -81% to -99%
22 Results 5000 In-Land Seawater Intrusion (m) Scenario 1 Scenario 2 (-30%) Scenario 2 (+30%) Scenario 3 Scenario 4 (-30%) Scenario 4 (+30%) Scenario 5 Scenario 6
23 Conclusions Continuity of the current situation will cause shutdown of about 50% of the wells. Seawater intrusion is more sensitive to recharge decrease than pumping rates increase. The outcomes of Sc. 6 confirms the potency of PWA management plan.
24 Conclusions Reuse of treated WW for agriculture use will save ~ 38% of agriculture abstraction. Desalinization plants for domestic use will save ~ 55% of municipal abstraction.
25 Recommendations PWA must go ahead in implementing the strategic plan. Existing wastewater treatment plants must be developed. Random and illegal abstraction must stop immediately. Improving the municipalities water network system (system efficiency). Agricultural sector should be managed through efficient use of treated wastewater.

26 Many Thanks for Your Attention