MODEST GROWTH RATE RETREAT IN THE MANUFACTURING SECTOR
|
|
|
- Aron Newton
- 5 years ago
- Views:
Transcription


1 A. Gary Anderson Center for Economic Research For Release: Contact: Raymond Sfeir Professor of Economics and Research Fellow (714) MODEST GROWTH RATE RETREAT IN THE MANUFACTURING SECTOR ORANGE, CA According to a survey of purchasing managers, the California manufacturing economy is expected to grow at a slightly lower pace in the first quarter of 2017 compared to the fourth quarter of The California Composite Index, measuring overall manufacturing activity, decreased from 59.7 in the fourth quarter of 2016 to 58.2 in the first quarter of 2017, indicating expansion but at a slower pace. This decline in the growth rate follows three quarterly increases in the index. Production, inventories of purchased materials, new orders and employment are expected to grow at a lower growth rate, while commodity prices are expected to rise at a faster rate. Supplier deliveries are expected to be slower in the first quarter of 2017.
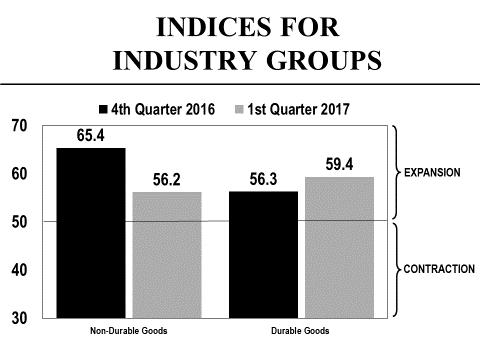
2 California Manufacturing at a Glance Composite Index 58.2 Growing at a lower rate Production 62.6 Growing at a lower rate Inventories of 53.8 Growing at a lower rate purchased materials Commodity prices 69.1 Rising at a higher rate Supplier deliveries 53.6 Slower New orders 61.6 Growing at a lower rate Employment 53.5 Growing at a lower rate Performance by Industry Group The index for the non-durable goods industries registered a sharp decline from 65.4 in the fourth quarter of 2016 to 56.2 in the first quarter of 2017, indicating a much lower rate of growth in the first quarter of this year. Production, inventories of purchased materials, new orders and employment are expected to grow at a lower rate. Supplier deliveries are expected to be slower compared to the fourth quarter of The index for the durable goods industries registered 59.4 in the first quarter of 2017 compared to 56.3 in the fourth quarter of 2016, indicating a higher growth rate in the first quarter of this year. Production, inventories of purchased materials, new orders and employment are expected to grow at a higher rate. Supplier deliveries are expected to be slower compared to the fourth quarter of Comments by the Purchasing Managers Fourth quarter is seasonal peak; 1st quarter of 2017 has lower business volumes coming off peak but still fairly strong and similar to last year. (Food) Packaged Ice is very seasonal. Larger production relative to demand is normal in first quarter as we build inventory to allow for maintenance shutdowns. (Beverage & Tobacco) Part of our business is outdoor cushions and pillows. A very seasonal business with shipments starting in December thru April. Then it dies. (Textile Mills) I am noticing lead times all around taking a few extra weeks, I am assuming it's partially because of the holiday but also partially because most people expected the ACU pattern to disappear from military orders, went very lean into buying and making it and new contracts came out requesting pretty large quantities of it and the supporting materials that go on it. (Apparel) Fall and winter are seasonally busy for us. Demand for mail remains strong. Existing customers are steady. Reallocation of capacity thanks to consolidation on the part of some customers is bringing new work to the west coast, something we haven't seen for a while. That translates into new work for us. (Paper) We anticipate a good Orders are improving and there seems to be a general small business optimism as a result the election outcome. We are acquiring several new pieces of equipment and should our predictions be correct, we plan to purchase a few more pieces of equipment. (Wood Products) 2
3 Keeping labor aligned with budget expectations will be key for the 1st quarter in Raw materials have been flat for the printing industry, and I expect an increase in those raw material costs for early (Printing & Related Support Activities) Biotech is seems to be slowing down a little but my business is still growing. Trying to catch up to the rest of the biotech companies. (Chemicals) Q1 is generally our best, and we anticipate that again in (Plastics & Rubber Products) Usual seasonal downturn in first quarter will be proportional to the severity of winter weather. Probably due to election cycle, large amount of work was pushed back into Enactment of California AB 219 has forced smaller producers like ourselves to forgo bidding public works projects which could manifest in volume losses as more investment in infrastructure comes to fruition. (Nonmetallic Mineral Products) Steel prices going up due to tariff on Chinese steel. (Fabricated Metal Products) We continue to receive orders, backlog continues to be 3 weeks. Do not know what to expect with the new administration in the White House. If the government is expected to expand the economy, then we should see our business growing with new orders. (Machinery) We have been very busy, operating at near capacity. I expect the markets will experience a slight inflation but the stocks are plentiful. (Computer & Electronic Products) We expect better year for (Electrical Equipment, Appliance & Components) Power Sports industry is flat for quarter four and may continue for quarter 1 in (Transportation Equipment) Hopefully after all the Hoo-Haa regarding the election will settle down and business will get back to usual. The first quarter of the year is typically slow, but this year will be a little slower. (Furniture & Related Products) California's regulations and non-business friendly environment continues to cause issues within our manufacturing and service industry. Prices continue to rise on all levels; supplies, insurance rates and other services related to the sign industry. Hopefully some of the Trump administrations business friendly actions will filter into California but I'm skeptical. (Miscellaneous) European customers continue to place orders, but there is still some concern about what will happen when Brexit actually moves forward. We expect some additional business in Russian aviation markets to be available that is currently off limits after Trump takes office. (Aerospace Products & Parts) 3
4 4

5 Background and methodology The Institute for Supply Management (ISM) conducts a monthly national survey of purchasing managers and publishes the survey results in its Report on Business. Such a survey is not available for the state of California. Given the size of our state, and the major role its manufacturing sector plays in the national economy, the A. Gary Anderson Center for Economic Research at Chapman University launched a quarterly survey of California purchasing managers starting in the third quarter of Similar to the ISM survey, our survey tracks changes in production, employment, new orders, inventories of purchased materials, commodity prices and supplier deliveries. Except for commodity prices and inventories of purchased materials, a seasonally adjusted index is computed for each variable. In order to have one single indicator for the performance of the state manufacturing sector, the Anderson Center has developed a Composite Index that is a weighted average of the underlying indices. A value of 50 for the Composite Index shows a general expansion of the manufacturing economy of the state and a value below 50 shows a decline. The industries are classified according to the North American Industry Classification System (NAICS). 5
6 Detailed Results of the Survey of California Purchasing Managers Expectations for the First Quarter of 2017 In its attempt to present you with a better delivery of the survey results, the A. Gary Anderson Center for Economic Research has calculated an index for every variable in the survey. The "% Better," is added to half of the "% Same," after which a seasonal factor is used to get a seasonally adjusted index for each variable (except commodity prices). A value over 50 for an index indicates growth and a value below 50 indicates a decline. If for example the index increases from 55 to 59, we say that the growth rate is higher than the previous quarter because 59 is bigger than 55. If the index remains at 55, we say that the growth rate remains the same as the previous quarter. If the index decreases from 55 to 52, we say that we still have growth but that the growth rate is lower than the previous quarter because 52 is smaller than 55. Each industry in the manufacturing sector is represented in the survey based on its employment share of total manufacturing employment in the state. Production: The seasonally adjusted index for production is expected to decrease from 65.8 in the fourth quarter 2016 to 62.6 in the first quarter of 2017, indicating that production is expected to increase at a lower rate in the first quarter of this year. This is the thirty first consecutive quarter that the production index has been above 50. Production is expected to increase most rapidly in the following industries: Beverage & Tobacco; Textile Mill Products; Apparel; Paper; Printing & Related Support Activities; Chemicals; Plastics & Rubber Products; Wood Products; Nonmetallic Mineral Products; Primary Metals; Fabricated Metal Products; Machinery; Computer & Electronic Products; Electrical Equipment, Appliance & Components; and Transportation Equipment. The Food industry reported an expected decrease in production. Production % Higher % Same % Lower Net Seasonally Adjusted Index 1 st Quarter of th Quarter of rd Quarter of nd Quarter of Inventories of Purchased Materials: The seasonally adjusted index for inventories of purchased materials is expected to decrease from 57.2 in the fourth quarter of 2016 to 53.8 in the first quarter of 2017, indicating that inventories are expected to increase at a lower rate in the first quarter of this year. Inventories of purchased materials are expected to increase most rapidly in the following industries: Textile Mill Products; Printing & Related Support Activities; Chemicals; Wood Products; Nonmetallic Mineral Products; Primary Metals; Fabricated Metal Products; Machinery; Computer & Electronic Products; and Electrical Equipment, Appliance & Components. Inventories of purchased materials are expected to decrease most rapidly in the following industries: Food; Transportation Equipment; and Miscellaneous. Inventories of Purchased Materials % Higher % Same % Lower Net Seasonally Adjusted Index 1 st Quarter of th Quarter of rd Quarter of nd Quarter of
7 Commodity Prices: The seasonally unadjusted index for commodity prices is expected to increase substantially from 56.0 in the fourth quarter of 2016 to 69.1 in the first quarter of 2017, indicating that commodity prices are expected to rise at a much higher rate in the first quarter of this year. Commodity prices are expected to rise most rapidly in the following industries: Food; Textile Mill Products; Leather & Allied Products; Paper; Printing & Related Support Activities; Chemicals; Plastics & Rubber Products; Wood Products; Nonmetallic Mineral Products; Primary Metals; Fabricated Metal Products; Machinery; Computer & Electronic Products; Electrical Equipment, Appliance & Components; Transportation Equipment; Furniture & Related Products; and Miscellaneous. No industry reported an expected decline in commodity prices. Commodity Prices % Higher % Same % Lower Net Index 1 st Quarter of th Quarter of rd Quarter of nd Quarter of Supplier Deliveries: For this variable, an index value over 50 indicates slower deliveries, and an index value under 50 indicates faster deliveries. The seasonally adjusted index for supplier deliveries is expected to increase from 49.2 in the fourth quarter of 2016 to 53.6 in the first quarter of 2017, indicating that supplier deliveries are expected to be slower in the first quarter of this year. Supplier deliveries are expected to be slowest in the following industries: Textile Mill Products; Printing & Related Support Activities; Chemicals; Wood Products; Primary Metals; Fabricated Metal Products; Computer & Electronic Products; and Transportation Equipment. The Plastics & Rubber Products industry reported an expectation of faster supplier deliveries. Supplier Deliveries % Slower % Same % Faster Net Seasonally Adjusted Index 1 st Quarter of th Quarter of rd Quarter of nd Quarter of New Orders: The seasonally adjusted index for new orders is expected to decrease from 63.2 in the fourth quarter of 2016 to 61.6 in the first quarter of 2017, indicating that new orders are expected to increase at a lower rate in the first quarter of this year. New orders are expected to increase most rapidly in the following industries: Textile Mill Products; Apparel; Paper; Printing & Related Support Activities; Chemicals; Plastics & Rubber Products; Wood Products; Nonmetallic Mineral Products; Primary Metals; Fabricated Metal Products; Machinery; Computer & Electronic Products; Electrical Equipment, Appliance & Components; Transportation Equipment; and Miscellaneous. The Food industry reported an expected decrease in new orders. New Orders % Higher % Same % Lower Net Seasonally Adjusted Index 1 st Quarter of th Quarter of rd Quarter of nd Quarter of
8 Employment: The seasonally adjusted index for employment is expected to decrease from 57.9 in the fourth quarter of 2016 to 53.5 in the first quarter of 2017, indicating that employment in manufacturing is expected to show very little improvement in the first quarter of this year. Employment is expected to increase most rapidly in the following industries: Apparel; Paper; Printing & Related Support Activities; Chemicals; Plastics & Rubber Products; Nonmetallic Mineral Products; Primary Metals; Fabricated Metal Products; Machinery; Electrical Equipment, Appliance & Components; Transportation Equipment; and Miscellaneous. The Food industry reported an expected decrease in employment. Employment % Higher % Same % Lower Net Seasonally Adjusted Index 1 st Quarter of th Quarter of rd Quarter of nd Quarter of High-Tech Industries: The high-tech industries include the following: Computer & Electronic Products, and Aerospace Products & Parts. The high-tech industries currently employ about 338,300 employees, amounting to 26.5% of total manufacturing employment in the state. The percent of purchasing managers in the Computer & Electronic Products industry reporting higher expected production increased from 39.4% in the fourth quarter of 2016 to 41.6% in the first quester of Additionally the percent of purchasing managers reporting higher expected employment in these industries barely increased from 16.1% in the fourth quarter of 2016 to 16.2 in the first quarter of

9 Orange County s Manufacturing Survey The Orange County manufacturing sector s Composite Index increased from 57.0 in the fourth quarter of 2016 to 63.4 in the first quarter of 2017, indicating that the county s manufacturing economy is expected to grow at a higher rate in the first quarter of this year. This is the highest value for the index since the first quarter of The seasonally adjusted index for production increased from 64.3 in the fourth quarter of 2016 to 68.3 in the first quarter of 2017, indicating that production is expected to grow at a higher rate in the first quarter of this year. This is the thirty first consecutive quarter that the production index has been above 50. The seasonally adjusted index for new orders increased substantially from 58.5 in the fourth quarter of 2016 to 67.4 in the first quarter of 2017, indicating that new orders are expected to grow at a much higher rate in the fourth quarter of this year. Unlike California, both the inventories of purchased materials and employment indices increased in the first quarter of The index for the non-durable goods industries decreased from 64.0 in the fourth quarter of 2016 to 52.2 in the first quarter of 2017, indicating that the growth rate in these industries is expected to be lower in the first quarter of this year. This large decrease is due to the large expected decease in production, inventories of purchased materials and new orders. The index for the durable goods industries on the other hand increased from 60.3 in the fourth quarter of 2016 to 68.3 in the first quarter of 2017, indicating that the durable goods industries are expected to grow at a higher rate in the first quarter of this year. Production, inventories of purchased materials, new orders and employment are all expected to increase in the first quarter of
10 ABOUT THE ANDERSON CENTER FOR ECONOMIC RESEARCH The A. Gary Anderson Center for Economic Research (ACER) was established in 1979 to provide data, facilities and support in order to encourage the faculty and students at Chapman University to engage in economic and business research of high quality, and to disseminate the results of this research to the community. ANNUAL SCHEDULE OF CONFERENCES AND PRESS RELEASES JANUARY FEBRUARY MARCH APRIL MAY JUNE Economic Forecast Conferences for the Inland Empire California Purchasing Managers Survey California Leading Employment Indicator California Consumer Sentiment Survey California Purchasing Managers Survey California Leading Employment Indicator California Consumer Sentiment Survey Economic Forecast Update Conference for the U.S., California and Orange County JULY AUGUST SEPTEMBER OCTOBER NOVEMBER DECEMBER California Purchasing Managers Survey California Leading Employment Indicator California Consumer Sentiment Survey California Purchasing Managers Survey California Leading Employment Indicator Economic Forecast Conference for the U.S., California and Orange County California Consumer Sentiment Survey 10